Consulting presentations are the foundation of professional communication in disciplines like strategic planning, management, and corporate decision-making. Notably, firms like McKinsey & Company, Boston Consulting Group (BCG), and other leading management consulting firms have mastered the art of creating effective slide decks to a level where these presentations are not just tools but strategic assets.
Fundamentally, consultant presentation slides allow business professionals to share insights, recommendations, and any kind of complex data in a coherent, visual, engaging format that facilitates understanding [3]. In this article, we will explore what defines a consulting presentation, what a consulting slide deck is, and the types of templates we can implement in our daily work lives for this purpose.
Table of Contents
- What is a Consulting Presentation?
- What is a Consulting Presentation Template?
- Types of Consulting Presentation Slides
- Final Words
- References
What is a Consulting Presentation?
A consulting presentation is a carefully structured visual tool consultants use to communicate analyses, findings, and recommendations to clients. It synthesizes complex information into digestible, visually engaging slides that facilitate understanding and decision-making [1]. Typically, these presentations are grounded in rigorous research and analysis and aim to address specific client challenges or opportunities.
Consulting presentations serve multiple purposes: to inform, persuade, and provide a clear path forward based on data-driven insights and strategic thinking. The effectiveness of a consulting presentation lies in its ability to make the complex simple, turn data into narratives, and inspire action among its audience, which often includes key stakeholders and decision-makers within an organization.
What is a Consulting Presentation Template?
We can define a consulting presentation template as a slide or slide deck tailored to create assets inside consulting presentations. These templates can depict graphs, diagrams, roadmaps, dashboards, strategies, etc. Presenters can mix and match templates from different styles, modify their PowerPoint theme, customize the content, and get it ready to create a unique slide deck for a consultancy report.
Types of Consulting Presentation Slides
In this section, we will group the different consultancy presentation templates by category. Remember that McKinsey presentations, BCG slides, and other popular consulting deck options are made from these tools.
Strategy Consulting Templates
Strategy consulting templates are visual tools designed to assist in developing and presenting business strategies. They facilitate a systematic approach to analyzing market conditions, competitive landscapes, and internal capabilities to make strategic decisions. McKinsey slide decks and Deloitte presentations are fine examples of this category.
Market Analysis and Competitive Landscape
Whenever we use market analysis or competitive landscape templates, we aim to present research on market trends, customer behavior, and competitive landscapes. To name a few potential options, we can work with a Go-To-Market template outlining the target market, value proposition, marketing and sales strategies, distribution channels, and competitive analysis of a product or service release.

A second option would be to work with a Sales Battlecard, a concise, strategic document used by sales teams to understand and communicate the key features, benefits, and differentiators of their product or service compared to competitors. It’s designed to equip sales representatives with quick references and talking points highlighting competitive advantages and addressing potential objections during sales conversations. For this reason, it can be instrumental in consulting presentations to develop new sales strategies for your operators.

A third option is to implement a Competitive Landscape slide in the format of a competitor matrix to identify the leading competitors and understand their products, strategies, strengths, weaknesses, market share, and positioning. By analyzing competitors’ performance and strategies, a business can better position itself, differentiate its offerings, anticipate competitor moves, and identify areas for growth and improvement.

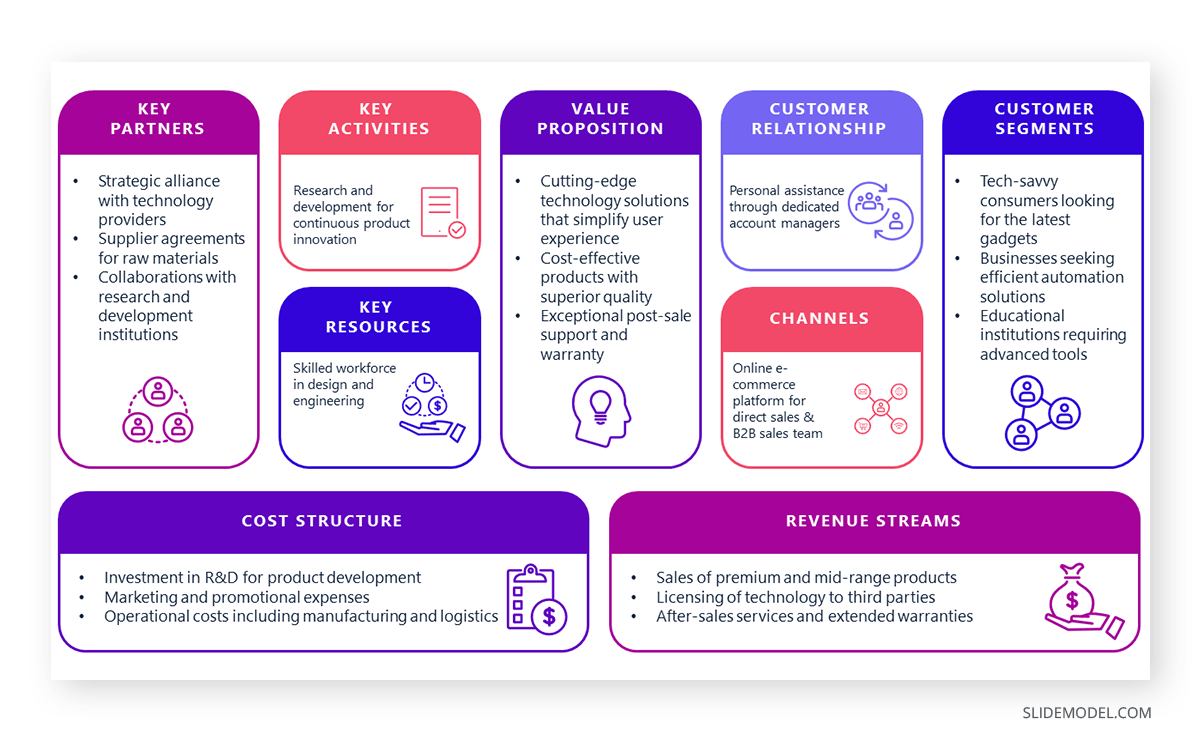
Business Model Canvas
The business model canvas evaluates a company’s value proposition, infrastructure, customers, and finances. Therefore, it helps businesses align their activities by illustrating potential trade-offs. The canvas includes nine key components: Key Partners, Key Activities, Key Resources, Value Propositions, Customer Relationships, Channels, Customer Segments, Cost Structure, and Revenue Streams.
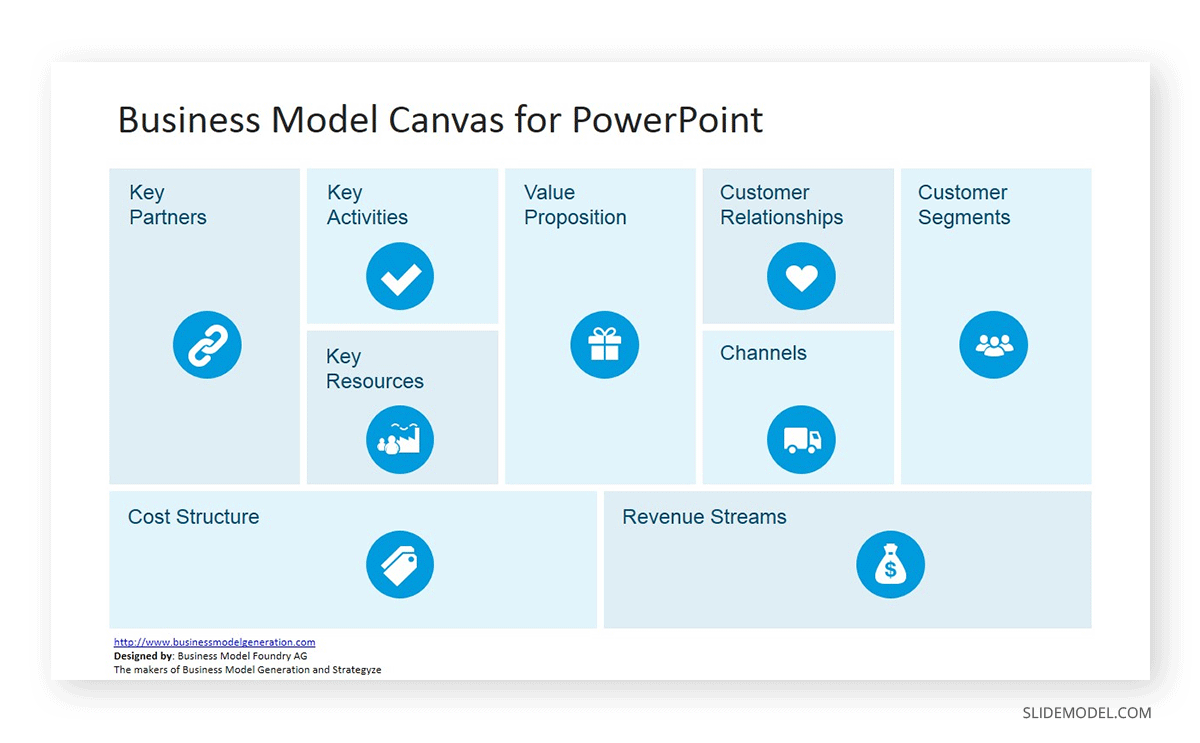
If you seek a creative option, try this layout alternative to the typical business model canvas PPT template.
SWOT Analysis (Strengths, Weaknesses, Opportunities, Threats)
The SWOT analysis framework is a popular tool across presenters as it can be repurposed for any industry. They allow us to provide a comprehensive overview of the current strategic situation for consultancy presentations. Organizations can then leverage strengths and opportunities while addressing weaknesses and mitigating threats.
Some options of SWOT Analysis PPT templates include:


Porter’s Five Forces Analysis
Porter’s Five Forces is a framework developed by Michael E. Porter that analyzes the industry structure and corporate strategy. It identifies the intensity of competition and attractiveness of a market through five forces: Competitive Rivalry, Threat of New Entrants, Threat of Substitute Products or Services, Bargaining Power of Suppliers, and Bargaining Power of Buyers. In consulting presentations, this framework is instrumental for several reasons:
- Industry Analysis and Strategic Planning: This tool allows us to get a comprehensive overview of the external environment, which helps customers understand an industry’s dynamics. It will also enable consultants to identify where power lies in business situations, guiding the decision-making toward profitability and competitiveness. You can find some McKinsey slides examples covering this approach [2].
- Assessment of Profitability Potential: A market with weak forces suggests higher profitability potential, while solid forces may signal a competitive and challenging market.
- Investment Decisions: For clients considering entering new markets or industries, Porter’s Five Forces can guide investment decisions by highlighting the barriers to entry, the potential for rivalry, and other critical factors influencing the sector’s attractiveness.

Blue Ocean Strategy
The Blue Ocean Strategy, developed by W. Chan Kim and Renée Mauborgne, is a business strategy that encourages companies to create new demand in an uncontested market space, or a “Blue Ocean,” rather than competing head-to-head with other companies in an existing industry, or “Red Ocean.” This approach focuses on innovation, differentiation, and creating value for both the company and its customers, leading to new opportunities for growth.
Consultants can apply this framework to encourage clients to explore new, uncontested markets. Another approach is to emphasize the importance of the unique value proposition.
Presenters can also combine this tool with strategic planning to boost organizational innovation.

Strategy Roadmap
To implement the strategies defined in a plan, consulting firm presentations must use graphic methods to clearly depict the different stages. This is where Strategic Roadmaps become valuable resources for consulting presentations. We can use the road metaphor for the roadmap, work with timelines, or use any other visual tool to depict a segmented plan.

Operations Consulting Templates
Operations consulting templates are visual tools designed to showcase the analysis and improvement of business processes and operations. Business professionals can use these graphic elements in presentations to identify bottlenecks, waste, and opportunities for improvement. In short, operations consulting templates enable consultants to deliver actionable recommendations that enhance operational performance.
Supply Chain Management
Supply Chain Management (SCM) is a critical element in Operations as it involves overseeing/managing the flow of goods and services, from raw materials to delivered products to the customer. Working with SCM templates helps consultants present tailored reports about supply chain processes and their inefficiencies: bottlenecks, sub-optimized stages, etc. Consequently, organizations can work on cost-reduction strategies, leverage IoT technologies, and aim for sustainable practices.

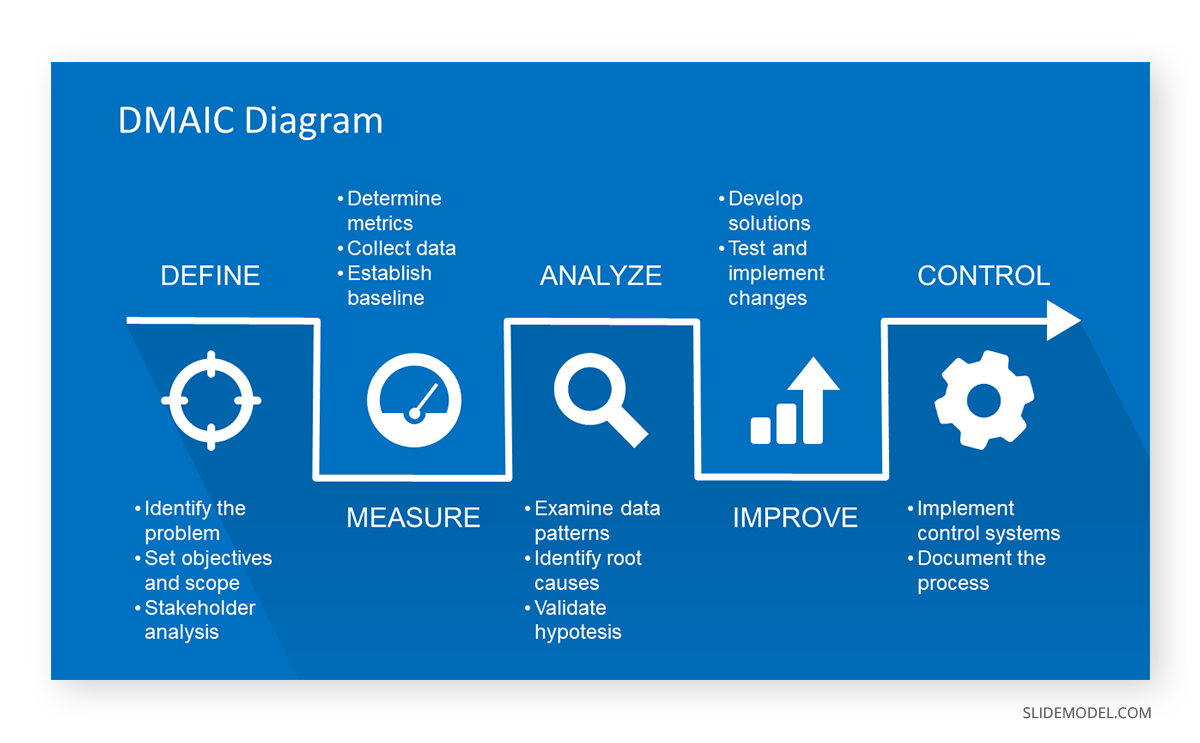
Lean Management and Six Sigma
Presenters can use a multitude of slides to discuss lean management or Six Sigma processes, but above all, two elements stand out: the DMAIC and the SIPOC diagram.
The DMAIC diagram can be used for multiple cases in consulting presentations. One option would be presenting a case study where defining the project scope led to targeted improvements, illustrating how a similar focus could benefit the client. For companies already implementing Six Sigma strategies, consultants can share benchmark data and metrics from past projects during the Measure phase, showing how precise measurement informed the strategy. Or discuss an Analyze phase from a previous engagement where deep data analysis revealed unexpected insights, suggesting a thorough examination could uncover similar opportunities for the client.
In turn, the SIPOC diagram can visually summarize a process by mapping out its key components, aiding in understanding and communication with the client. Consultants can highlight specific segments of the SIPOC diagram to pinpoint where inefficiencies or issues occur, directing focus to areas with the most significant potential for improvement. Another use in consulting presentations is before implementing changes, as the SIPOC diagram can capture the current state of a process as a baseline, making it easier to measure the impact of improvements post-implementation.

Performance Dashboard
As the final element in this category, consultants are often hired to analyze a company’s performance. This is where Performance Dashboard PPT templates shine, offering a visual method to share condensed data extracted from analysis. The performance dashboard can reflect sales operations, logistics, marketing engagement rate, and plenty of other options. It’s a versatile tool that can be customized to track different metrics.


Financial Consulting Templates
Financial consulting templates help consultants guide the analysis and presentation of financial data, strategies, and recommendations. They enable systematically reviewing and communicating aspects of financial health, including performance analysis, budgeting, forecasting, and investment strategies. Elements like financial ratios, cash flow analysis, and cost-benefit assessments are typical examples, allowing for a comprehensive evaluation of financial stability and growth opportunities.
Financial Performance Analysis
Several tools can be used to conduct a financial performance analysis in a consulting presentation. The typical options are the Profit & Loss (P&L), financial dashboards, and performance review templates.


Cost Reduction Strategies
These templates showcase proposed strategies to minimize operational costs and increase overall profit. We can select the preferred presentation template depending on the company’s size, operational complexity, and other variables. Here, we leave you two potential options.


Investment Appraisal
The Investment Appraisal slide deck contains tools to evaluate the viability and profitability of proposed investments or projects. Although you can find some valuable tools for this in the format of Porter’s Five Forces, DMAIC and SIPOC, and SWOT analysis, it’s best to work with tailored slide decks for investment and financial projects.

Mergers & Acquisitions (M&A) Strategy
Business deals and negotiations regarding mergers or company acquisitions should be handled carefully. Consultants addressing clients about these two situations must communicate clearly, simplify the steps to follow, define the best practices to complete the process smoothly and define how to communicate with the personnel. You can check our Business Partnership PowerPoint template for a well-rounded framework for consultants to discuss these topics.

Financial Modeling Overview
We can work with plenty of templates for this last element to discuss financial modeling. For instance, the P&L model is a good fit in this category, but we can broaden our horizons – depending on the type of analysis – by using tools like the ones below.
The Efficient Frontier Curve is a concept from portfolio theory. It illustrates the set of optimal portfolios that offer the highest expected return for a given level of risk or the lowest risk for a given level of expected return. As part of a financial model overview, it can help investors understand the risk-return trade-off of different investment portfolios, aiding in selecting an investment strategy that aligns with their risk tolerance and return objectives.

The Optimal Capital Structure Curve demonstrates the relationship between a company’s debt-to-equity ratio and its overall cost of capital. Including this in a financial model overview can provide insights into how different financing strategies might affect a company’s value. It highlights the theoretically optimal mix of debt and equity financing that minimizes the company’s cost of capital and maximizes its value.

The Trade Off Theory of Capital Structure Curve suggests that there’s an optimal capital structure where the tax benefits of debt financing are balanced against the costs of financial distress. Including this curve in an overview can illustrate companies’ balancing act in deciding how much debt to take on, considering the benefits of tax shields against the potential costs of bankruptcy or financial distress.

Finally, the CAPM Capital Asset Pricing Model Curve determines the expected return on an asset or portfolio based on its beta (volatility or risk relative to the market). This model can be part of a financial model overview to demonstrate the relationship between the expected return of a security or portfolio and its risk, helping investors understand how to price risk when making investment decisions.

Human Resources Consulting Templates
Human Resource (HR) consulting templates are PPT templates designed to assist in evaluating and improving HR functions such as recruitment processes, talent management, and employee performance evaluation, to name a few. HR consulting templates enable consultants to offer actionable insights and recommendations that support the development of a motivated, efficient, and cohesive workforce aligned with the organization’s goals.
Organizational Design and Development
Whenever we think about organizational development, Org Charts come to mind. We can work with the classical, tier-oriented chart that is easy to understand from a quick view or opt for more complex models like matrices, multi-layered level org charts, etc.

Talent Management Strategy
Talent Management PPT templates are oriented to increase the efficiency levels of talent supply inside organizations. HR teams can implement these templates to identify vacant areas, establish suitable candidate criteria, or develop training programs for the current workforce.

Employee Engagement and Satisfaction
HR consultants often collaborate with multidisciplinary teams to boost employee engagement and foster a company culture across all levels. Employee satisfaction remains a core factor, which can be linked to financial or environmental factors and career development opportunities. To address those needs in presentation design, consultants can use models like Maslow’s Hierarchy of Employee Engagement or the X Model of Employee Engagement.


Compensation and Benefits Analysis
Another stage in HR consultancy services is tailoring attractive recruiting strategies for companies in highly competitive markets, such as the IT industry. Since employees often ask for the benefits of their job offer, consultants can use tools like Employee Benefits Diagrams to express the importance of their value proposition regarding the company culture.

Training and Development Roadmap
Continuous education plans are among the tasks requested by HR consultancy services. Professionals can impact clients by delivering custom-made slide decks as if the stakeholders were part of the event, a practice commonly seen in McKinsey slides [2]. These slide decks will state the learning objectives to achieve, development roadmap, roles and responsibilities, knowledge assessments, etc.

Digital Transformation Consulting Templates
Digital Transformation Consulting Templates are slides or slide decks designed to guide organizations through integrating digital technology into all business areas. These templates help map out strategies to change how businesses operate and fundamentally deliver value to customers. They cover digital strategy formulation, technology adoption, process digitization, and digital skill development.
IT Infrastructure Review
This category features a long list of templates, as we can talk about reviewing the current network infrastructure, a migration process from physical storage to the cloud, or ITIL processes.

Digital Marketing Strategy
In our experience, consultants offering digital marketing services are required to use slide decks to wow prospective clients into hiring their agency. This can be either for SEO consultancy, e-commerce, social media marketing, and plenty of other options.

Another take in this category is when internal consultancy is done regarding the current digital marketing strategy, and the experts have to share their findings across all levels of the organization to adjust the efforts in the right direction.

Risk Management Consulting Templates
Risk Management Consulting Templates help consultants identify, assess, and present mitigation strategies for potential risks within an organization. The core aspect these templates focus on is analyzing the impact those threats can pose on a business’s operation, financial health, or reputation.
Risk Assessment Framework & Compliance
Multiple methods and tools are used for risk assessment. For instance, we can use a typical Deloitte Governance Framework Model, work with a ROAM chart, use an RMF Framework, or the COSO Cube, to name a few.


Alternatively, we can use a risk assessment matrix. Keep in mind that some of the tools mentioned in this category work both for compliance and risk assessment.

Cybersecurity
Consultancy presentations regarding cybersecurity can have two potential main uses: the first one, is where the findings of research about cybersecurity are presented to the management or key team members. This is with the objective of fixing potential threats to the organization. The second take is from a consultancy agency on cybersecurity that aims to promote its services, thus requiring high-quality visuals to communicate its value proposition to potential clients [3].


Change Management Consulting Templates
Change Management Consulting Templates are designed to support organizations through transition processes. Whether implementing new technologies, organizational restructuring, new manufacturing processes, or other changes, these templates ensure that employees are guided, supported, and motivated throughout the transformation process.
Change Management
Management consulting slide decks are used to guide clients through the process of planning, implementing, and sustaining changes within their organizations. Several models can be a good fit for this purpose, like the ADKAR framework, change management diagrams, change management models, and even change management slide decks.


Stakeholder Analysis
Stakeholder Analysis templates are ideal whenever we need to systematically identify, categorize, and assess the interests and influence of individuals or groups critical to the success of a project or initiative. This can involve working with a stakeholder matrix to evaluate their influence level and prioritize strategies, or simply identifying the stakeholders in a diagram at the initial stages of a project.


Communication Plan
A communication plan is a high-level document that includes all the information pertinent to the organization’s business objectives, goals, competitors, and communication channels. These kinds of presentations are created when the communication plan is presented to key stakeholders and management, so all details can be reviewed before sharing the document across all levels of the organization. We can work with generalist communication plans or niche-specific ones, like marketing communication plans.

Customer and Marketing Consulting Templates
Customer and Marketing Consulting Templates were created to enhance engagement with target markets and customers. By implementing these templates, consultants can represent insights for market segmentation, product positioning, or mapping the customer journey. This, in turn, helps businesses align marketing efforts with real consumer needs and preferences in their niche.
Customer Journey Mapping
Customer Journey Mapping templates are used in consulting presentations to provide a visual overview of a customer’s experience with a brand, product, or service from initial contact through various stages of engagement and long-term relationships. They serve to identify key interactions, touchpoints, and the emotional journey customers undergo.
The usage of these consulting slides helps pinpoint areas for improvement, uncover customer pain points, and highlight moments of delight. By mapping out the customer journey, consultants can offer targeted recommendations for enhancing the customer experience, improving customer satisfaction, and ultimately driving business growth.


Market Segmentation
Market Segmentation Templates are utilized in consulting presentations to visually categorize a market into distinct groups based on various criteria like demographics, psychographics, behavior, and needs. These templates help illustrate the composition of a market, showcasing how each segment differs in terms of preferences, purchasing behavior, and responsiveness to marketing strategies.
By employing market segmentation templates, a consulting company presentation can effectively communicate targeted strategies for reaching and engaging specific customer segments. This approach aids businesses in focusing their marketing efforts more efficiently, tailoring products, services, and messaging to meet the unique needs of each segment. Examples of templates we can use are the PAM TAM SAM SOM model, a target market diagram, the VALS framework, or generic market segmentation slides.


Marketing Mix Strategy (4Ps)
The Marketing Mix Strategy (4Ps) templates help consultants delineate how each component (Product, Price, Place, and Promotion) can be optimized to meet the target market’s needs and achieve a competitive advantage. This, in turn, allows us to provide recommendations on product development, pricing strategies, distribution channels, and promotional tactics.

Alternatively, we can work with more complete frameworks, like the 7Ps Marketing Mix or the 8Ps Marketing Mix.

Customer Satisfaction and Loyalty Analysis
One commonly asked consultancy service is to explore customer satisfaction and brand loyalty, and for that reason, presenters can work with customer lifecycle templates, which explore the process from a buying need to a recurring consumer of a brand.

If the issue regarding customer satisfaction is linked to customer service, then consultants can evaluate factors like the customer service maturity level – going from cost-based strategies to customer service that adds value to a consumer’s life.

Customer satisfaction surveys are typically conducted in this kind of analysis, and results can be presented using templates like the NPS Gauge Infographic.

Sustainability and ESG Consulting Templates
Sustainability and ESG (Environmental, Social, Governance) Consulting Templates are slides that help presenters communicate sustainable practices and ESG principles into their organization’s operations. They assess the importance of environmental impact, social responsibility, and governance practices, becoming actionable tools to define sustainable goals, measure progress, and communicate achievements.
Sustainability Strategy and Roadmap
Sustainability Strategy and Roadmap consultancy PowerPoint templates allow us to outline an organization’s approach to integrating sustainable practices into its business operations. Consultants work with these templates to present a structured plan, from setting sustainability goals to implementing initiatives and monitoring progress.


ESG (Environmental, Social, Governance) Reporting Framework
ESG slide templates enable consultants to communicate a company’s commitment to sustainability, ethical practices, and social responsibility to stakeholders. By showcasing achievements, challenges, and future goals, these templates facilitate transparent dialogue with investors, customers, and regulatory bodies. They are crucial for companies looking to demonstrate accountability, enhance their reputation, and attract sustainability-conscious investors and consumers.

Circular Economy Strategy
In our final category, we can find the circular economy strategy templates, which aim to redefine growth and focus on positive society-wide benefits. These templates enable consultants to illustrate how businesses can transition from a linear “take-make-waste” model to a circular economy model that designs out waste, keeps products and materials in use, and regenerates natural systems. By detailing strategies for sustainable product design, recycling, reuse, and remanufacturing, the templates help visualize companies’ steps to become more sustainable and efficient.


Final Words
Creating a tailored consulting slide deck from scratch involves hours of planning, including which information you intend to deliver, which graphic outlook will engage the audience, how you will highlight key factors, and the list goes on. Therefore, we invite you to explore the possibilities that consulting presentation templates offer regarding reduced effort and better time management for your presentations. All the designs shown in this article can be fully customized to the presenter’s requirements or preferences.
References
[1] Alexander, E. R. (1982). Design in the Decision-Making Process. Journal Name, 14(3), 279-292.
[2] Rasiel, E. (1999). The McKinsey Way. McGraw-Hill.
[3] Sibbet, D. (2010). Visual Meetings: How Graphics, Sticky Notes and Idea Mapping Can Transform Group Productivity. Wiley.
[4] Baret, S., Sandford, N., Hida, E., Vazirani, J., & Hatfield, S. (2013). Developing an effective governance operating model: A guide for financial services boards and management teams. Deloitte Development LLC.