Clear communication and a proper process structure are critical points for operational efficiency. Among the most powerful tools organizations can use for this purpose, the SIPOC diagram is ideal for representing a process chain, from supplier to end customer.
Join us to learn more about what SIPOC diagrams are, how to create and use them in PowerPoint presentations, and a detailed application case on this topic. Let’s get started.
Table of Contents
- What is a SIPOC Diagram?
- What is a SIPOC Diagram Used for?
- What Questions to Ask When Making a SIPOC Diagram?
- Benefits of using SIPOC Diagrams in Organizations
- Disadvantages of SIPOC Diagrams
- Case Study: Implementing a SIPOC Diagram in a Chip Manufacturing Company
- How to Make a SIPOC Diagram in PowerPoint
- Editing The Template For Making A Custom SIPOC Diagram
- Conclusion
What is a SIPOC Diagram?
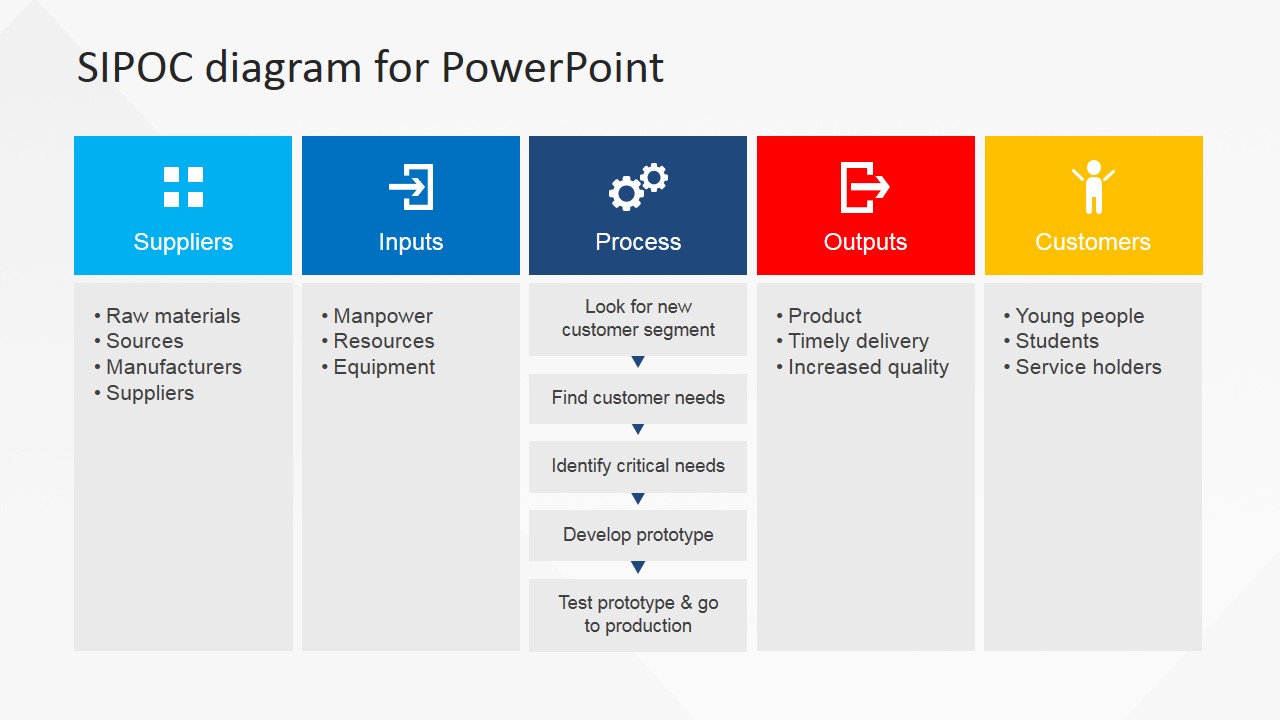
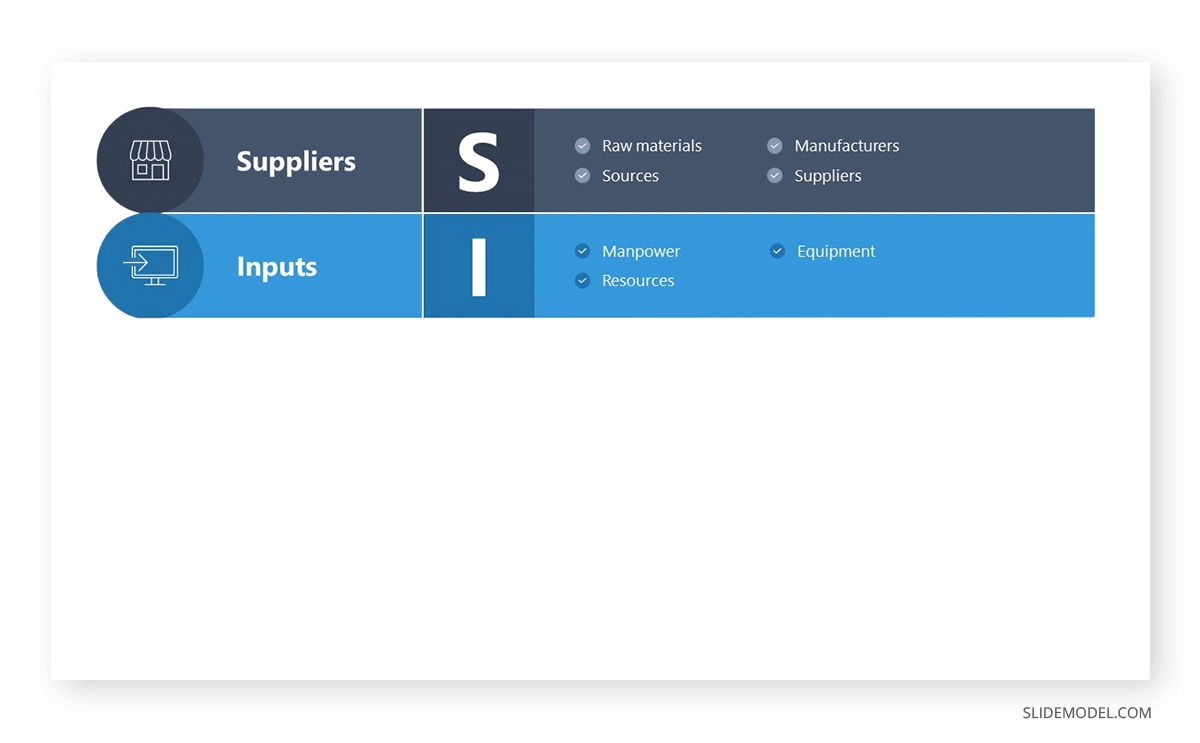
The SIPOC concept stems from the Six Sigma methodology, which is a set of methods for improving a process. Also applied in Lean methodologies and Total Quality Management (TQM), a SIPOC diagram includes 5 components, namely:
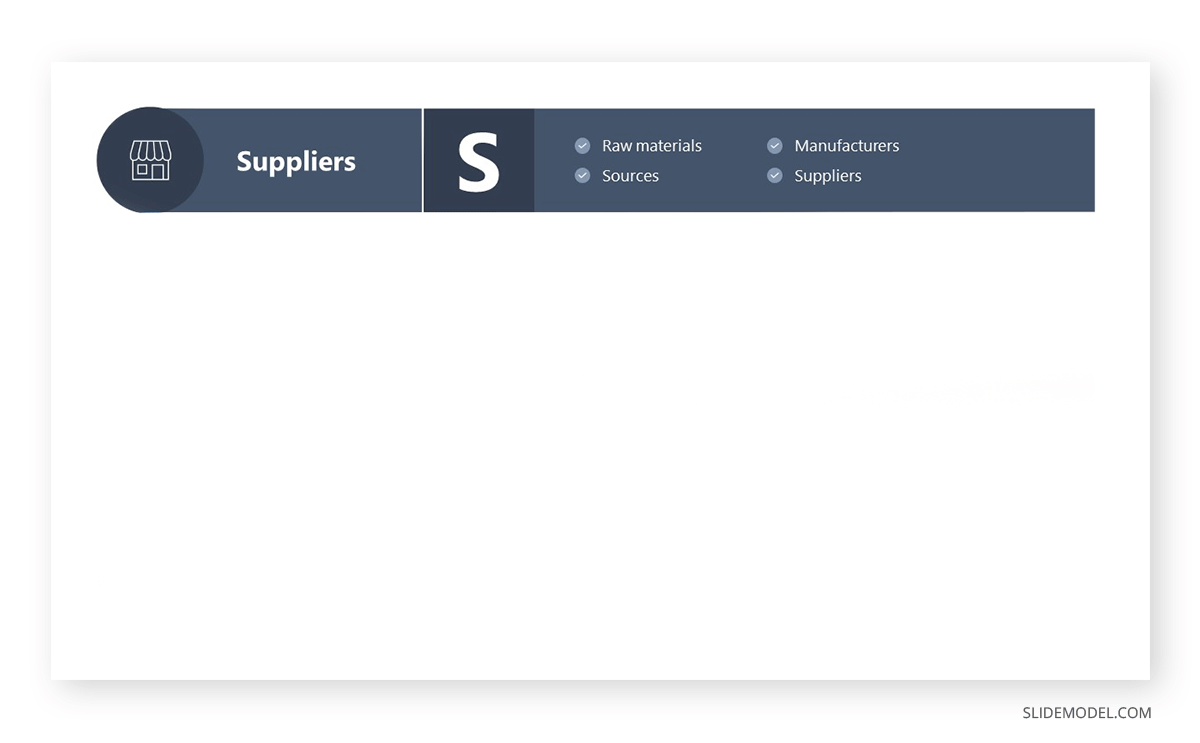
- Suppliers
- Inputs
- Process
- Outputs
- Customers
Suppliers
We can define as Suppliers the actors that provide the required inputs to run the process. These entities can be either internal teams (or departments), as well as external vendors or contractors.
Since Suppliers are the origin point on the SIPOC diagram, understanding their role has multiple implications:
- Defining the quality of inputs.
- Preventing production bottlenecks.
- Guaranteeing process quality and efficiency.
- Achieving better Cost Management processes.
- Applying an effective Risk Management strategy – especially when counting with more than one supplier so the production chain doesn’t experience unexpected disruptions.
Inputs
Although Inputs can be interpreted as raw materials, they can also represent digital or physical data, human resources, and even specialized machinery. The link between inputs and suppliers lies in the fact that suppliers provide the inputs to the organization, hence the importance of their timeliness and reliability, as faulty inputs have a bearing on severe production delays.
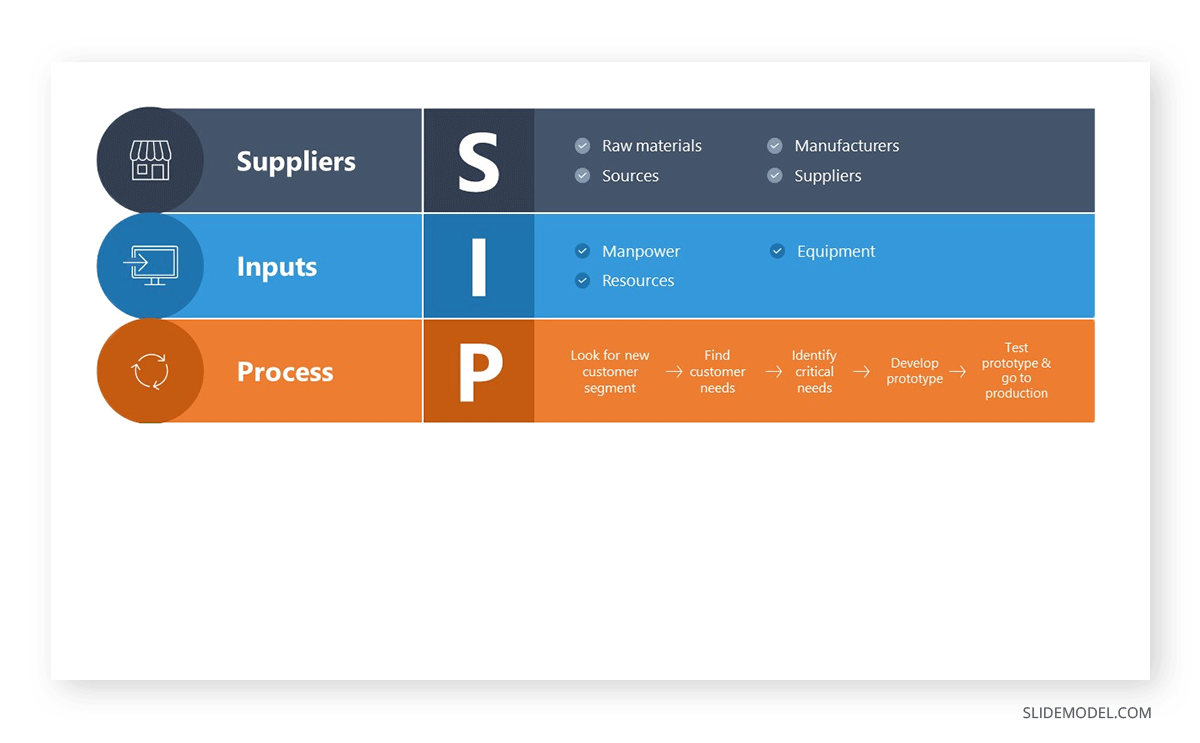
Process
We can define as process any activity that involves the application of a specific methodology, tools, and techniques to transform the inputs into valuable objects – with the purpose of being commercialized. These processes must be clear for the organization’s personnel to guarantee production efficiency and minimize loss.
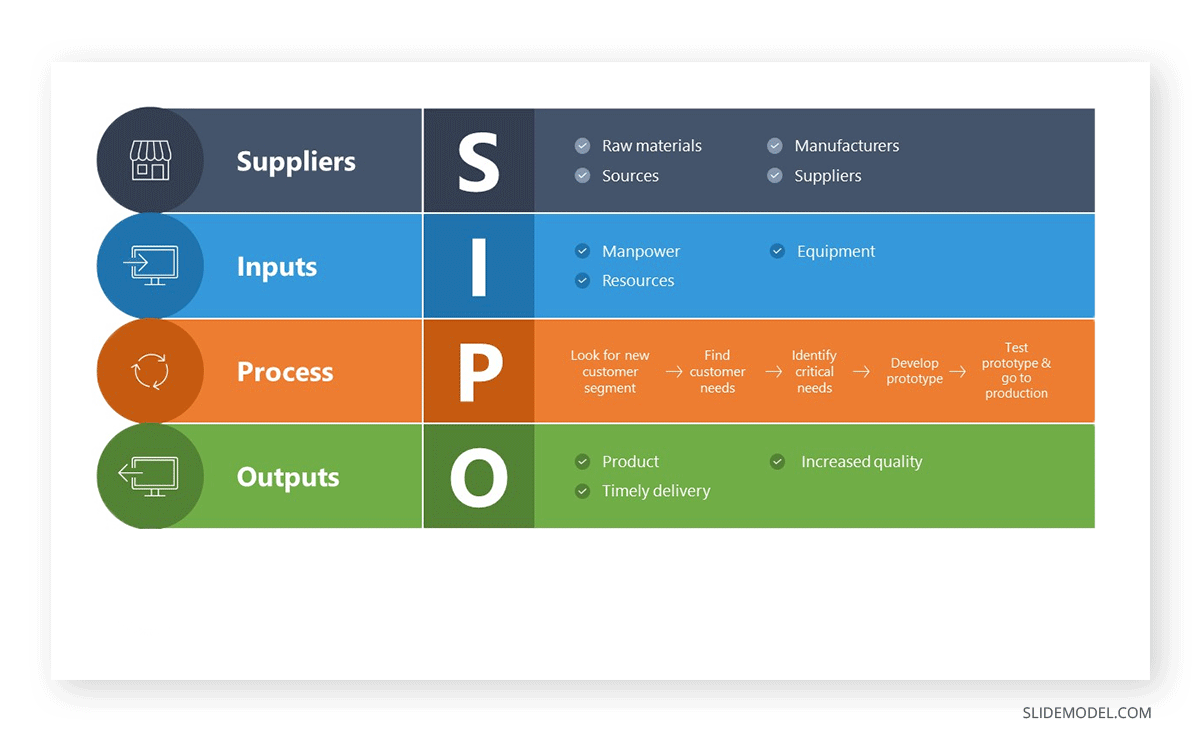
Output
The end goods or services created during the Process stage are known as Outputs. They can be physical products, digital products or services, as well as in-person services. Still, it is worth noticing that internal processes such as Customer Service from an organization can be considered as Output in the SIPOC diagram.
Customers
The final component of the SIPOC diagram is the customers. They can be individuals (when tailored for B2C) or organizations (B2B) that utilize the outputs generated through the company’s processes. Again, there’s a categorization to mention, since customers apply to both external customers and to departments within the organization (internal customers).
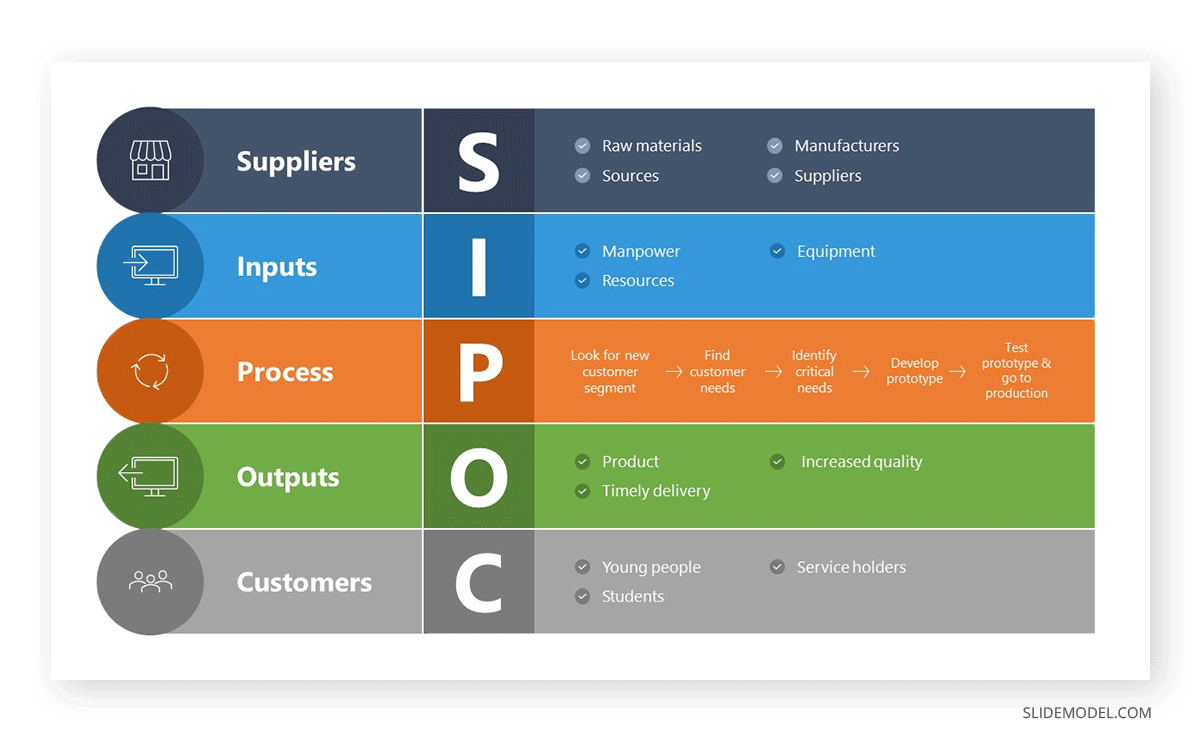
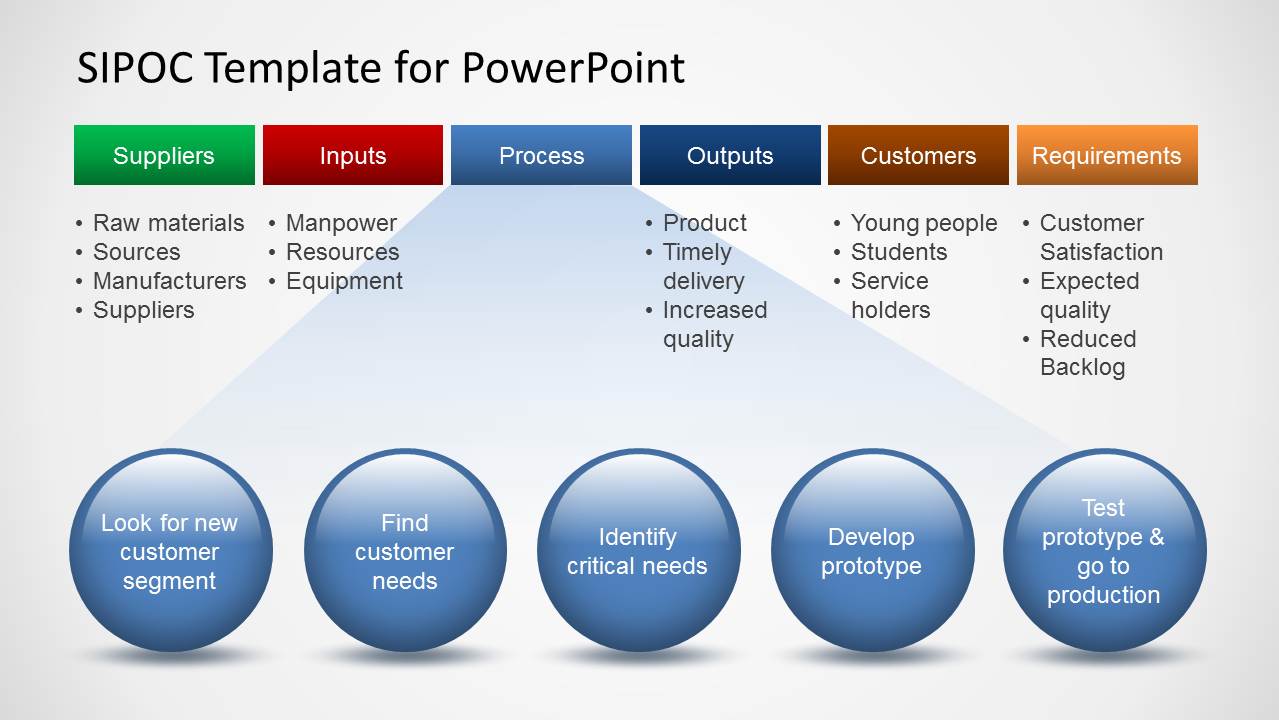
These five components are laid out in the form of a diagram as different columns of a table. As SIPOC is primarily meant to address customer satisfaction, it is also known as COPIS, where the information in the table is populated starting from the customer to the supplier. It’s worth mentioning that SIPOC diagrams can be a product of other process improvement initiatives like Kaizen, a Japanese philosophy for improvement.
What is a SIPOC Diagram Used for?
A SIPOC diagram outlines the suppliers, inputs, process, outputs, and customers as a visual map outlining a business process. By understanding or outlining the processes within a working system, the SIPOC diagram can get a visual map for defining, scoping, and structuring the system. Furthermore, SIPOC mapping can help identify weaknesses and problems within a working system.
A SIPOC diagram can help identify various important aspects of a working system, such as:
- Identifying the start and end points of a working system.
- Essential steps within a working system.
- Identifying the main inputs and outputs.
- Identifying key suppliers.
- Identifying key customers.
- Identifying customer demands.
- Identifying the scope and structure of the work system.
- Identifying the weaknesses and problems within a working system.
What Questions to Ask When Making a SIPOC Diagram?
From a project management approach, it’s best to ask a few questions when constructing your diagram. Since a SIPOC diagram helps provide a structure for discussing a process, it’s important to take some time to analyze the key aspects of the visual map you are looking to construct. A few questions worth considering include the following:
- What is the scope of the work system from start to end?
- Who supplies inputs to the process?
- What specifications are placed on the inputs?
- What is the output of the process?
- Who are the true customers (internal and external)?
- What are the requirements of the customers?
Answering the questions mentioned above can help you better outline the scope and structure of the diagram and all its key elements before you proceed with constructing your SIPOC diagram.
Benefits of using SIPOC Diagrams in Organizations
A SIPOC diagram facilitates effective communication among an organization’s stakeholders, thus why it is used in process improvement methodologies. Hence, all members share common ground while also boosting the chances of targeting potential areas of growth. As benefits of working with SIPOC Diagrams, we can highlight:
- Improved Communication: It can terminate language barriers or common misunderstandings between stakeholders from different departments, as well as align team members towards the same vision.
- Acknowledging a Competitive Gap: Organizations often work under “tunnel-vision” mode unless an opportunity is so visible that’s impossible to miss. This is why team leaders focus on developing creative thinking methodologies for their teams to pinpoint potential growth areas within their current resources. The clear layout of the SIPOC diagram helps teams to visualize the potential of allocating resources for new value streams, or to question the expenses made by their current suppliers. Those are just two of the multiple applications we can find on this behalf.
- Process Comprehension: In organizations where a complex network of dependencies is laid out, it is hard to visualize areas of improvement or hidden causes behind bottlenecks. The SIPOC diagram is an ideal resource for both managers and employees to understand the process flow and make decisions based on facts – yet, it faces restrictions.
Disadvantages of SIPOC Diagrams
The limitations of SIPOC diagrams are strictly linked to the scope they are able to frame and its time-demanding nature for updates.
- Limited Process Overview: Finer details in processes may be overlooked as the SIPOC diagram doesn’t enable that low-level study. It should be complemented with other tools or paired with production monitoring solutions.
- Time-Bound: SIPOC diagrams can be seen as “static” since they frame a specific time period in which processes happen. If your organization goes through dynamic phases, this implies you need to constantly update your SIPOC diagram to count with accurate data.
- Time-Consuming: Again, working with reliable data means updating the SIPOC diagram as many times as required. This is a time-consuming task that can lower the efficiency of your team if that factor is neglected.
Case Study: Implementing a SIPOC Diagram in a Chip Manufacturing Company
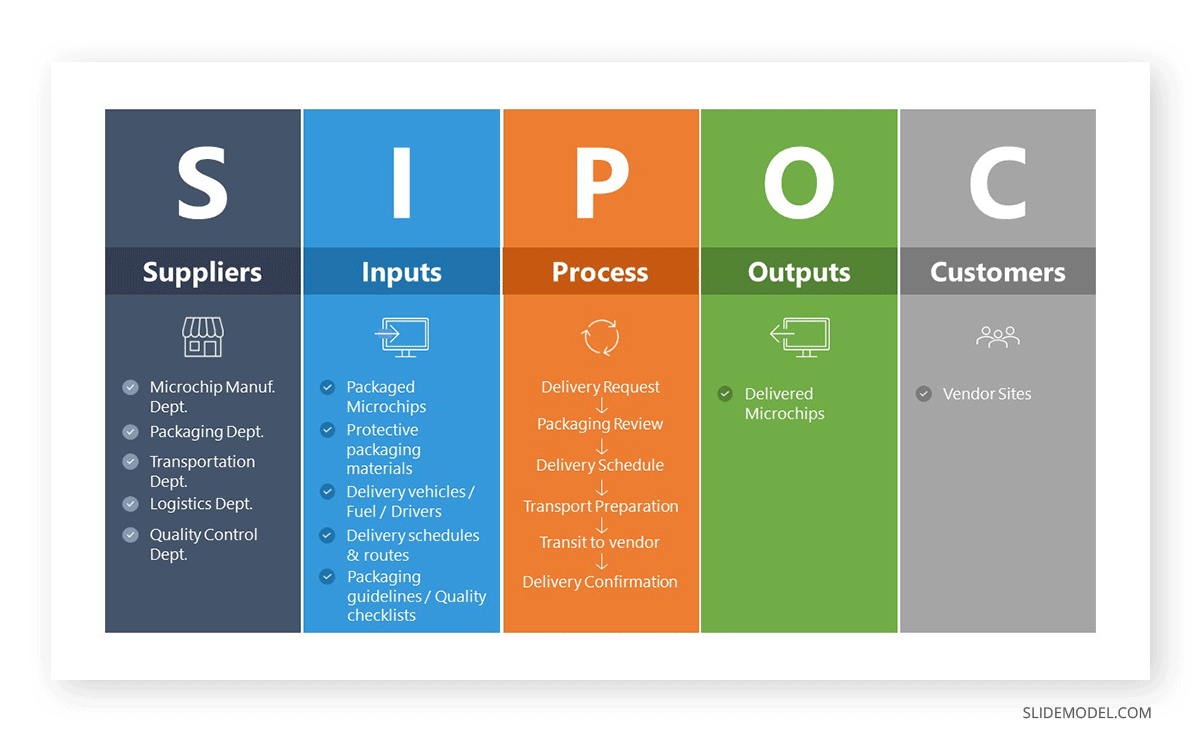
We will expose a case study to understand the usage of SIPOC Diagrams in real-life. GreenCore, a microchip manufacturing company, intends to optimize their delivery process, which received complaints from some resellers in terms of delays and packaging quality. Therefore, GreenCore opted for a SIPOC diagram to gain a better understanding on the delivery process to their vendors.
The first step is to identify the Suppliers. In this case, we count with:
- Microchip Manufacturing Department
- Packaging Department
- Transportation Department
- Logistics Department
- Quality Control Department
Next, we have the Inputs, which in this case are:
- Microchips (packaged)
- Protective packaging materials
- Delivery vehicles / Fuel / Drivers
- Delivery schedules / Delivery routes
- Packaging Guidelines / Quality checklists
The microchips are released in a packed condition from the Microchip Manufacturing Department to the Packaging Department, where the protective packaging materials are applied for enhanced safety conditions. Then, the fully-packed product is transported in the delivery vehicles, which require stops to refuel depending on the final destination, assigned to a driver. The skills from the driver make a difference in how long the delivery is going to take and the care by which the packaged product is handled while in transportation. The Logistic Department is the one in charge of the delivery schedules, selecting the best delivery routes to ensure the minimal delivery time to each reseller. Prior to departing from the factory, the Quality Control Department performs a series of quality checklists to compare the finished product with the packaging guidelines created by them.
Regarding the Process stage, we can identify several parallel processes concerning the different departments. Overall, it starts with a request for delivery, followed by a packaging review. The order is allotted in a schedule, so once it reaches the first slot in the queue, the transportation units will take the goods requested to the vendor sites. Once arrived, the vendor has to send a delivery confirmation form to GreenCore.
The Output is the delivered microchips, and our Customers are the resellers who receive the microchips. Put together, we end up with a diagram template like this one below.
How To Make A SIPOC Diagram Using PowerPoint
After studying our example above, it is time to craft a SIPOC Diagram using our ready-made PowerPoint templates. We will list down the step-by-step process.
You can use many methods for creating a SIPOC diagram in PowerPoint, including using SmartArt Graphics, tables, and readymade PowerPoint templates. For this post, we will use the SIPOC Analysis PowerPoint Template to create a SIPOC diagram in PowerPoint, one of many SIPOC Templates available at SlideModel.
You might also be interested in our Google Slides Templates, which include numerous slide decks for business processes.
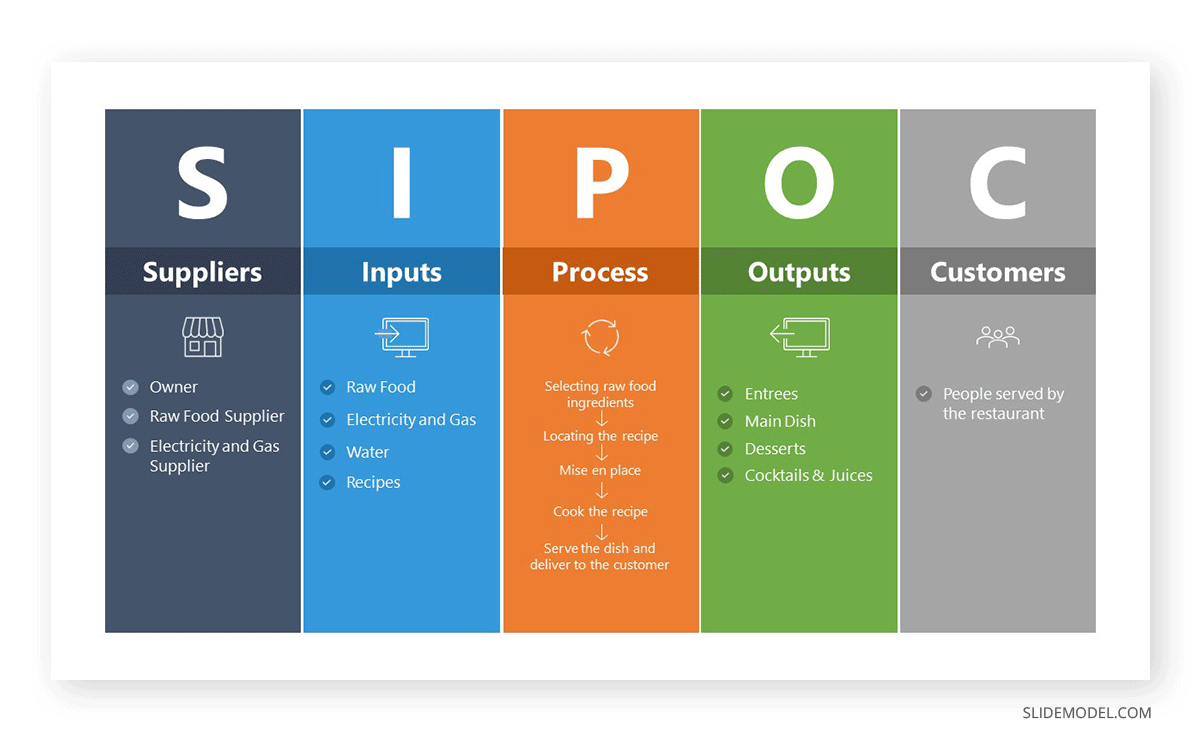
In the following steps, we will provide an example of a SIPOC diagram for food preparation at a restaurant with examples regarding the key suppliers and inputs, the process, outputs, and customers. For each step, we have also outlined information for different types of businesses, for which requirements might vary when constructing such a diagram.
Step 1 – Identify the Suppliers
The suppliers are among the first things to identify when designing a SIPOC diagram. These might include persons, machines, departments, processes, etc. A supplier in a SIPOC diagram implies anyone who affects the output.
Example: In our example of a restaurant, the suppliers would include the owners, the company providing raw food supplies, and the utility companies offering electricity and gas.
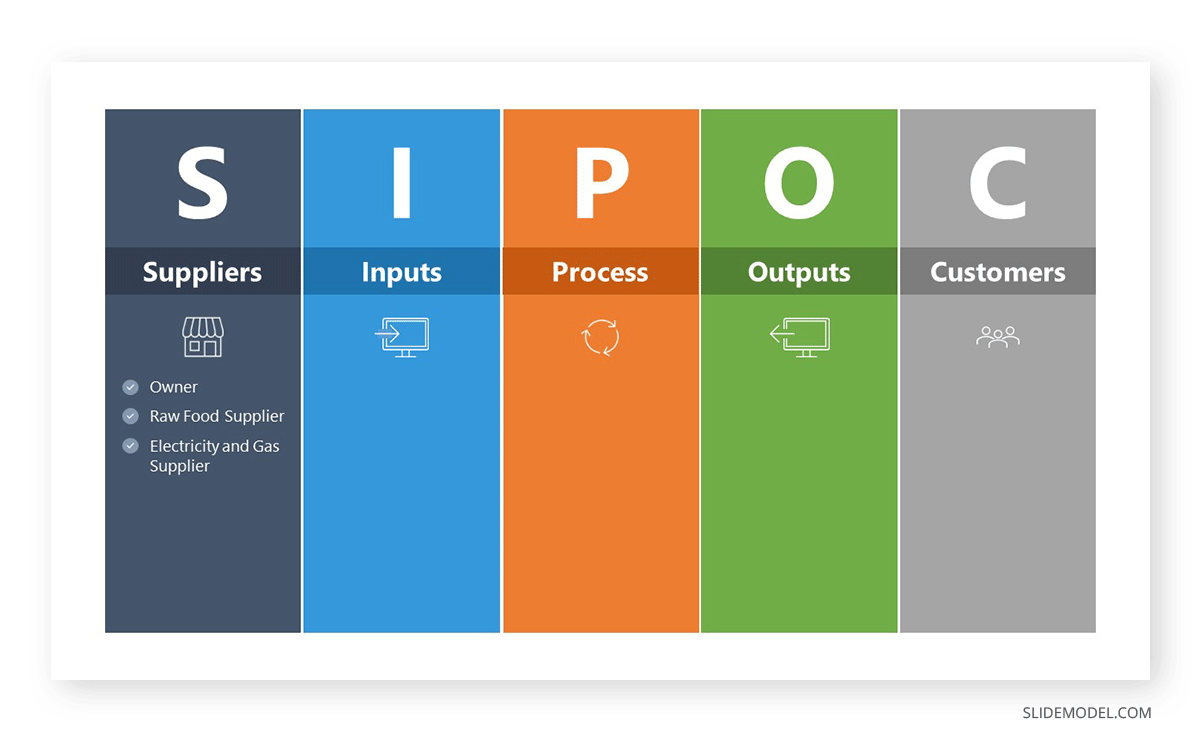
While a restaurant is a brick-and-mortar business, other types of businesses, such as ones providing digital services, would have very different suppliers. For example, a website’s supplier might include a hosting service, domain name provider, a Content Delivery Network (CDN), etc.
Step 2 – Identify Required Inputs
In this section, identify a few of the major outputs without going into supporting details. These might include 3-4 key outputs such as the raw material, data, workforce, knowledge, information, etc.
Example: In the example of a restaurant, the inputs can include the recipes, the raw material such as fruits, vegetables, meat, and dairy products, as well as the electricity and gas consumed to run business operations. Notice how the suppliers correspond to inputs in each step. The owners provide the recipes, and the raw food supplier supplies the fruits, vegetables, meat, and dairy products, followed by the utility companies providing electricity and gas.
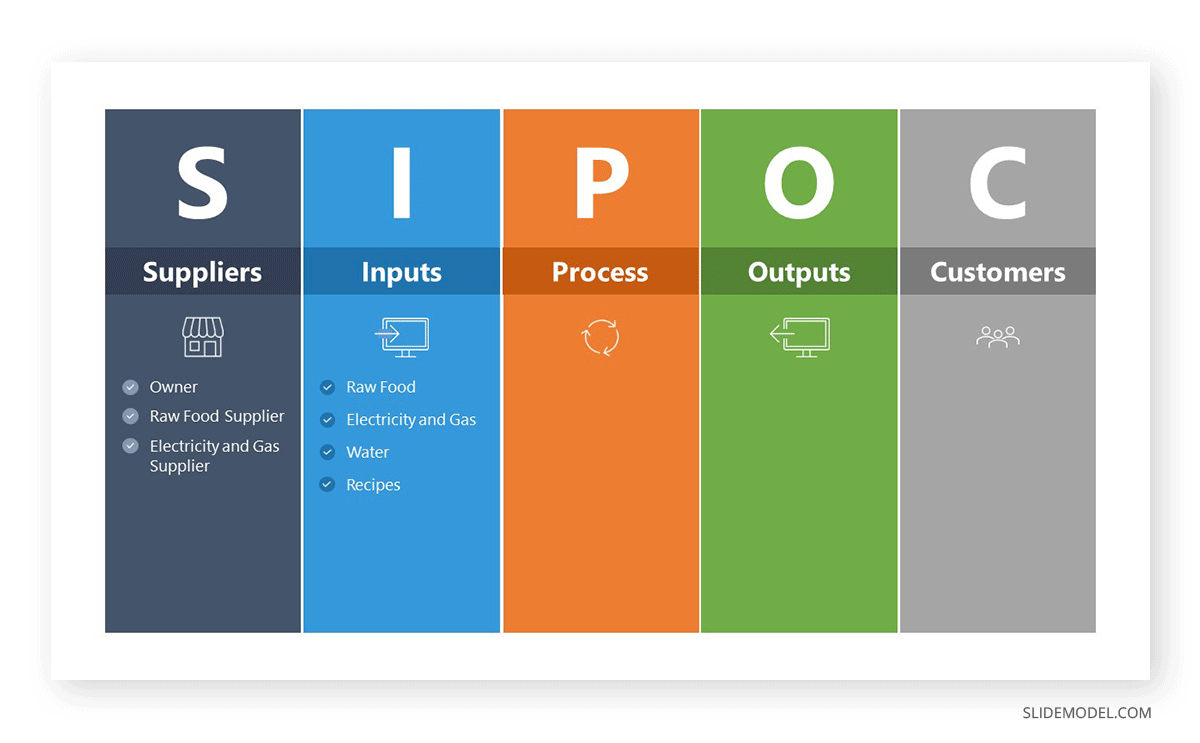
The inputs can be tangible or intangible, depending upon the type of service or product. For example, in the case of a digital service, the inputs would be very differently defined, such as a website would require a CMS, web space to host a website, web hosting control panel, domain name provider, Content Delivery Network (CDN) provider, etc.
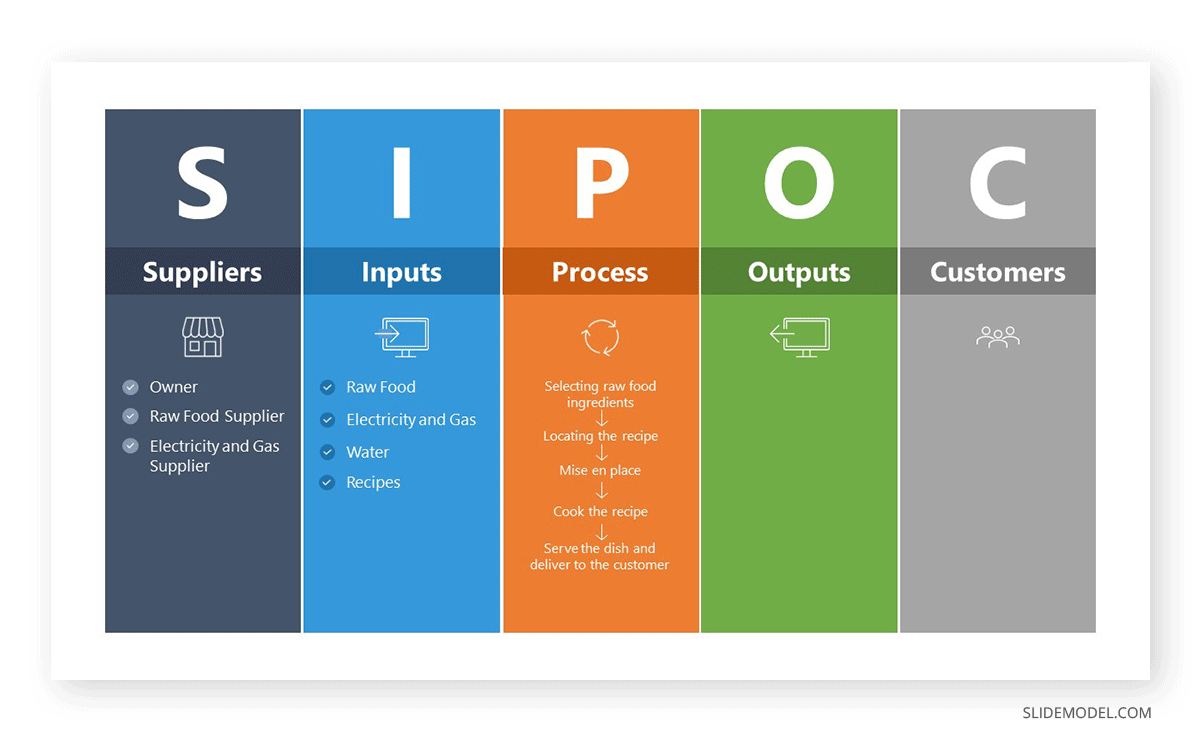
Step 3 – Outline the Process
This is where you outline the business process. This does not include every minor detail. You can add 4-5 major steps to map out the process’s start and end points as a simplified flowchart. A general rule is that you should not exceed 7 steps when defining the process. This can help maintain perspective and not add too many details to avoid getting lost in translation.
Example: Preparing cooking operations and adding ingredients for cooking specials is one example of how a simple process for food preparation at a restaurant can be outlined. When making a SIPOC diagram, outline the process in simple steps to visualize how the process works from start to end. In our example, the cooking operations start the process, where ingredients are added, and food is prepared for customers.
But what would be the output if the business process included a service, such as a digital service? For an e-commerce business, it could be a website or even a mobile app that end users can use to use their service. In B2B operations, one business might develop a service for another business, or one department might develop something for another department within a business. An MIS department might develop a system for a team to log and analyze information by maintaining a database using an app or CMS. Similarly, some departments might be exclusively set up to cater to the needs of other departments, such as a cafeteria for employees of a large organization.
Step 4 – Define Outputs
When defining outputs, you should use nouns to mention the output, such as the materials, products, information, knowledge, services, etc. In other words, this is where you mention what is being produced at the very end of the business process for the customer.
Example: A simple output for a SIPOC diagram for food preparation would be the cooked meals & drinks. This output eventually serves customers and is the required goal based on the supplies, inputs, and processes. If this were an establishment providing halls for training, marriage ceremonies, and meetings, we would require outlining these outputs accordingly in the SIPOC diagram.

The outputs can differ vastly based on the business process. The output for brick-and-mortar businesses would be very different from digital services. Similarly, businesses providing products and those offering services would have very different outputs.
Step 5 – Customers
The last part of a SIPOC diagram includes defining the customers of the final output. This can include end users, business customers, other departments, colleagues, and other businesses.
Example: In our example of restaurant food preparation, the customers would include the people served by the restaurant. The customer would be defined accordingly if this were a process to serve another department. Similarly, in B2B settings, the customer would be another business, an operating system, app, or website; the customer would be the end user.
Editing The Template For Making A Custom SIPOC Diagram
This template is relatively easy to edit and merely requires populating your bits from one or more processes to generate a SIPOC diagram. The SIPOC template offers three different designs for making your diagrams. You can edit out any part of the template by simply clicking on the given text-boxes (to add your text) or by inserting additional placeholders; to add images clipart or text.

Using various built-in PowerPoint editing options, you can further enhance the look of your diagrams by using the PowerPoint Drawing Tools (as shown below).

The below image shows a sample SIPOC diagram generated using the SIPOC Template For PowerPoint.
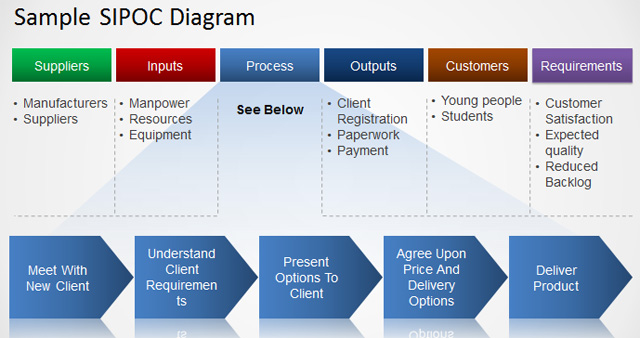
You can download this template by signing up for a Slide Model subscription, which will give you access to countless professionally designed PowerPoint Templates for making diagrams and presentations on topics as diverse as business, science, engineering, manufacturing, architecture, and the like.
Conclusion
There are different ways of approaching a SIPOC diagram. Besides the method mentioned above, you can start by defining the process followed by outputs, customers, and suppliers. There are no hard and fast rules regarding how to begin and end the identification of each part of a SIPIC diagram, and you can start with suppliers or the process itself to construct your diagram.
The corresponding elements of a SIPOC diagram can vary based on the process itself. SIPOC diagrams aren’t limited to customers of a business since they can also be used to define the scope and structure of a process for a B2B arrangement and interdepartmental arrangements to serve one business to another or one department serving the needs of another.
When should I create a SIPOC diagram?
Create a SIPOC diagram at the start of a process improvement project, during a Lean Six Sigma Define phase, or when onboarding a new team to a process. It’s especially useful when you need to clarify a process’s boundaries or improve communication between teams.
What is the difference between SIPOC and COPIS?
COPIS is simply the reverse order of SIPOC (Customer-Output-Process-Input-Supplier). It is often used when you want to adopt a “customer-first” mindset by identifying customer needs before mapping the rest of the process.
How detailed should a SIPOC diagram be?
A SIPOC diagram is meant to be high-level. Aim for 4-7 steps in the process column and avoid going into granular details like work instructions or sub-tasks. You can later complement it with more detailed process maps if needed. Our SIPIC templates for PowerPoint cover a wide range of variants.
Who should be involved in the preparation of the SIPOC diagram?
A SIPOC diagram should be prepared collaboratively. Typically, process owners, subject matter experts, team leads, and key stakeholders from all impacted departments should participate. Involving cross-functional representatives ensures that suppliers, inputs, and customer requirements are accurately captured.