55+ Bar Chart Templates for PowerPoint and Google Slides
Download Bar Chart PowerPoint Templates. Making bar charts and dashboards with complex data was never easy. With SlideModel’s professionally crafted bar chart templates you can easily create amazing bar charts to present your data in the form of easy to grasp slides.
These unique slide designs are easy to edit, with the option to comprehensively customize the very basic aspects of each sample slide, including objects within the slide designs. Pick a bar chart template from our collection to represent your data in an impressive layout.
Featured Templates

3D Growth Bar Chart for PowerPoint

Global Sales Bar Chart Template for PowerPoint

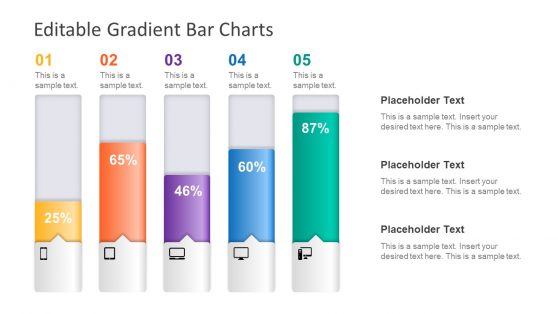
Editable Gradient Bar Chart for PowerPoint

3D Bar Chart Template Design for PowerPoint with 4 Bars
Latest Templates

3D Pie & Bar Charts for PowerPoint

One Page Business Fact Sheet Slide Template for PowerPoint

Flat Business PowerPoint Template

Superhero PowerPoint Template

Waffle Charts PowerPoint Template

Animated PowerPoint Charts Collection Template

Financial Chart Slides PowerPoint Template

Product Roadmap Gantt Chart Template
A bar chart is also known as a bar graph. It is a visual tool used in representing the grouping of data into separate groups. It can be represented vertically or horizontally; it represents ordinal and nominal variables, respectively. It is a versatile visual representation tool that represents data across various industries. William Playfair invented the bar chart in the late 18th century. Bar graph templates are simple to understand, widely used, and display changes over time. A bar graph, on the other hand, can only be used with discrete data.
The Bar Graph templates represent various statistical discrete data across industries. These templates are used by academic institutions, financial organizations, health institutions, marketers, and the science and technology industries. Also, it helps to compare discrete data. For example, you can use the Finance Growth Metaphor PowerPoint Template to visually represent your organization’s financial reports. You will be privileged to compare the past and present reports to know the progress status of the organization.
These creative PowerPoint Bar chart templates are also used in health institutes to inform the audience about medical statistics and epidemiological information. The rate of bacteria and viral infections are represented using this template and can be equally compared. We at SlideModel got 100% downloadable and editable bar chart templates that can illustrate your data and information nicely. Please browse through our array of innovative PowerPoint Bar Chart slide designs to visually communicate your data. These templates are professionally designed considering colors, icons, and other elements that make them visually distinctive and appealing to your respective audience. For more information check our article about how to make a presentation graph and data presentations.
How Do I Apply A Chart Template In Powerpoint?
To apply a Chart Template in PowerPoint, follow the steps outlined below:
- To open the Insert Chart window, click a Chart button on the Insert tab of the ribbon.
- On the left sidebar, select the Templates tab.
- A gallery of your Chart Templates will appear. Choose which one you want to use to make the chart, and then click on the OK icon.
When you insert a chart template into PowerPoint, the formatting options change and adjust to the inserted template.
How Do You Use A Chart Template?
To use a chart template in PowerPoint, follow these steps: Insert the icon; select Illustrations; and then chart. Then, in the top left, click the Templates folder. Choose your chart template from the gallery and press the OK icon.
How Do I Copy A Chart Style In Powerpoint?
Here are the steps for quickly copying the chart format and pasting it into the new chart:
- Copy the formatting of the chart by right-clicking on it and selecting copy.
- Go to Home; Clipboard; Paste; Special Paste. It will bring up the Paste Special dialog box.
- Select Formats in the paste special dialogue box and click OK.
It would copy the formatting from one chart to the other instantly. Alternatively, you can use the following keyboard command, which is faster:
- Using the following keyword commands: Choose the formatting you want to copy and then press Control + C and Control + P to paste it on the new chart.
How Do I Apply A Chart Template To An Existing Chart?
For you to apply a chart template to an existing chart, you need to follow the following procedures carefully:
- Right-click an existing chart and select Change Chart Type to add a template.
- From the window that appears, select the Templates folder.
- Then choose a template and click OK. It will then be evident on the chart.


