Gantt Chart PPT Templates & Slides for PowerPoint & Google Slides
Download pre-designed Gantt Chart templates for Microsoft PowerPoint. You can use Gantt Chart PPT templates to prepare presentations on project planning and project management. Get ready-made Gantt chart PowerPoint templates that are easy to edit in Microsoft PowerPoint.
Featured Templates
Data Driven Gantt Chart PowerPoint Templates
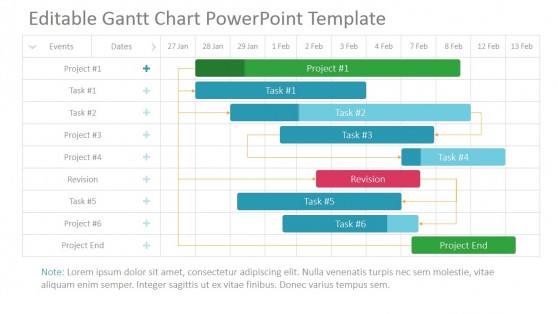
Project Gantt Chart PowerPoint Template
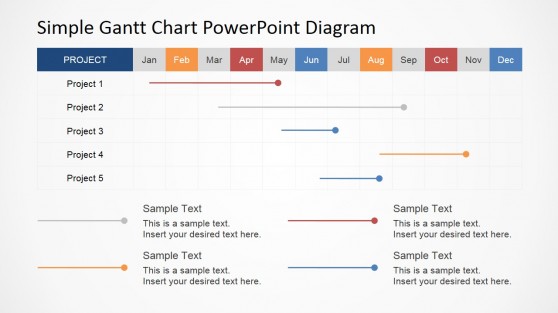
Simple Gantt Chart PowerPoint Diagram
Simple Gantt Chart PowerPoint Template
Latest Templates
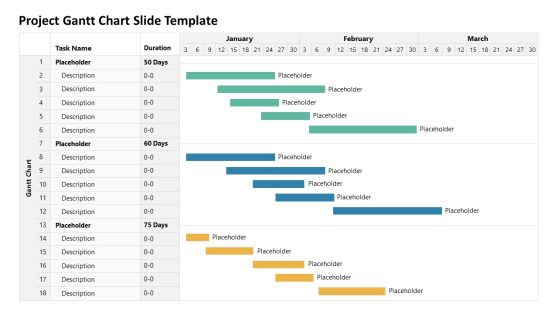
Project Gantt Chart Slide Template
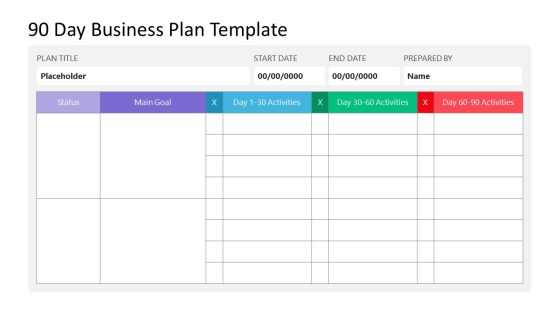
90-Day Business Plan PowerPoint Template
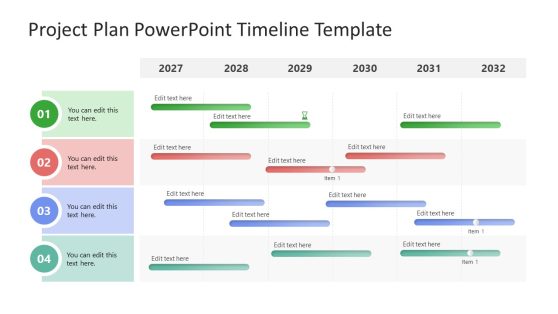
Project Plan PowerPoint Timeline Template
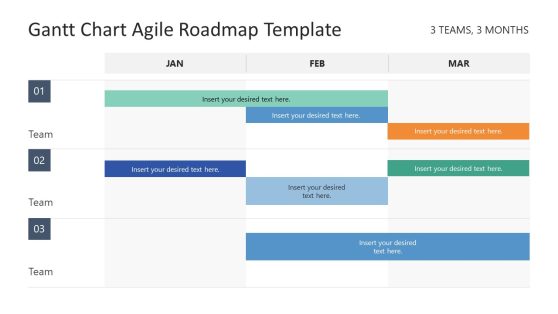
Gantt Chart Agile Roadmap PowerPoint Template
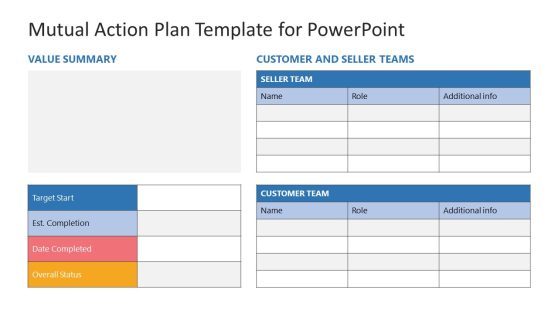
Mutual Action Plan PowerPoint Template
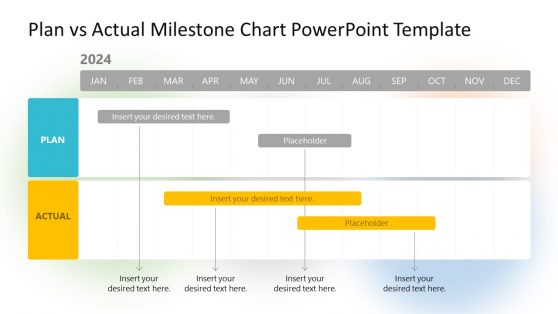
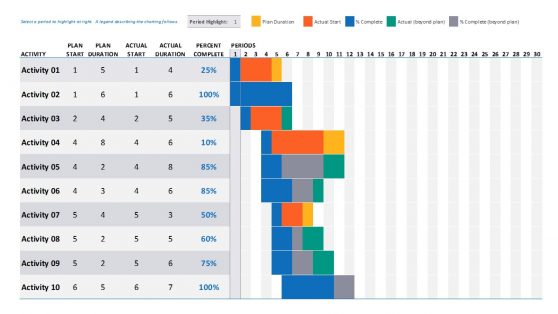
Plan vs Actual Milestone Chart PowerPoint Template
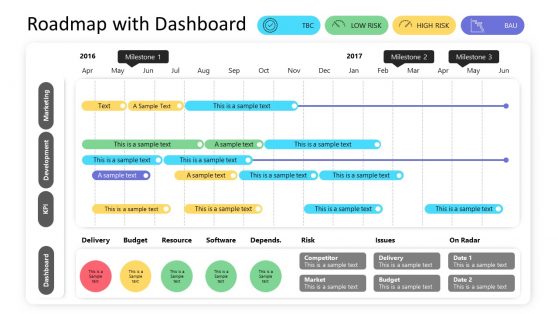
RAG Dashboard Roadmap Template
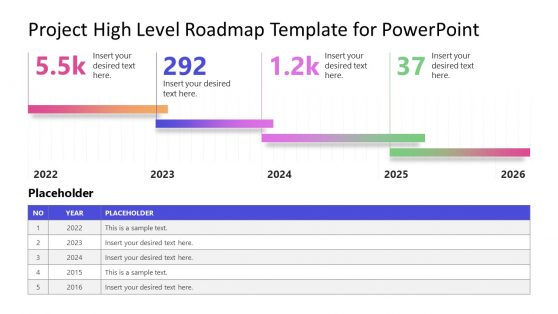
Project High Level Roadmap Template for PowerPoint
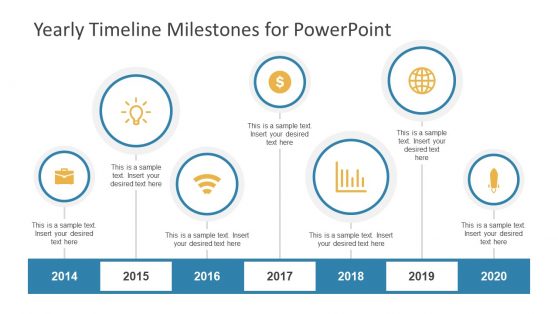
Yearly Timeline Milestones for PowerPoint
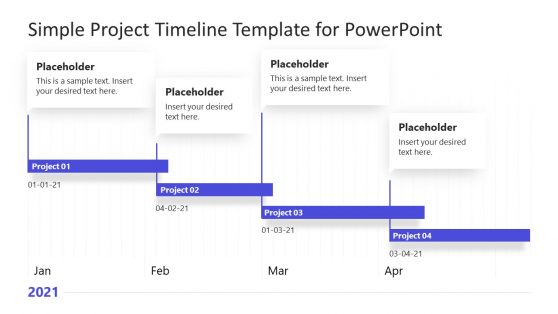
Simple Project Timeline Template for PowerPoint
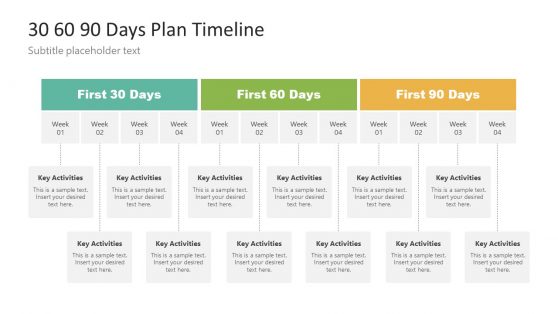
30 60 90 Days Plan Timeline Template
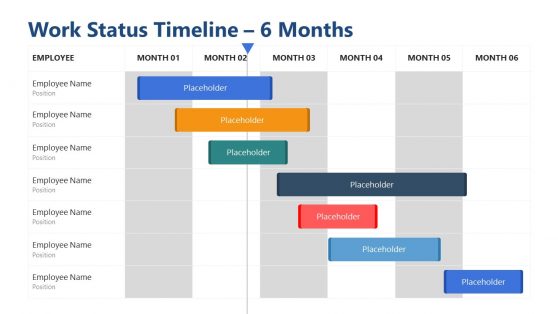
Work Status Timeline PowerPoint Template
In the early 20th century, Henry Gantt (1861 – 1919) designed a chart quite similar to the bar chart (horizontal bar chart), which is used to depict a project schedule and planning. The chart is a timeline that illustrates the task and progress so far. It was named after Henry Gantt as the Gantt chart. And as of today, it has turned into an essential tool for project managers and workers. It helps them to keep track of their projects at a glance revealing the amount of work done or production completed in specific periods about the amount planned for those periods.
It helps project managers plan, forecast, and schedule projects by illustrating them through timelines. A Gantt chart is a type of chart that shows how tasks being performed by a group of people fit into time to illustrate progress. Often, it will also show the dependence of those tasks.
At SlideModel, we have some visually appealing ready-made templates that you can use for different projects across industries. These templates are designed by professionals who are selective in their choice of color, shape, icons, and other elements. Browse through to check some of our visually attractive templates that make your project planning and scheduling easier, faster, and better. Download the Gantt Chart presentation templates, customize them with your milestones and styles and finish your presentations without hassle.
What Is A Gantt Chart Used For?
A Gantt chart is a versatile and productive project management tool that depicts every task a given project requires horizontally, along with the time needed for each job. The timeline view allows project managers and workers to see how long each task is expected to take and the total time allotted for the project. It also shows the sequence of specific tasks and the teams and individuals in charge of each task.
What Are The Advantages Of Using Gantt Charts?
Gantt charts are one of the world’s best and most widely used project management tools. It provides project transparency to team members, supervisors, and stakeholders. Because it shows tasks and the amount of time allotted to each task at a glance.
Project managers can use a Gantt chart to track the progress of a project. It includes knowing whether a project is progressing as planned and where each task should be at any given point during the project cycle. Check the Plan vs. Actual Milestone Chart PowerPoint Template; it compares the expectations and accomplishments of milestones of projects.
One of its drawbacks is the time it takes to create and update a Gantt chart. However, with our ready-made downloadable and 100% editable templates, you can easily manage your projects.
When Should You Use a Gantt Chart?
Suppose you use a Gantt chart when your team is embarking on a project requiring multiple people to complete tasks. It can use the chart to show an overview of your project. Also, use the Gantt chart when you need a tool to reveal the project timeline, roadmap presentation and calendar to every participant.
How to Make a Gantt Chart Using PowerPoint
The Gantt chart can be designed using either the PowerPoint table function or the chart function. Follow the step-by-step instructions below to create a Gantt chart in Microsoft PowerPoint using the chart function (these steps work with all versions of PowerPoint).
- Open a new PowerPoint presentation and remove the title and subtitle text area by clicking on blank on the home tab.
- Click the chart from the Insert menu. Then click the column category and select the stacked bar as the graph type.
- Add project schedule information into a PowerPoint Chart via Microsoft Excel. Add all necessary data and formulas.
- By clicking on the blue bar to highlight the entire series, you can convert the stacked Bar Chart to a Gantt Chart. A menu will appear. Then, select the paint bucket icon to fill the stacked bar with your preferred color.
The procedures are more complex than stated above. For efficient and productive project planning and scheduling, download our ready-made and 100% editable templates.