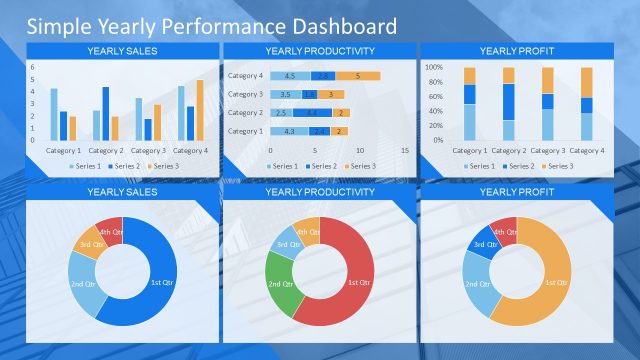
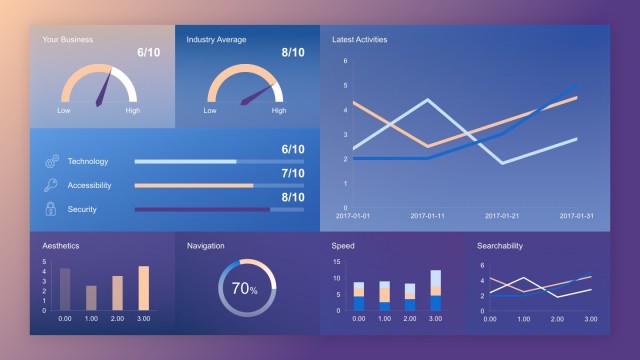
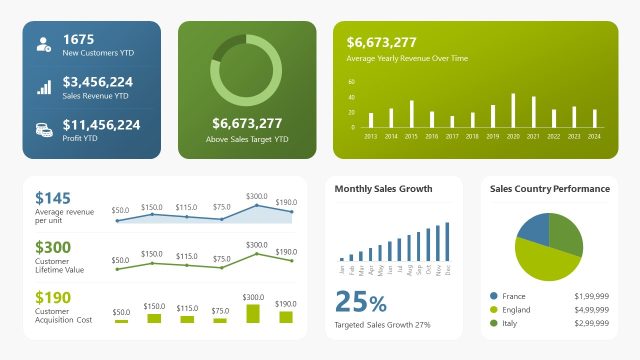
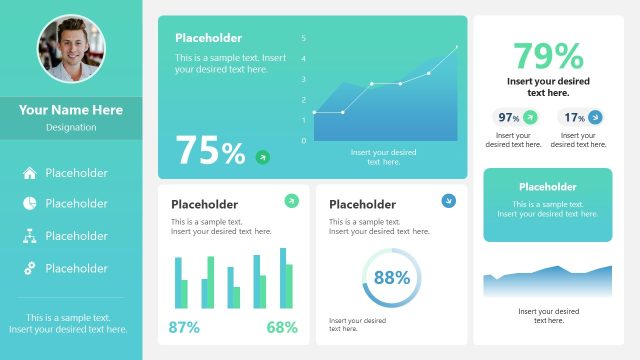
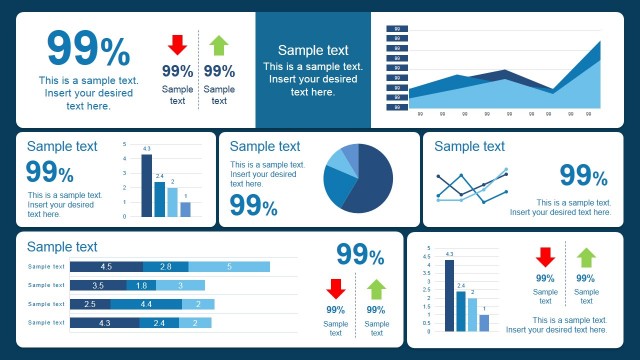
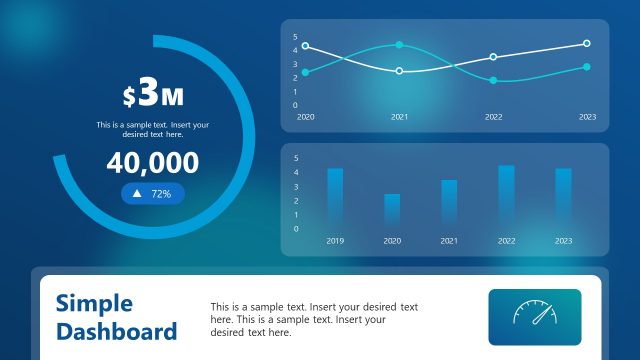
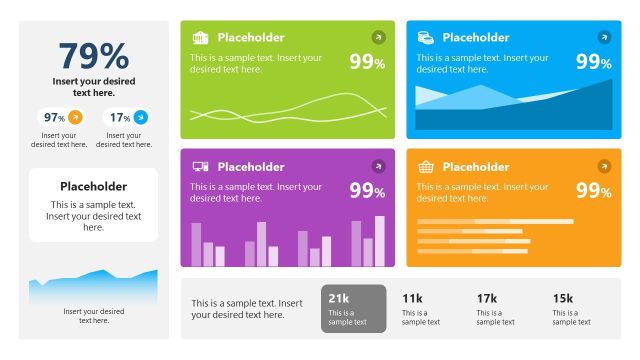
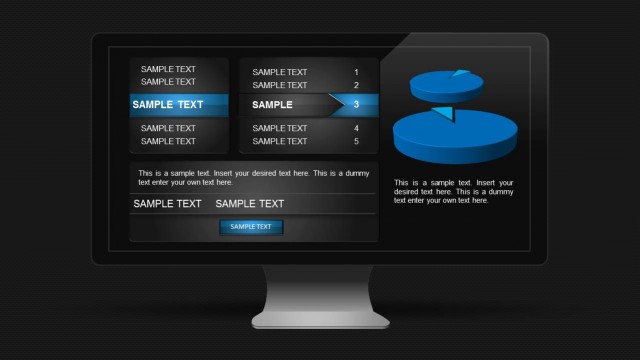
This Performance Dashboard PowerPoint Template is an awesome design created in PowerPoint that you can edit to make a single slide and widescreen business performance dashboard using PowerPoint.
Performance dashboards can help to measure, monitoring and managing your business. This design can help to make awesome performance dashboards in PowerPoint with editable components.
Inside this PowerPoint file you can find:
- A custom layout for dashboard in PowerPoint
- Editable text boxes to enter your own data and information
- A performance level meter with adjustable needle
- Editable SmartArt objects
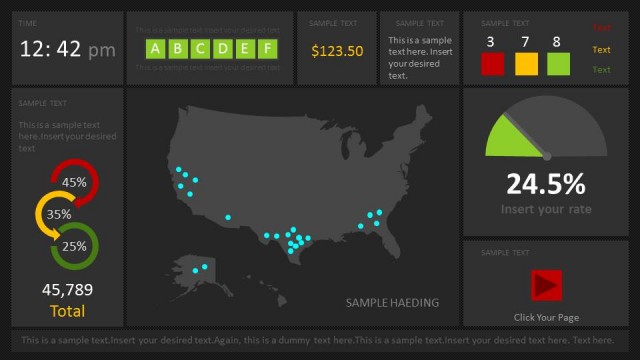
The first row of components include space to add the current date and time, then you can add amount value like the financial forecast for next year, plus more text boxes to add text.
The second row of components include a map with pinpoints so you can highlight desired locations in a worldmap illustration. Then you can edit the performance level meter with any desired value by adjusting the needle and edit the total row. There is a narrow component created with SmartArt objects where you can enter percentage values.
The sample performance dashboard includes dummy data but you can easily edit it to match your corporate needs. Alternatively there are other templates you can use including the scorecard templates for PowerPoint.
What’s inside this template
Example presentation scenarios
- An operations manager can use the KPI tiles and gauge meter to brief executives on current performance against a target during a weekly review.
- A sales leader can use the world map with pins to discuss regional activity while keeping total revenue or forecast values visible in the dashboard panels.
- A business analyst can use the stacked percentage circles and total metric block to compare share, mix, or allocation figures in a concise status update.
- A project manager can use the arrow action panel and footer note to connect the dashboard metrics with a next step or follow-up page in a management deck.
Features
- 100% editable presentation template
- Compatible with Microsoft PowerPoint and Google Slides
- Scalable vector shapes, icons and illustrations
- AI-Ready for Microsoft Copilot and Claude
- Instant access and download
Frequently asked questions
Q: How should the presenter explain this dashboard without overwhelming the audience?
A: Start with the main performance message, then move across the slide by priority: headline metric tiles, map activity, percentage mix, gauge status, and the action panel. Avoid reading every label. Use the dashboard as a briefing screen where each visual block supports one decision or management takeaway.
Q: Who is this template best suited for in a business presentation?
A: This template fits managers, analysts, and sales or operations leaders who need to report a snapshot of performance in a meeting. The KPI tiles, total metric, world map, and gauge meter are most useful when the audience needs a quick read on status, geographic activity, and target progress.
Q: Why does the dashboard combine a map, gauge, percentage circles, and KPI cards on one slide?
A: The mixed visual metaphors separate different kinds of information. KPI cards show exact summary values, the map provides geographic context, percentage circles suggest composition, and the gauge communicates status against a target. This reduces the need for long explanation and helps decision makers scan the slide quickly.


Performance Dashboard PowerPoint Template
1-slide performance dashboard presentation template with KPI tiles, world map, and gauge meter
This one-slide PowerPoint template presents a business performance dashboard for executives and analysts. The layout combines KPI tiles, a world map with location pins, a percentage gauge meter, stacked percentage circles, a total metric block, and footer notes. It is built for status reporting and performance visualization in a single slide.


 Loading...
 Microsoft PowerPoint
 Microsoft Copilot
 Claude for PowerPoint
Other formats supported
Subscribe today and get immediate
access to download our PowerPoint templates.