Circle Diagram Templates for PowerPoint & Google Slides
Download circle diagrams for PowerPoint presentations with creative styles and effects. These 100% editable circular infographics & slide templates are compatible with Microsoft PowerPoint & Google Slides. The slide designs come with different circular diagram designs, including multi-step circular flow diagrams, 3D diagrams, multi-layer diagrams, and more.
Using these circular diagram templates, you can easily create professional-looking slides and diagrams presenting concepts, step-by-step guides or ideas. The available designs include business-specific models and generic circular diagram designs that can be used for a variety of presentation topics.
Featured Templates
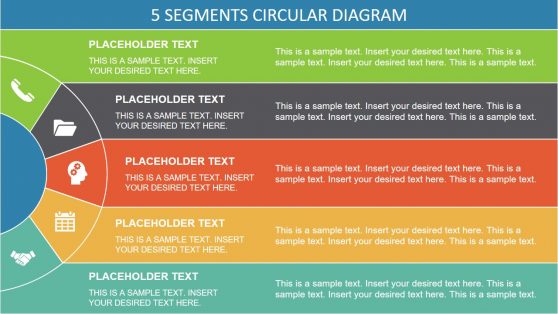
5 Stages Semi Circle PowerPoint Diagram
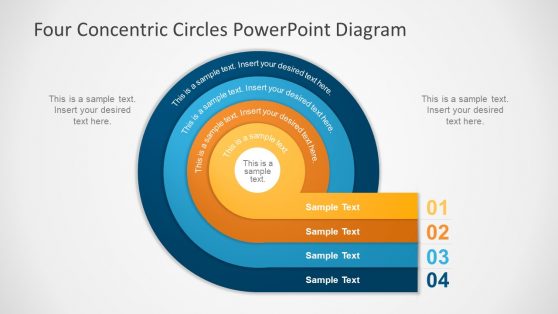
Four Concentric Circles PowerPoint Diagram
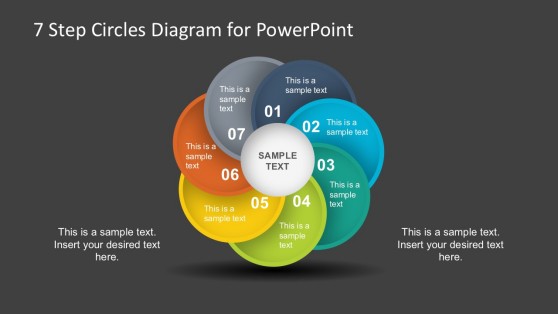
7 Steps Circles PowerPoint Diagram
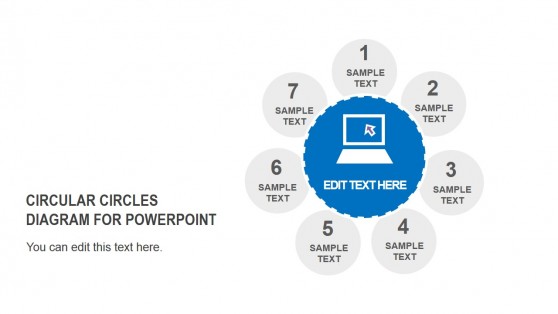
Circular Circles PowerPoint Diagrams
Latest Templates


Animated Circular Timeline PowerPoint Template

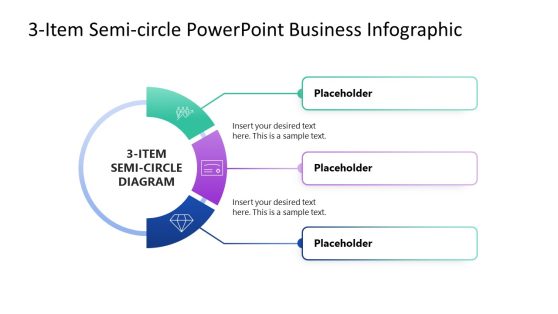
3-Item Semi-circle PowerPoint Template Infographic
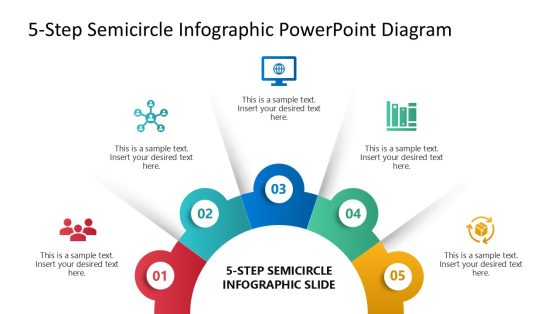
5-Step Semicircle Infographic PowerPoint Diagram
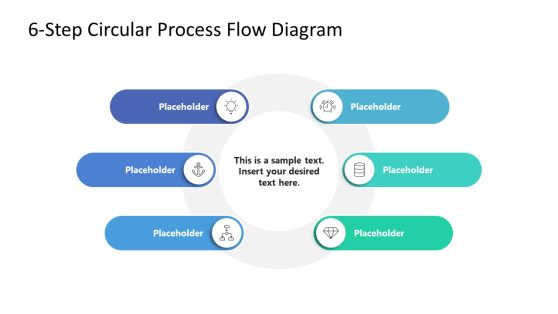
6-Step Circular Process Flow PowerPoint Template
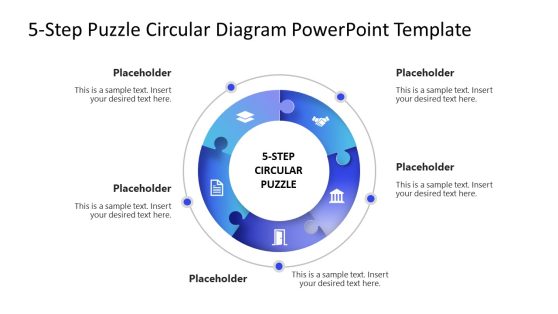
5-Step Circular Puzzle Diagram PowerPoint Template
Our 100% editable circular template slides can help to prepare presentations to demonstrate business processes, models and explain topics or ideas with a circle diagram design. You can also the circular process flow diagrams to present a process in a circular loop.
This collection of circle diagrams include a variety of business diagrams with circular shapes, like flow chart circle templates, circular processes and other circular slides that are 100% editable in PowerPoint and Google Slides.
In this collection, you can find not only perfect circular infographics for presentations, but also layouts with semi-circle diagrams (half circles), or other creative layouts with circular shapes.
For more information check our article about how to make a presentation graph.
What is a circle diagram?
Circular diagrams show data in separate divisions or categories. Mostly, they can be used to describe components of an idea, illustrate different steps for a process, or to project percentages of a total result.
It is a graphical representation of a procedure, commonly used in business presentations. A circle diagram is an effective tool to explain continuous circular processes. In economics, these diagrams are used to project the balances of financial transactions in an economy.
When do you use a circle diagram?
A round diagram, as mentioned above, is an optimal resource to project topics as parts of a whole as it serves to describe the relationships among all the components of the circle.
Businesses rely heavily on these diagrams as they are helpful to describe different departments of an organization or the steps that assemble a whole business process.
A circle diagram template can be applied to any kind of topic or industry; the variety of its applications is vast as it can be used for any kind of conceptual briefing.
What are the symbols commonly used in circle diagrams?
Different symbols and forms can be applied to represent a circle diagram chart, including combinations of circle and arrow loops, Venn circles, nodes, basic loops, rings, trapezoid rings, timeline cycles, and variable radians, among others.
What are the advantages of using a circular diagram?
If the user is looking for an efficient solution to a concise explanation for different aspects, then circular charts are the best option. These diagrams collect a selection of important aspects of an idea or steps for a procedure and lock them in a single slide.
The audience can have a perception of the bigger picture by looking at a diagram, it doesn’t matter how many steps a process needs, a well-organized cycle is the most direct method for a briefing of this nature.
Sometimes, selecting which step comes first in the line of importance may become a tedious job. Nevertheless, by organizing an idea with a circular diagram template the presenter can have an easier time selecting the hierarchy of the steps.
Another great benefit of circles is that the user can divide the pie as pleased. If a procedure requires only 3 steps, then it can fit perfectly into a diagram. Even a presentation of 12 steps shouldn’t be a problem to be projected on a wheel.
How to present a circle diagram in a PowerPoint presentation?
SlideModel offers a huge catalog of circle diagram PowerPoint templates that can fit any requirements. The variety of the templates covers multiple designs, concepts, and styles, from 7-steps circles to 3D multilevel diagrams.
The first thing to do is for the user to identify a template that fits best with the research. If the evaluation resulted in a 6-step procedure, then a PowerPoint template that covers this number of segments is the wisest selection.
The way a diagram is presented depends directly on the user’s criteria. But there are some fundamental aspects to follow to make an optimal and easy-to-understand structure.
Limiting the number of slices or segments on the circle is recommended. Too many sections can clutter the design so it is auspicious to simplify as possible for the reader to get the message properly.
In the PowerPoint template is crucial to add proper labels to the sections. If the label appears to be too doubtful or ambiguous to the audience, then it is better to select a template that has graphic legends that complement the label.
Presenters should always consider branding before selecting a circular diagram PowerPoint template. A presentation that counts on a color palette that not only fits the company’s brand but also highlights the label of each segment of the circle is a must.
Does it matter to use so many colors in Circle Diagram Presentations?
Honestly, no. Since you are aiming to highlight the points presented inside each portion of the circle, using different hues helps to contrast the points exposed.
You can work with monochromatic schemes if we talk about the same topic with no drastic difference in points of view, meaning them to be strictly related to each other and working for the same route.
Just to keep your presentation fresh and professional, avoid using multiple typefaces, only resorting to bold or italics when it’s crucial to make a difference in the wording added.