What is inevitable for any entrepreneur is risk! Without risk, there can be no reward, and at a manageable level of t risk, businesses can achieve success. On the contrary, threats that don’t result in a positive outcome can ruin a business. However, this is not a zero-sum game. Even if a risk proves to be a bad business decision, companies can recover from the negative outcome. What is essential to consider for every business or venture is risk analysis and its management. Risk analysis and risk management are critical for businesses and are also used by the government and non-profit organizations. In what follows, we will provide you with an overview of risk analysis and risk management.
What is Risk Analysis and Risk Management?
Risk can be viewed as either the probability of something going wrong or the probability of turning into reality. Risk analysis is the anticipation and management of risks that may result from an event or action, i.e., the identification of risks a business or venture might face. It is the process of analyzing possible issues that can negatively affect a business initiative or project. Similarly, risk management is the identification, assessment, and control of risks that might affect an organization’s earnings or capital.
Risk Analysis vs. Risk Management: Key Differences
The terms risk analysis and risk management are often used interchangeably, but they describe two distinct activities. Understanding the difference is essential before applying either concept to a project or organization.
Risk analysis is diagnostic; it answers the question: “What could go wrong, and how likely is it?” It involves identifying potential threats, estimating their likelihood, and assessing the impact if they materialize. Risk analysis is, in essence, the intelligence-gathering phase.
Risk management is prescriptive; it answers: “What are we going to do about it?” It is the broader discipline that frames how an organization identifies, evaluates, prioritizes, and controls risks over time. Risk analysis is one component of risk management, not a synonym for it.
| Dimension | Risk Analysis | Risk Management |
| Primary question | What could go wrong and how likely is it? | How do we respond to and control risk? |
| Scope | A specific risk event or set of scenarios | The full risk lifecycle across a project or organisation |
| Output | Risk probability and impact estimates | Risk response plan, risk register, policies |
| When it happens | Before and during a project or decision | Continuously: before, during, and after |
| Who leads it | Risk analysts, project managers | Risk owners, executives, board-level governance |
In practice, the two work together: risk analysis feeds the evidence needed for risk management decisions. A risk management framework without rigorous analysis is guesswork; risk analysis without a management framework produces reports that sit unread.
Risk Analysis
When performing a risk analysis, one must identify potential threats and then assess the likelihood that they will materialize. To assess risks, you will need to dig into detailed project plans, financial information, forecasts, etc.

When is Risk Analysis Used?
Organizations use risk analysis at various stages, such as planning, pre-assessment, and project launch.
Pre-Assessment
Before launching a new project, risk analysis is used as a pre-assessment tool to determine feasibility and decide whether to move forward or abandon it.
Project Planning
When planning a project, an organization might require assessing risks to understand and mitigate.
Improvement and Safety
Risk analysis is also used to manage potential risks in the workplace, such as improving safety procedures.
Changing Market Conditions
You might want a risk analysis when a new competitor enters the market or when market conditions change. For example, imposition of new taxes, currency devaluation, and other factors that might significantly change the market conditions may require risk analysis.
Preparing for Events
Risk analysis is used to assess and manage risks at an event. This might range from equipment malfunction or theft to a protest by a pressure group or a natural disaster occurring during the event.
Types of Business Risk
Risk does not arrive from a single direction. Organizations face threats across multiple domains simultaneously, and an effective risk analysis process must cast a wide net before prioritizing. The six categories below cover most of the risks that business and project teams encounter in practice.
Financial Risk
Financial risk encompasses any threat to an organization’s revenues, cash flow, or financial stability. Common examples include foreign-exchange volatility, interest-rate movements, credit defaults by customers or counterparties, and liquidity shortfalls. In a presentation context, financial risk is often the category that boards and investors scrutinize most closely; any risk analysis slide should quantify financial exposure in concrete terms wherever possible.
Operational Risk
Operational risk arises from failures in internal processes, systems, people, or external events that affect day-to-day operations. Supply chain disruptions, equipment failures, process errors, and workforce issues all fall under this umbrella. The COVID-19 pandemic brought operational risk into sharp focus for organizations that had not stress-tested their dependency on physical locations or single-source suppliers.
Compliance and Regulatory Risk
Compliance risk refers to the potential for financial penalties, legal sanctions, or reputational damage resulting from failure to comply with laws, regulations, or internal policies. As regulatory environments grow more complex, from GDPR in data privacy to ESG reporting obligations, compliance risk has become a standing agenda item in most boardrooms.
Cyber and Technology Risk
Cyber risk covers the full spectrum of threats to an organization’s data, systems, and digital infrastructure: ransomware attacks, data breaches, software vulnerabilities, and technology dependency failures. It is one of the fastest-growing categories of business risk and, according to the Allianz Risk Barometer, consistently ranks among senior executives’ top concerns globally.
Reputational Risk
Reputational risk is the potential for damage to an organization’s standing in the eyes of customers, employees, investors, regulators, or the public. It is often a downstream consequence of other risks materializing; a data breach creates cyber risk first and reputational risk second, but it can also arise independently through social media incidents, product failures, or leadership controversies. Reputational risk is difficult to quantify, but it can be the most expensive risk to recover from.
Strategic Risk
Strategic risk refers to threats to an organization’s ability to achieve its long-term goals. These risks typically originate from external forces, such as competitive disruption, shifts in market demand, technological obsolescence, or geopolitical change, rather than internal failures. SWOT analysis and scenario planning are the primary tools for surfacing and assessing strategic risk.
Qualitative vs. Quantitative Risk Analysis
When conducting risk analysis, practitioners typically choose between two methodological approaches or combine both. Qualitative risk analysis relies on expert judgment and descriptive scales; quantitative risk analysis uses numerical data and statistical modeling. Each has a distinct role, and the choice depends on the data available, the stakes involved, and the time and resources at hand.
What Is Qualitative Risk Analysis?
Qualitative risk analysis evaluates risks using subjective yet structured criteria. Analysts rate each risk across two dimensions, likelihood and impact, using predefined scales such as High, Medium, or Low (or numerical proxies like 1-5). The combination of these two ratings yields a risk score, typically plotted on a risk matrix to determine priority.
Because it does not require large datasets or complex modeling, qualitative analysis is faster, more cost-effective, and accessible to teams without specialist statistical expertise. It is the most widely used approach in project and operational risk management and the foundation for tools such as the risk matrix and heat map.
Best used when: data is scarce, time is limited, risks are relatively well understood, or a quick initial triage of a large number of risks is needed.
What Is Quantitative Risk Analysis?
Quantitative risk analysis assigns numerical values to both the probability of a risk occurring and the magnitude of its consequences; typically in financial terms. Techniques include Monte Carlo simulation, Expected Monetary Value (EMV) analysis, sensitivity analysis, and fault tree analysis. The outputs are expressed as probability distributions or specific monetary estimates, providing a precise picture of potential exposure.
This approach is more data-intensive and time-consuming, but it produces outputs that directly inform financial planning, capital allocation, and insurance decisions. It is standard in sectors such as finance, infrastructure, oil and gas, and pharmaceutical development.
Best used when: historical data is available, risks have significant financial implications, or decisions require a defensible numerical basis (such as investment cases or regulatory submissions).
| Feature | Qualitative | Quantitative |
| Data requirement | Low: expert judgment sufficient | High: historical data and modeling required |
| Output | Risk ratings (High/Med/Low) and ranked priority list | Low: expert judgment sufficient |
| Speed | Fast: suitable for initial triage | Slow: requires specialist analysis time |
| Accuracy | Indicative: subject to assessor bias | Precise, but only as good as the input data |
| Common tools | Risk matrix, heat map, risk register ratings | Monte Carlo simulation, fault tree analysis, EMV |
| Typical users | Project managers, operational teams | Risk analysts, actuaries, financial planners |
| Ideal context | Risk analysts, actuaries, and financial planners | High-stakes financial, infrastructure, or R&D decisions |
In practice, most organizations use a hybrid approach: qualitative analysis to triage and prioritize a broad list of risks, followed by quantitative analysis for the small number of risks that are both high-priority and material enough to warrant deeper modeling.
How to Use Risk Analysis
Risk analysis requires identifying and estimating risks to inform decision-making to protect the organization from possible financial, reputational, procedural, technical, structural, natural, and political risks.
Identifying Threats
To analyze risks, you must first identify the different types of risks to plan for them or to understand their likelihood of occurring. When analyzing risks, you can consider various sources that might pose a threat, such as:
- Loss of an employee due to death, injury, or other factors.
- Loss of supplies, failure to distribute, or loss of access to essential assets leading to an operational crisis.
- Damage to customer, employee, or market reputation, resulting in reputational loss.
- Failures in executing a procedure, lack of control or accountability, fraud, or negligence arising from procedural issues.
- Project-related issues such as delays, budgetary constraints, cost overruns, and lack of quality in service delivery.
- Financial risks, such as market fluctuations, interest rate changes, currency devaluation leading to higher input costs, and funding constraints.
- Technical failure or a technology change can pose a risk. New technology often renders many types of businesses obsolete.
- A natural disaster, random weather changes, or disease can pose various risks.
- Political uncertainty, changes in political regimes or structures, taxes, wars, and other risks can be linked to multiple threats stemming from political shifts.
- Structural issues that could harm equipment, people, or assets may require mitigation. This might include issues related to waste management, workplace safety, equipment operation that may malfunction or pose a hazard, and the like.
Threats can be identified using various methods such as a Failure Mode and Effects, SWOT or SOAR Analysis.
Estimating Risks
Once threats have been identified, it´s important to calculate the possibility of those risks materializing and their potential impact. Estimating risks can be performed by using a simple calculation to assess the risk value:
Risk = Probability x Cost
Example: There is a 50% chance that the government will impose a new tax on an imported item that your business uses as an input for producing product X. This will result in a cost of $600,000 over a year.
0.50 (probability of tax being imposed) x $600,000 (cost of the price increase) = $300,000 (Value of Risk

Risk Management
After you have identified risks and assessed their likelihood, you need to manage them. You will have to avoid either sharing or accepting the dangers that lie ahead. Furthermore, you will need to plan to control risks.
The Risk Management Lifecycle
Risk management is not a one-time exercise; it is a continuous cycle. Most frameworks, including ISO 31000, describe risk management as a recurring process that loops back on itself as conditions change, new risks emerge, and previous responses are evaluated. The six-step lifecycle below reflects that cyclical nature.
- Identify: Systematically catalog every potential risk that could affect the project, initiative, or organization. Sources include historical data, stakeholder interviews, industry reports, and expert judgment. The output is a raw list of identified risks, which feeds directly into the risk register.
- Analyze: For each identified risk, estimate its likelihood of occurring and the severity of its impact if it does. Analysis can be qualitative (High/Medium/Low ratings), quantitative (numerical probabilities and monetary values), or a combination of both.
- Evaluate: Compare each risk against the organization’s risk appetite and risk tolerance thresholds. Risks that fall within acceptable boundaries may be monitored passively. Risks that exceed those thresholds require an active response.
- Treat: Select and implement a response strategy for each priority risk: avoid, reduce, transfer, or accept. The treatment chosen depends on the nature of the risk, the cost of action, and the organization’s risk appetite.
- Monitor: Track identified risks over time and watch for new ones. Monitor the effectiveness of treatment actions and check whether residual risk levels remain within acceptable limits. This step requires defined KPIs and clear risk ownership.
- Review: Periodically reassess the entire risk landscape, not just individual risks. Organizational priorities shift, market conditions change, and regulatory requirements evolve. A structured review ensures the risk management framework itself remains fit for purpose.
Risk Appetite vs. Risk Tolerance
Risk appetite is the amount and type of risk an organization is willing to accept in pursuit of its strategic objectives. It is a deliberate, board-level policy statement that reflects the organization’s values, culture, and growth ambitions. A start-up pursuing aggressive market expansion will have a high risk appetite; a publicly regulated utility will have a low one.
Risk tolerance is the acceptable variation around that appetite: the operational boundaries within which the organization is willing to fluctuate before intervention is required. If risk appetite is the destination on the map, risk tolerance is the acceptable corridor either side of the planned route.
Example: A bank sets its risk appetite as: ‘We accept credit risk in retail lending up to a portfolio loss rate of 2%.’ The risk tolerance is defined as: ‘We will escalate to the Risk Committee if the loss rate exceeds 1.8% in any rolling quarter.’ Appetite is the limit; tolerance is the early-warning threshold.
The distinction matters because it drives two different types of management action. Breaching the risk tolerance triggers monitoring and review. Breaching the risk appetite triggers executive-level intervention and a mandatory change in strategy or controls.
Both concepts are defined at the organizational level and then cascaded down to individual business units, projects, and functions. A well-governed organization will have explicit risk appetite statements for each major risk category, financial, operational, reputational, and so on, rather than a single blanket statement.
The Four Risk Response Strategies
Once risks have been identified, analyzed, and evaluated, the next step is to decide what to do about them. All risk response options fall into one of four categories, sometimes called the ‘4 Ts’ or ‘4 As’ depending on the framework used. Each strategy is appropriate under different conditions, and the choice is driven by the risk’s residual score relative to the organization’s risk appetite.
| Strategy | Also Called | When to Use |
| Avoid | Terminate | The risk exceeds appetite and cannot be adequately controlled. The activity creating the risk should be stopped or redesigned. |
| Reduce/Treat | Mitigate or Control | The risk can be brought within appetite by implementing controls to lower the likelihood, impact, or both. |
| Transfer | Share | The financial impact of the risk can be shifted to a third party, typically through insurance, contracts, or outsourcing. |
| Accept | Tolerate | The risk falls within appetite, and the cost of further control outweighs the benefit. The organization consciously carries the risk. |
In most organizations, a blend of all four strategies is active simultaneously: some risks are being avoided, others reduced, others transferred, and others simply monitored. The key governance requirement is that every risk above the tolerance threshold has a named owner and a documented response strategy with a target residual score.
Avoiding Risks
While there can be no reward without risks, you might want to avoid some risks altogether. An excellent example of this is to prevent a business venture for which a risk assessment has shown less promise than previously anticipated.
Example: Company X, a high-end car manufacturer, wants to enter a new market by investing in car assembly in Country A. However, after assessing the local market, the carmaker determines that the people of country A have low purchasing power. The demand for high-end vehicles is saturated and limited to a small portion of the population. Furthermore, the government has imposed new taxes on the car industry, and Country A’s currency has depreciated by 50% in a single year, leading to higher input costs. The additional assessment shows that the condition is likely to deteriorate in the wake of a devaluing currency and other taxes expected to be imposed in the next fiscal year. In such a case, it might not be feasible for Company X to invest in Country A.
Sharing Risks
You can share risks to reduce their impact and improve your chances of potential gains.
Example: Company X wants to enter the car market in Country A to sell high-end cars by assembling them locally, but the market conditions don’t seem very conducive. However, Company Y is already selling cars in Country A and manufactures them using 70% local inputs rather than assembling them. Company Y is looking for an investor to expand the business. Instead of manufacturing cars locally, Company X can invest in Company Y and produce high-end cars through a joint venture. In this case, Company X can share the risk with Company Y.
Accepting Risks
Accepting risk is sometimes the only option. This might be when the risk cannot be mitigated, when the threat can lead to a potential gain that justifies the risk, or when the cost of insurance is less than the cost of the loss. Organizations might conduct various types of analysis, such as risk analysis, impact analysis, and make a contingency plan before accepting the risk.
Example: Company X might invest in Country A despite uncertainties in exchange rates and taxation, and a decline in consumer interest, if it can ensure low-cost production and offer its high-end cars at a lower price than the competition. Company X might do this by buying inputs locally, getting tax concessions from the government, attracting local investment, etc. Sometimes governments might introduce measures to attract investment for new companies by offering tax concessions, reducing duties on imported inputs, subsidizing industries, and offering low energy rates to lower production costs. Such a measure might reduce the risk for Company X and encourage investment. On the contrary, if Company X had already invested in Country A before the market became volatile, it might have to accept the risk. In such a case, Company X might want to stay in the market a bit longer to manage the risk.
Controlling Risks
Various preventive methods can be used to control risks. You can also detect processes and possible issues that might occur in the future.
Example: Company X invests in Country A and sets up plants to manufacture high-end cars. However, the government of Country A increases taxes and import duties on inputs, and the country’s currency devalues by 50%. However, Company X had already taken preventive measures by relying on only 10% of imported inputs and lobbied car manufacturers to reverse the new taxes. Since Company X had already analyzed such tax reversals in the past due to significant industry pressure, the industry fuels thousands of jobs.

You can learn more insights about this discipline in our article on Risk Management Techniques.
How to Create a Presentation for Risk Analysis and Risk Management
Running people through only a few insights in a PowerPoint presentation of your risk analysis or risk management plan is not the best approach. Your audience needs to understand how those risks can affect expected results and how to make decisions based on the findings. Also, keep in mind that your presentation may be for those who approve a project, those who are planning it, or even a team responsible for preventing satellite events that might affect it in the long run.
Make sure your professional presentation template clearly highlights and simplifies the information that was so carefully extracted. Take into account that all data included in your presentation will be actionable. Use a diagram like the one below to frame the upcoming risk management process that can follow the in-depth analysis.
1. Enterprise Risk Management PowerPoint Template
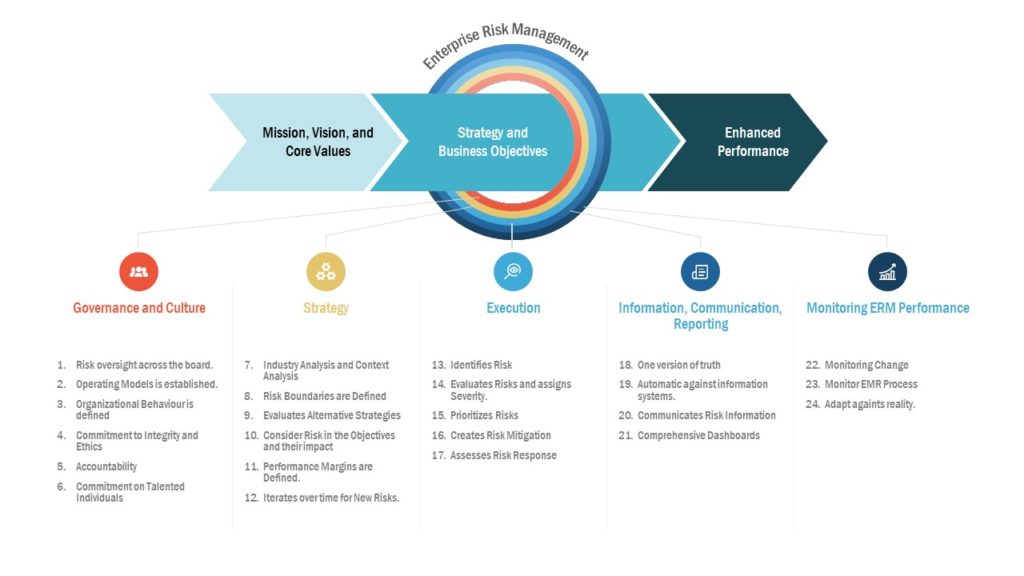
Creating an effective Risk Analysis requires eventually present the information and findings to stakeholders for appropriate Risk Management. The Risk Management PowerPoint template allows visually appealing documentation so that not only a plan can be properly implemented but also presented accordingly.
Cognitive Biases That Distort Risk Assessment
Risk analysis is only as objective as the people conducting it. Even experienced professionals are subject to cognitive biases: systematic patterns of thinking that skew probability and impact estimates in predictable ways. Awareness of these biases is the first step toward counteracting them and producing more accurate risk assessments.
Optimism Bias
Optimism bias is the tendency to underestimate the likelihood of negative outcomes and overestimate the likelihood of positive ones. In risk analysis, this manifests as consistently rating risks as less likely than historical data would support. Research by Daniel Kahneman and Amos Tversky, foundational to behavioral economics, demonstrated that optimism bias is near-universal among planners and project managers. The result is chronically underestimated risk registers, budgets that overrun, and timelines that slip.
Mitigation: Use reference class forecasting by comparing the current project’s risk profile to a statistically valid sample of similar past projects, rather than relying solely on the current team’s intuition.
Availability Heuristic
The availability heuristic causes people to overweight risks that are recent, vivid, or emotionally memorable, and underweight risks that are abstract, distant, or unfamiliar. After a high-profile data breach in the news, a team is likely to overrate cyber risk; after a quiet period with no incidents, they are likely to underrate it, regardless of the underlying data.
Mitigation: Ground risk ratings in data rather than narrative. Maintain a historical incident log to counterbalance recency effects, and use structured risk workshops with diverse stakeholders to surface risks that any single team might overlook.
Anchoring Bias
Anchoring occurs when an initial risk estimate, whether from a previous assessment, a market report, or the first voice in the room, exerts disproportionate influence on the final rating, regardless of subsequent information. In risk workshops, the first person to name a probability will anchor the group’s thinking, often overriding more considered analysis.
Mitigation: Use pre-workshop individual ratings to establish independent baselines before group discussion. Then compare and debate the differences, rather than converging on the first estimate raised in the room.
How to Communicate Risk to Stakeholders
Identifying and managing risk internally is only half the task. For risk management to function effectively, risk information must be communicated clearly to the stakeholders who need it: boards, investors, project sponsors, regulators, and operational teams; each of whom has different needs, different levels of risk literacy, and different expectations of what ‘a risk update’ means.
Why Risk Communication So Often Fails
The most common failure mode in risk communication is the same one that affects all business communication: misalignment between what the communicator knows and what the audience needs. Risk managers who present raw risk register data to board audiences overwhelm them with detail. Project managers who summarise risks as ‘all under control’ leave sponsors with false confidence. Both failures are costly.
Effective risk communication requires translating technical risk analysis into the language and decision-making frame of each audience, not dumbing down, but reframing.
What Risk Communication Should Cover
- The risk landscape summary: Which risks are currently above the tolerance threshold, which are improving, and which are deteriorating.
- Material changes since the last update: New risks that have emerged, risks that have closed, and risks where the residual score has moved significantly.
- Decisions required: Explicitly flag any risks that require a governance decision, such as escalation, additional resources, or a change in strategy.
- Confidence levels: Be transparent about the quality of the underlying data. An estimate based on five data points is less reliable than one based on five hundred.
- Ownership: Every risk communicated to a senior audience should have a named owner who can be held accountable.
For guidance on how to structure and design the actual slides that present risk information, including prioritization, visual hierarchy, and plain-language framing, see our article: How to Create an Effective Risk and Mitigation Slide.
FAQs
What is the main difference between risk analysis and risk management?
Risk analysis is the process of identifying potential risks and assessing their likelihood and impact; it is diagnostic. Risk management is the broader discipline that defines how an organization responds to and controls risks throughout its lifecycle; it is prescriptive. Risk analysis is an input to risk management, not a substitute for it.
What does qualitative risk analysis mean?
Qualitative risk analysis evaluates risks using subjective but structured criteria, rating each risk’s likelihood and impact on a descriptive scale: typically High, Medium, or Low. It does not assign numerical probabilities or financial values. Qualitative analysis is faster and more accessible than quantitative analysis and is the most widely used approach in project and operational risk management.
What is a risk register?
A risk register is a central document or database in which all identified risks are recorded, described, rated, assigned to a named owner, and tracked over time. A standard risk register includes fields for risk description, category, inherent and residual risk scores, current controls, response strategy, action plan, and review date. It is the operational backbone of any risk management program.
What are the four risk response strategies?
The four standard risk response strategies are: Avoid (eliminate the activity or condition that creates the risk), Reduce or Treat (implement controls to lower the likelihood or impact of the risk), Transfer (shift the financial consequences to a third party, typically through insurance or contractual arrangements), and Accept (consciously carry the risk within defined tolerance limits, usually because the cost of further control outweighs the benefit). Most organizations apply all four strategies simultaneously across their risk portfolio.
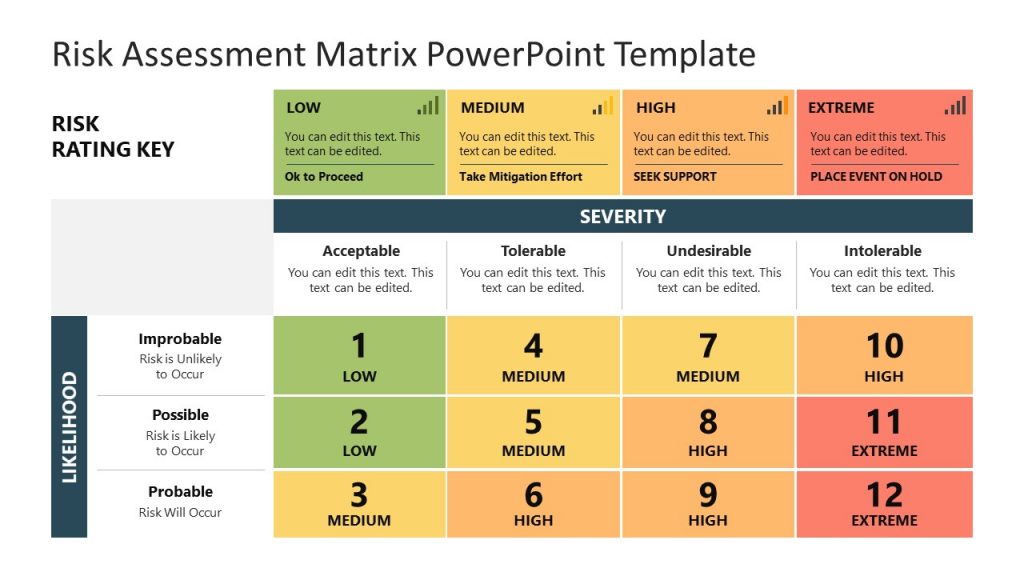
What is a risk matrix and how is it used?
A risk matrix is a two-dimensional grid used to visually assess and prioritize risks by plotting each risk on its likelihood (horizontal axis) and potential impact (vertical axis). The resulting matrix divides risks into zones, typically red (high priority), amber (medium), and green (low), making it easy for teams and stakeholders to see at a glance which risks demand immediate attention. Risk matrices are most useful during qualitative risk analysis, where numerical data is limited, and they work best when the rating scales are defined clearly before the assessment begins, rather than left to individual interpretation.
What is the difference between risk management and crisis management?
Risk management is proactive; it focuses on identifying, assessing, and controlling risks before they materialize into harmful events. Crisis management is reactive; it is the set of actions taken after a significant adverse event occurs and normal operations are disrupted. The two are related but distinct: effective risk management reduces the likelihood and severity of crises; effective crisis management limits the damage when risk management has not prevented an event.
Organizations that invest in robust risk management programs typically find their crisis management responses faster and less costly, because contingency plans have been developed in advance.
How do you prioritize risks effectively?
Effective risk prioritization combines two factors: the likelihood of a risk occurring and the severity of its impact if it does. The most common method is to assign scores to each factor, using either a qualitative scale (High/Medium/Low) or a numerical scale (1-5), and multiply them to produce a risk priority score. Risks are then ranked by score, with the highest-priority risks receiving the most attention and resources.
Prioritization should also account for the organization’s risk appetite: a risk with a medium priority score that falls outside the defined risk appetite requires action, regardless of its ranking. Risk owners should be assigned before prioritization decisions are finalized, as accountability is as important as scoring.
What is the difference between a risk and an issue in project management?
A risk is something that might happen in the future and could negatively affect a project or objective: it is uncertain and preventable. An issue is something that has already occurred and is currently affecting the project; it is certain and requires immediate resolution. The distinction matters for governance: risks are tracked in the risk register and managed through response planning; issues are tracked in an issue log and managed through corrective action.
Many project management frameworks require separate registers for each, because the skills, processes, and stakeholders involved in managing a potential future risk differ from those involved in resolving an active problem.
How often should a risk register be reviewed?
The appropriate review frequency depends on the nature of the project or organisation, but as a general principle, active risk registers should be reviewed at least monthly for ongoing projects, quarterly for operational business units, and annually at the enterprise level, with additional ad hoc reviews triggered by significant events such as a merger, a regulatory change, a major market shift, or the materialisation of a related risk.
Stale risk registers, those with entries that have not been updated in months, are a leading indicator of a risk management program that has become a compliance exercise rather than a genuine management tool. The date of last review should be a mandatory field in every risk register.
What is a risk heat map?
A risk heat map is a visual representation of an organization’s risk landscape, typically displayed as a color-coded grid or scatter chart, in which each risk is plotted based on its residual likelihood and impact scores. Red zones indicate high-priority risks that exceed tolerance thresholds; amber zones indicate risks that require monitoring; green zones indicate risks within acceptable limits.
Unlike a standard risk matrix, which is typically used to assess individual risks sequentially, a heat map shows the full portfolio of risks simultaneously, making it particularly useful for board reporting and executive-level risk communication. Heat maps are most effective when they show movement over time: a risk migrating from amber to red, or from red to amber following a successful mitigation, tells a far more useful story than a static snapshot.
Final Words
Analyzing and managing risks is no easy task. One needs to ensure that risk analysis is not rushed. Many potential hazards need to be considered before you can manage them. If your risk analysis is flawed, you will not be able to mitigate risks and find ways to resolve them. In such a case, the response might be a knee-jerk reaction, resulting in tangible and intangible losses, such as financial or reputational loss, and consequences that might even lead to litigation. On the contrary, risks analyzed and managed correctly can yield gains that are worth the trouble and even exceed the potential loss if the risk materializes.