Whenever a business wants to pitch its idea or product, it needs a pitch deck to make its presentation effective. A pitch deck, comprised of PowerPoint slides, is a tool to convey the company and investment prospects to potential investors. These slides include a comprehensive overview of key aspects and risks integral to the business [1]. However, many founders face challenges delivering a compelling pitch to attract venture capital support. With a competitive landscape slide, they can give a strategic view of their business in the market.
Effectively conveying the competitive landscape not only boosts the pitch’s overall appeal but also assures investors of their ability to excel in the market. This article is intended for anyone facing challenges creating and presenting a Competitive Landscape Slide for a Pitch Deck.
Table of Contents
- What Is A Competition Landscape Slide In A Pitch Deck?
- What Is The Purpose Of A Competition Landscape Slide In A Pitch Deck?
- Benefits of a Competition Landscape Slide
- Key Elements of Competitive Landscape Slide
- Data For Competitive Analysis Deck
- Design And Visual Considerations for Competitive Landscape Slide Pitch Deck
- Tips for Making a Competitive Landscape Slide
- Real-Life Examples of Presenting Competition Slides in a Pitch Deck
- Recommended Competitive Landscape Slide Templates
- How to Present the Competition Slide
- Conclusion
- References
What Is A Competition Landscape Slide In A Pitch Deck?
A competition landscape slide or competitive analysis slide in a pitch deck highlights the potential competitors in the market and examines how they address the specific problem in the market [2]. This slide summarises where a business stands compared to its current and potential competitors. It makes it easier for businesses to understand the overall marketplace and convince investors about their business expertise in the field [2].
If you’re still unclear, why do I need a competitor slide pitch deck? The answer is simple: you need it because it gives your investors a contextual understanding of your business environment and highlights your unique value proposition against competitors. When an individual or a firm presents their idea, the audience first wants to know what it’s about [7]. Here comes your value proposition; it describes your business in one sentence and explains why customers would find it valuable. The competition slide also presents your strategic positioning and builds investor confidence by focusing on market awareness and adaptability. Therefore, grab investor’s attention with your pitch deck competitive analysis because that’s the first thing they want to see to learn more about your company position.
What Is The Purpose Of A Competition Landscape Slide In A Pitch Deck?
A competitive landscape slide intends to observe the competitive forces in the potential market and present product differentiation. It assesses the weaknesses and strengths of different competitors. Based on this competitor analysis, the business develops its strategy to win the competition [3]. It provides a foundation for discussing the company’s positioning and competitive advantages.
The second component of the Competition Landscape slide is centered around setting the stage for investor understanding. Investors do not care about how great you think you are; they are more interested in how their investment can grow. Innovative entrepreneurs research possible investors and create a compelling pitch deck competitive analysis to persuade them. Investors seek information on the team, product, value proposition, and potential return on investment [4]. Assessing the startup’s uniqueness and investmentworthiness is also crucial for potential investors. The competition slide facilitates a shared understanding between entrepreneurs and investors by transparently presenting relevant market information. It provides a platform for constructive discussions, aligning expectations, and instilling confidence. Thus, a persuasive pitch deck competitive analysis enhances the ability to think strategically and adapt to market changes.
Benefits of a Competition Landscape Slide
Having a powerful competitive landscape slide pitch deck will benefit the pitch deck presentations in several ways;
Clear Market Positioning
It simplifies complex market dynamics by providing a quick and intuitive understanding of their market position. Investors want to know how you plan to reach the target market with your products and services. For entrepreneurs, the real challenge often lies in getting their offerings in front of customers. To succeed, entrepreneurs must show they have a good handle on reaching their target audience [6]. The competitor slide points out the differences in your sales approach compared to your competitors.
Visualizing Competitive Advantages
The slide facilitates a direct comparison by presenting a visual overview of competitors. This helps identify and highlight their business’s strengths. The graphical representation, thus, enhances understanding.
Strategic Focus
It emphasizes key advantages, which guide the audience’s attention to critical aspects of a business’s competitiveness. It ensures that the presenter’s unique selling points are at the forefront of the presentation. Demonstrating a grasp of marketing challenges, identifying opportunities, and outlining strategies to outperform competitors needs market awareness, creativity, commitment, and a proactive approach [5].
Decision-Making Support
Internally, the Competition Landscape Slide serves as a decision-making tool by providing a concise overview of competitive dynamics. This supports strategic planning and helps the company make informed decisions based on a thorough understanding of its competitive advantages.
Key Elements of Competitive Landscape Slide
A competitive slide mainly focuses on a few elements for its completion.
Competitors
The first and most important element of competitive landscape analysis is mentioning the top competitors of a business. It includes both direct and indirect competitors. Direct competitors provide similar products or services and target the same customer base. Conversely, indirect competitors offer different products or services but cater to the same customer needs. You identify your direct competitors through market research and customer feedback analysis. However, it is essential to understand the broader market to find indirect competitors. Looking for alternatives to your products or services will help you to identify indirect competitors.
For instance, direct competitors for a coffee shop would be nearby coffee shops that offer coffee beverages. However, a tea shop or a juice bar that doesn’t offer coffee but still attracts customers looking for a beverage is considered an indirect competitor of the coffee shop. They are identified and presented as crucial players in the market. At the same time, investors also need a clear understanding of the competitive landscape to gauge the context of a business.
Your Unique Selling Propositions
Unique Selling Propositions (USPs) are like the extraordinary things that make your business stand out in a crowd. When creating a Competitive Landscape slide, consider what makes your business unique and better than others. Start by listing these standout qualities, like super-fast pizza delivery or using top-notch ingredients at affordable prices. Use simple words and maybe even pictures to show these strengths, making it easy for everyone to understand why your business is special.
Strengths and Weaknesses of Competitors
Another important element of the competition slide is identifying the weaknesses and strengths of their competitors. It allows the business to improve its market position. Competitors’ strengths threaten your business, whereas their weaknesses can be seen as opportunities. Understanding both will help you to strengthen your position in the market.
Differentiation
Differentiation is a broader concept that includes the overall uniqueness of your business. It effectively communicates how a company differentiates itself from its competitors. This is crucial for creating a unique brand identity and ensuring stakeholders understand the specific aspects that make their products or services preferable in the market. It includes not only the unique features of your product or service (which align with your USPs) but also factors like brand image, customer experience, or even your business processes. It is about creating a distinctive identity that sets you apart in the market. Think about things that make you better in the eyes of your target audience. Here, we suggest you emphasize the value your business brings to customers (like a cozy atmosphere and personalized service in a coffee shop scenario).
Data For Competitive Analysis Deck
A presenter must gather various data types to create a solid competitive landscape slide in a pitch deck. Here’s the breakdown of the essential data required;
Competitor Information
Names and brief descriptions of key competitors are required. Each competitor, with its distinct size and historical background, and its contribution to the overall context of the industry. Therefore, presenting market share data for significant competitors and their geographic presence is important.
Financial Metrics
Present key financial metrics for both the company and its competitors. This could include revenue growth rates, profitability, and other relevant financial indicators. This data is visualized through charts or graphs for a quick, comparative analysis.
Market Share Dynamics
Businesses illustrate changes in market share over time, demonstrating how the company and competitors have evolved within the market. It discusses pricing trends, regulatory factors, and other external influences shaping market dynamics. This dynamic perspective provides valuable insights into the competitive landscape’s fluidity.
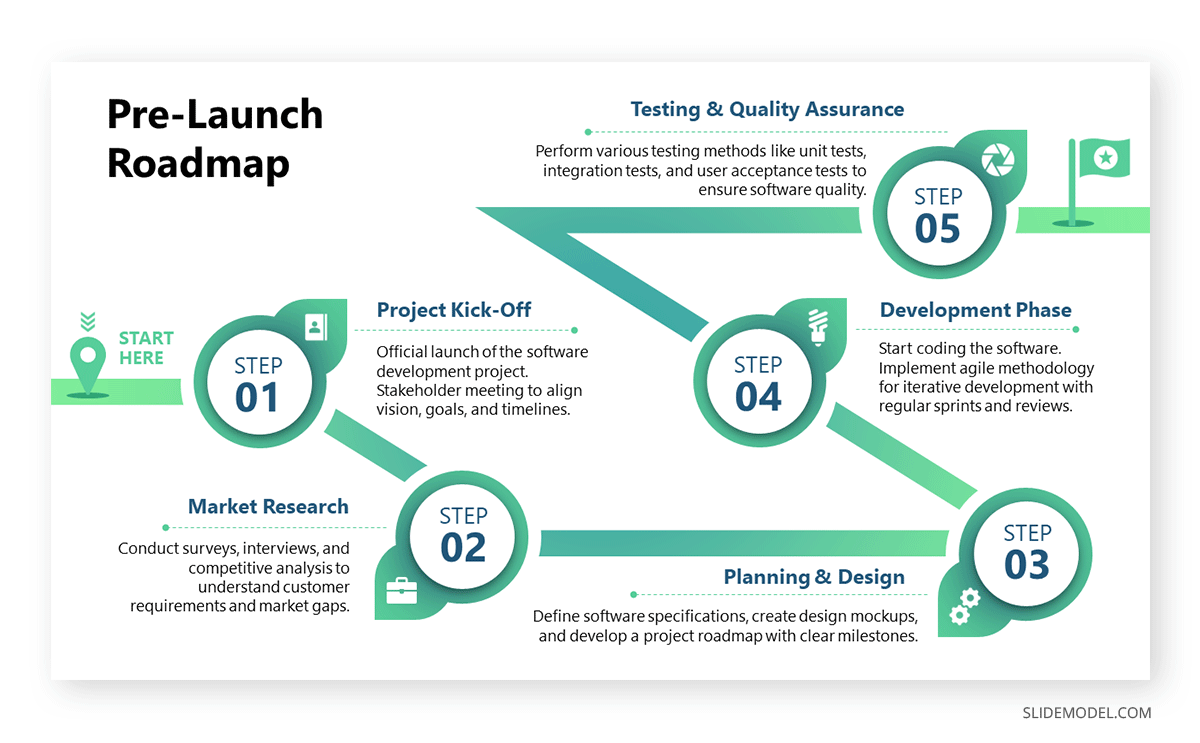
Innovation and Product Roadmap
It highlights the innovation pipeline for both the company and its competitors. This could include data on upcoming product releases, technological advancements, or unique features. This form of data indicates the future market positioning.
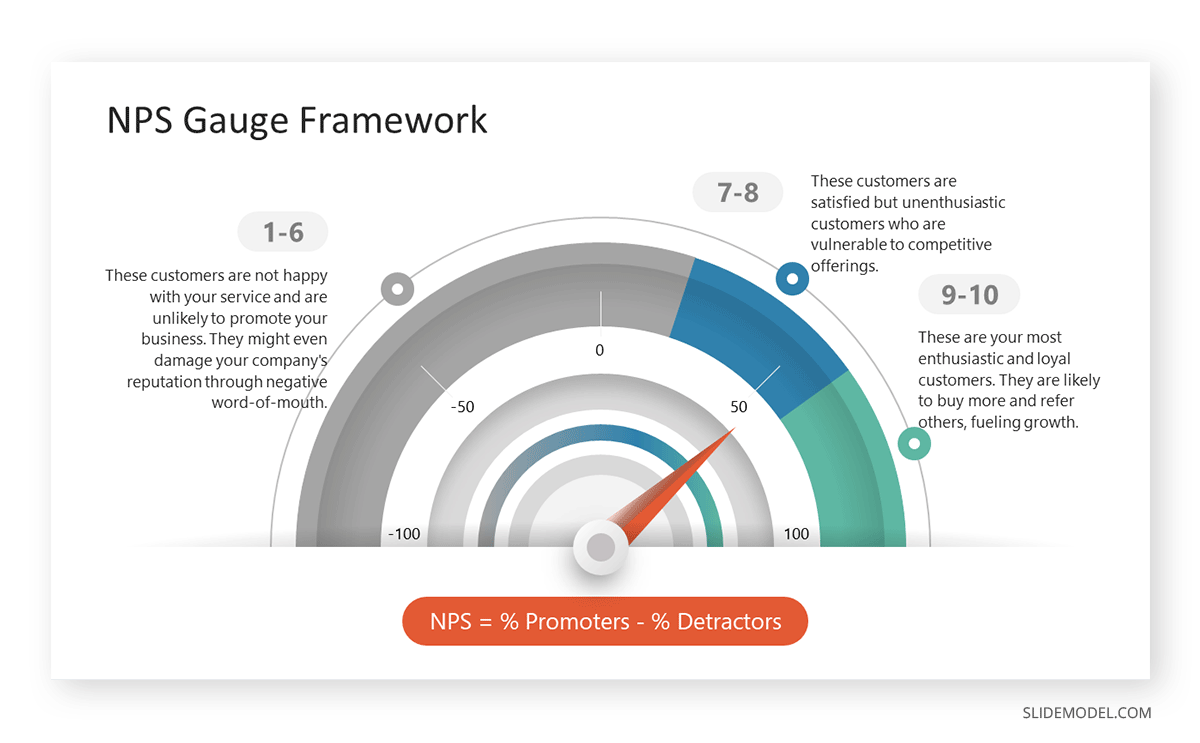
Customer Feedback and Reviews
Understanding customer needs and preferences is the bedrock of strategic positioning. Presenters emphasize consumer-centric value propositions by explaining how a product fulfills these requirements more effectively than competitors. This qualitative data offers a glimpse into customer satisfaction levels and can be a powerful indicator of market reception.
Design And Visual Considerations for Competitive Landscape Slide Pitch Deck
A pitch deck does not have a fixed number of designs for visual representations of competitive landscapes. Choosing a design depends on the specific needs of the presentation, the industry, and the presenter’s preferences. However, we can provide some standard designs and frameworks for visualizing competitive landscapes.
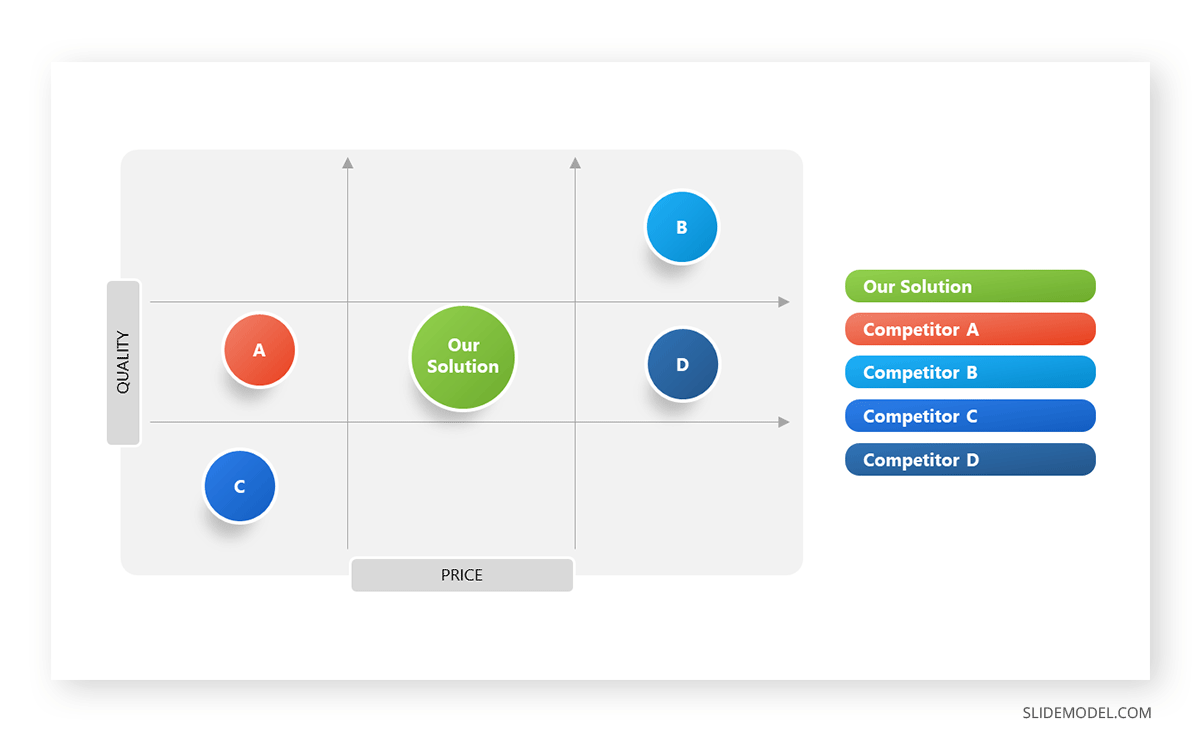
Competitive Matrix
A Competitive Matrix, also known as a Competitive Positioning Map, is a visual tool that compares competitors based on two key dimensions relevant to a specific industry. You can use a two-dimensional grid, each axis representing a different criterion. You identify two critical criteria for comparison; suppose those are “Product Features” and “Price.” Place each competitor on the matrix based on their performance in these criteria. Clearly label each axis, ensuring the audience understands the dimensions of comparison. You can use symbols or color coding to represent different competitors. It provides a clear visual representation of how competitors stack against each other.
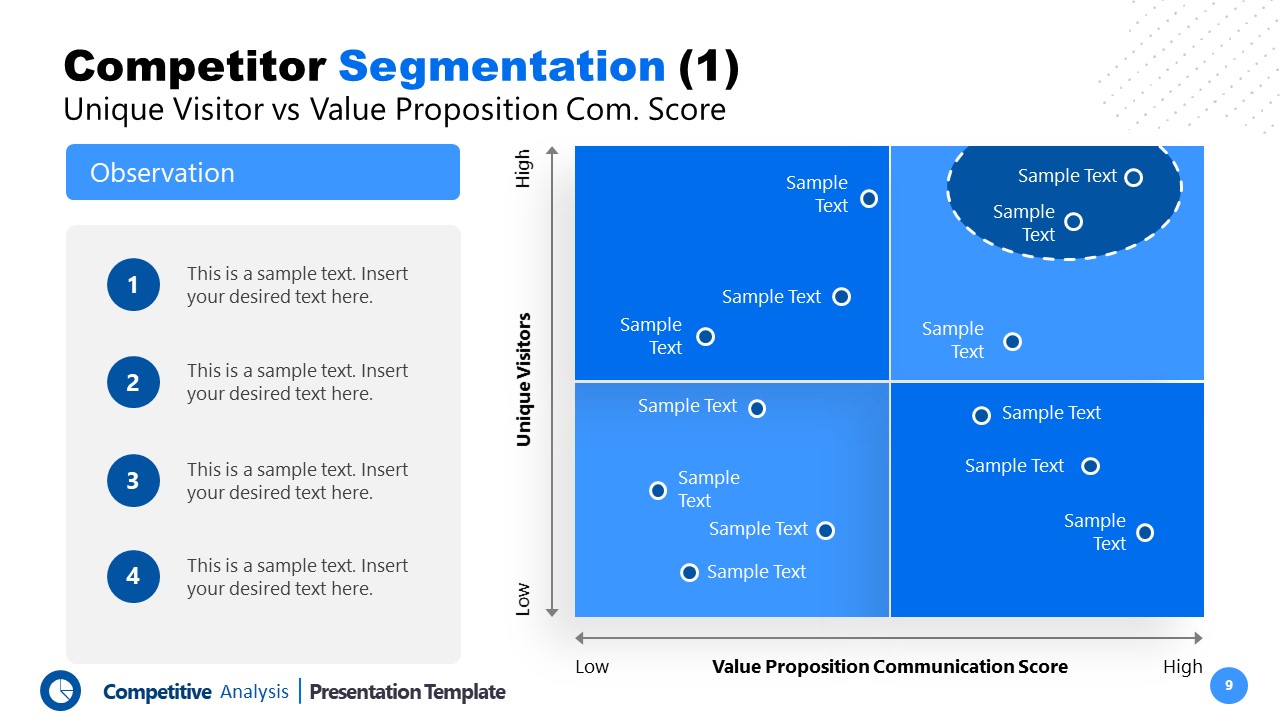
Market Map with Magic Quadrant
A Market Map, enhanced with the Magic Quadrant, places competitors in specific quadrants based on their performance in key dimensions. This adds categorization to the Market Map. It categorizes competitors based on their performance in any two critical criteria. Identify relevant criteria for your industry, plot each competitor on a graph according to their performance in these criteria, and label the quadrants accordingly. Provide concise explanations for why each competitor falls into their designated quadrant.
Let’s imagine a graph with two axes – one measuring how well companies execute their plans and the other presenting their visionary thinking. This creates four quadrants: Leaders, Challengers, Visionaries, and Niche Players. If a company is a ‘Leader,’ it means it excels in both execution and vision. This visual aid makes it easy for the audience to understand the relative positions of competitors in terms of innovation and market performance.
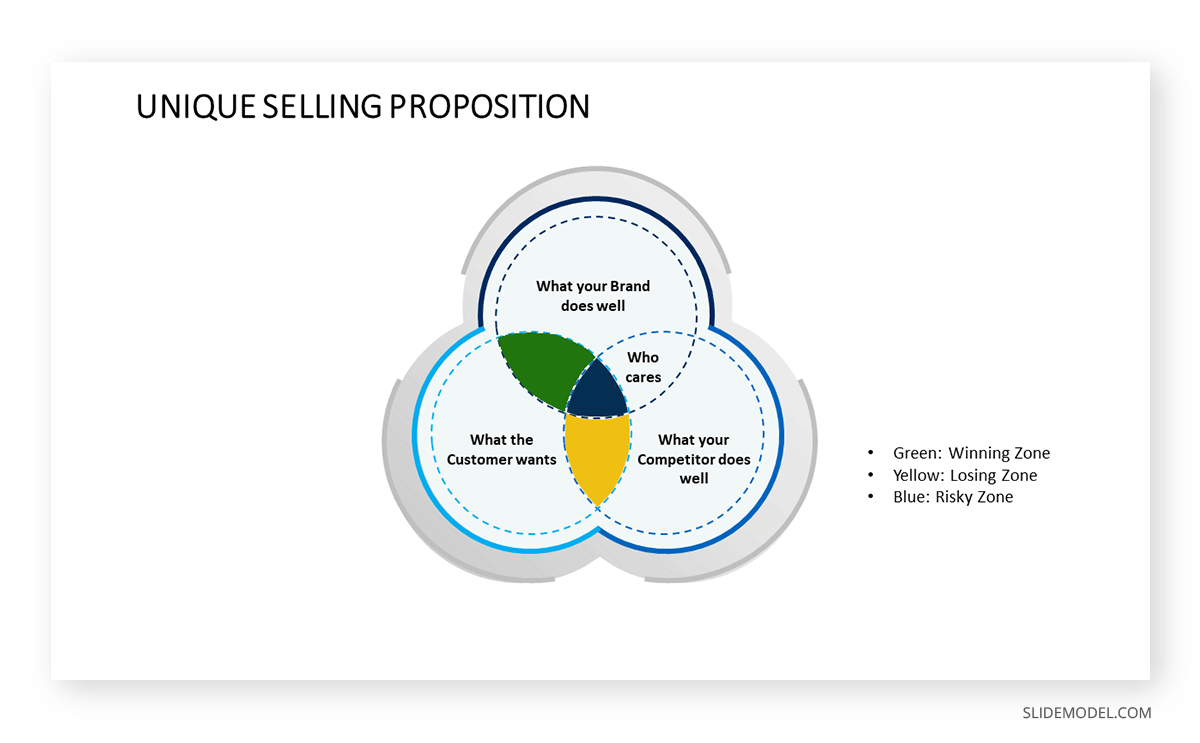
Venn Diagram
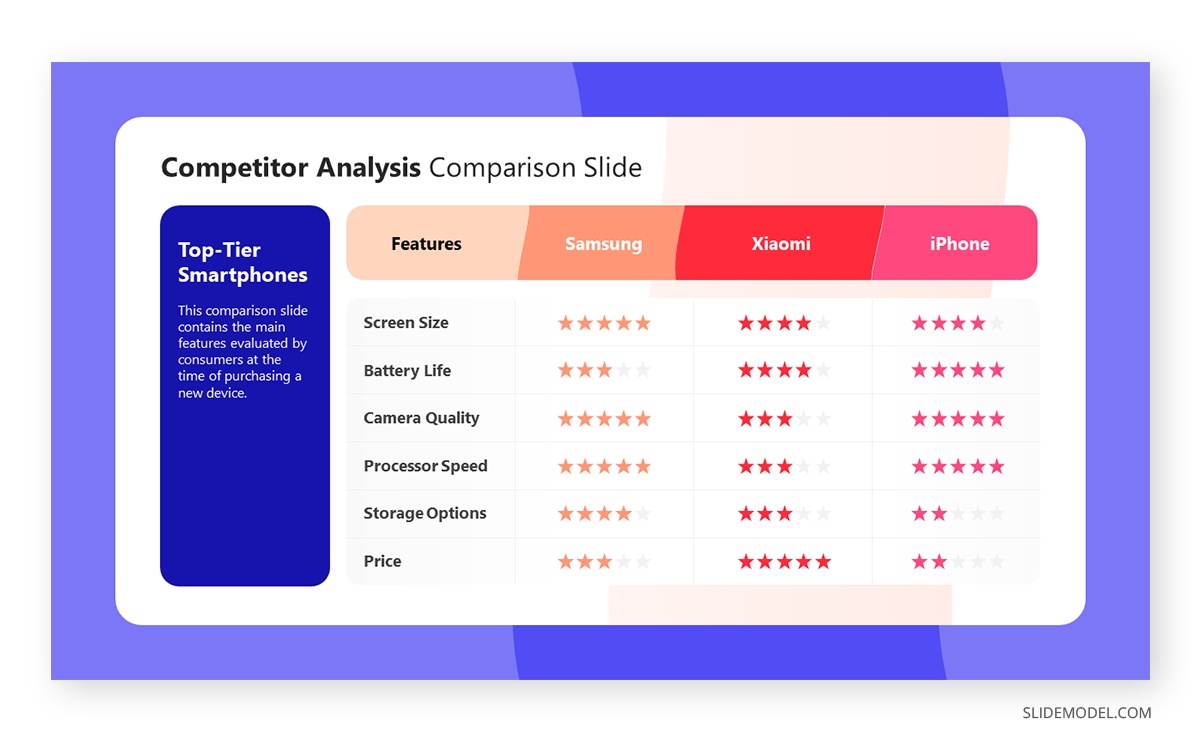
Using a Venn diagram as overlapping circles reveals where competitors share similarities or have unique traits. This design is helpful because it emphasizes commonalities and differences. It helps highlight shared attributes or market niches, clearly understanding where each competitor fits in the broader market. For instance, if you’re in the smartphone business, one circle might represent ‘Excellent Camera’ and another ‘Affordable Price.’ The overlap in the middle is where a competitor offers both. This helps your audience understand the strengths and differences between companies in a simple, engaging way.
Comparison Table
A Comparison Table is a straightforward grid that compares competitors based on specific criteria. This design offers a side-by-side comparison of strengths and weaknesses. It helps the audience assess key features and attributes. Envision a Comparison Table as a scorecard for competitors. List critical criteria like features, pricing, and customer support. Each competitor gets a column, and you fill in the scores. Give yourself a point if your product has a feature that others don’t. This table becomes a visual summary of who is leading in different aspects, making it easy for your audience to compare and contrast.
Benefits Table
A Benefits Table focuses on showcasing the advantages or benefits of your product or service compared to competitors. This design is beneficial in a competitive landscape slide as it communicates your unique value proposition. It helps the audience understand why your offering stands out, fostering a compelling case for your product or service. Picture a Benefits Table as a showcase of your product’s strengths. List the key benefits you offer, like ‘Faster Service’ or ‘User-Friendly Design.’ Now, compare these against your competitors. If your service is faster, give yourself a checkmark. This table is a visual testament to why your product stands out in the crowd. You can also use matrix templates to represent benefits visually. These templates allow you to compare various aspects, such as features, pricing, or market share.
Storytelling Through Design
Craft a visual story through your design choices. Guide the audience through a visual narrative highlighting challenges, opportunities, and how your business strategically positions itself among competitors. Walk your audience through the competitive landscape, emphasizing the evolution of your business and its strategic positioning. You can use pitch deck templates to maintain a professional and consistent look throughout your presentation. It provides a structured format for telling your story.
Tips for Making a Competitive Landscape Slide
You can represent your pitch deck competitive analysis in different ways. However, it is important to be unique and communicate that clearly with your audience. A few tips help you differentiate your product or service from your competitors.
Use of Logos Instead of Text
Instead of using the full names of competitors, you can place competitor logos strategically to show their positioning in the market. This keeps things simple and avoids a jumble of colors by using grayscale.
Color Psychology
It is important to use colors strategically for aesthetics and to evoke certain emotions or perceptions. For example, bold colors signify strength, while softer tones suggest innovation. Align color choices with your brand identity and messaging. You can use different colors to represent your potential competitors.
Interactive Elements
If presenting digitally, consider adding interactive elements. This could involve clickable elements that reveal additional information or a slide progression that simulates a dynamic market landscape.
Flow and Cohesion
A smooth flow across slides maintains cohesion in design elements. A well-designed competition section should seamlessly integrate with the overall narrative of your pitch deck. Use the same color scheme, fonts, and overall layout. This consistency creates a cohesive visual story, keeping the design similar across all slides.
Checklists & Diagrams
Checklists and diagrams show how a business is different from its competitors. This helps people understand quickly what sets it apart.
Clear Fonts and Colors
Choosing fonts and colors that are easy to read is also important. This clarity ensures that everyone understands the information. Consider using colors and designs to make important information stand out. It ensures that the audience immediately recognizes and focuses on the most crucial metrics. This helps people focus on the key details.
Concise and To-The-Point
The Information in the competitive slide should be short and straightforward. It is not essential to use too many words or complicated explanations.
Choosing the Right Chart
A presenter has to decide whether a bar chart, Venn diagram, magic quadrant, or another type of visual would work best. This will depend on the type and nature of the information. A bar chart is a good option for quantitative data like market share percentages or revenue figures.
Real-Life Examples of Presenting Competition Slides in a Pitch Deck
Example 1: Technology Industry – Matrix Comparison
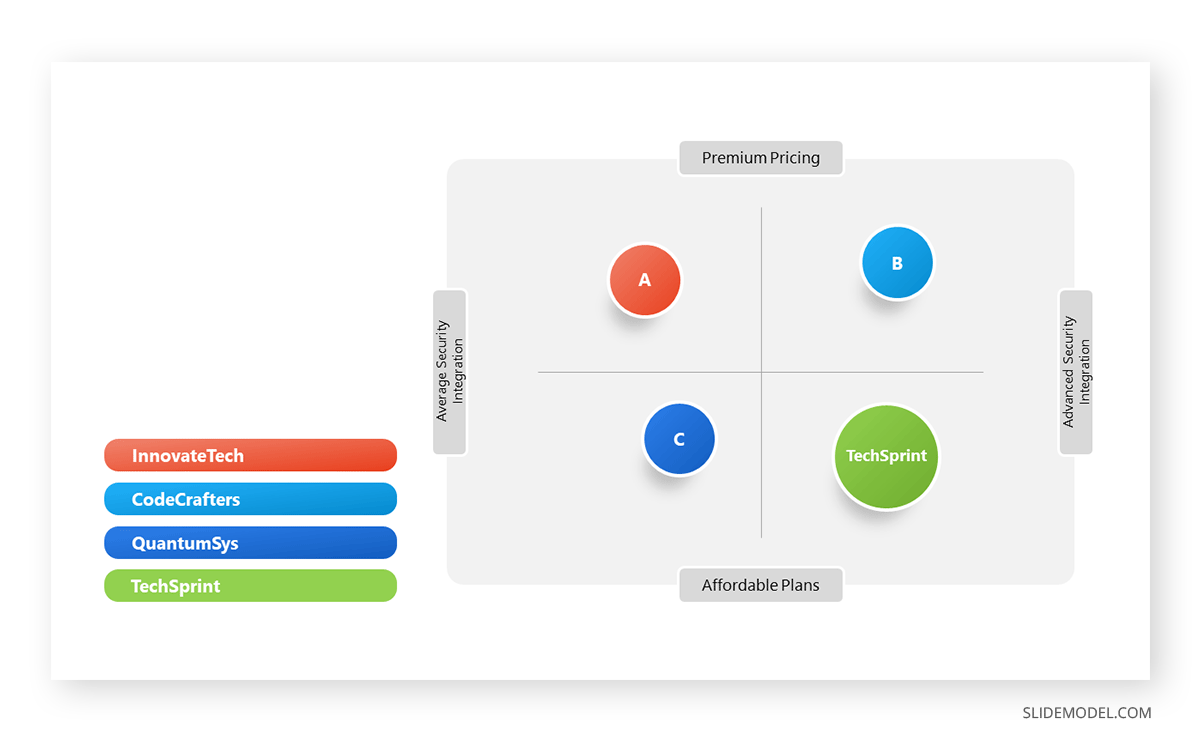
TechSprint strategically places itself in the competitive matrix against three main competitors in the tech industry: InnovateTech, CodeCrafters, and QuantumSys. Using the comparison matrix, we will learn how to present a detailed competition slide in a pitch deck.
Step 1: Identifying Top Competitors
In the initial phase, we carefully pinpointed the top competitors for TechSprint in the technology market. The selection criteria assessed market share, product offerings, and overall influence within the tech sector. InnovateTech, CodeCrafters, and QuantumSys emerged as the primary contenders due to their significant presence and alignment with TechSprint’s scope.
For competitor identification, it’s crucial to consider factors such as market share, product/service offerings, customer base, and industry reputation. A thorough analysis of companies with similar target audiences and frequent mentions in industry reports helps the selection process.
Step 2: Preparing Data for the Matrix
With our competitors identified, our focus shifted to preparing data for the Competitive Matrix. Key categories were chosen, emphasizing Innovative Features and Pricing Plans. These categories provide a detailed view of each company’s strengths and differentiators, laying the foundation for an insightful comparison.
We prioritized internal sources, market research insights, and valuable user feedback in collecting data. The goal was to ensure the information was current and relevant for an accurate representation.
Step 3: Designing the Matrix
Transitioning into the design phase, a magic quadrant-style matrix is crafted, with Innovative Features along the X-axis and Pricing Plans along the Y-axis.
X-Axis (Innovative Features)
– Right Side: Advanced Security Integration
– Left Side: Average Security Integration
Y-Axis (Pricing Plans)
– Upwards: Premium Pricing
– Downwards: Affordable Plans
To enhance visual appeal, icons representing features were strategically placed within the cells, and color-coded elements were introduced for emphasis.
Step 4: Populating Matrix with Data
The subsequent step involved populating the Magic Quadrant-style matrix with specific data:
TechSprint: Positioned at coordinates (X1, Y2) in the lower-right quadrant, indicating advanced security integration at affordable pricing.
InnovateTech: Positioned at coordinates (X2, Y1) in the upper-left quadrant, highlighting average security integration at premium pricing.
CodeCrafters: Positioned at coordinates (X1, Y1) in the upper-right quadrant, offering advanced security integration at premium pricing.
QuantumSys: Positioned at coordinates (X2, Y2) in the lower-left quadrant, highlighting average security integration at affordable pricing.
This specific data population ensures that each quadrant in the Magic Quadrant-style matrix communicates essential information, offering a focused comparison between TechSprint and its competitors regarding innovative features and pricing plans.
Step 5: TechSprint’s Strategic Positioning
This shows TechSprint’s strategic positioning compared to its competitors. It means they offer advanced security features at an affordable price. This smart positioning sets TechSprint apart, demonstrating its commitment to bringing cutting-edge tech within everyone’s reach.
Example 2: Retail Industry – Comparative Strengths Table
In the highly competitive retail sector, FashionFleet employs a Comparative Strengths Table to showcase its unique advantages over key competitors: UrbanChic, OutdoorEssence, and TrendyThreads.
Step 1: Define the Purpose of the Comparison Table
Clearly articulate the goal of the Comparative Strengths Table – in this scenario, FashionFleet aims to illustrate its distinct advantages compared to key rivals in the competitive retail sector, including UrbanChic, OutdoorEssence, and TrendyThreads.
Step 2: Identify Key Comparative Factors
Carefully identify the critical factors for comparison. This example encompasses Product Diversity, Target Demographics, Brand Recognition, Online Presence, and Innovative Offerings.
Step 3: Determine Ranking Criteria
Establish criteria for ranking each factor. For instance, Product Diversity can be rated from extensive to limited, and Brand Recognition can range from established to niche.
Step 4: Create Table Structure
Construct a table structure with columns representing each competitor and rows for each comparative factor. The first column should describe the competitive strengths, ensuring a clear and concise presentation.
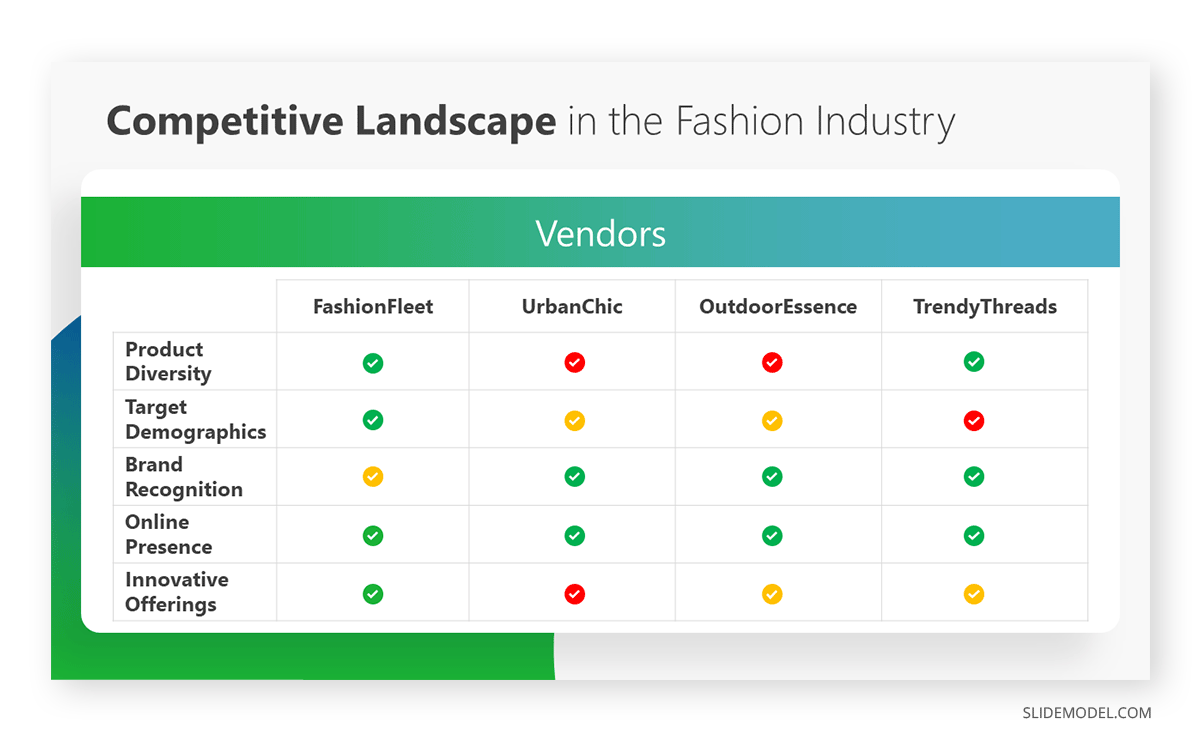
These adjustments use ticks and crosses to indicate the presence or absence of competitive strengths for each factor and competitor.
The table reveals distinct advantages for FashionFleet in the highly competitive retail sector. It provides a visual snapshot of FashionFleet’s strengths, highlighting extensive Product Diversity, a Diverse Target Demographic appeal, Established Brand Recognition, a Strong Online Presence, and Trendsetting Innovative Offerings. In contrast, competitors such as UrbanChic, OutdoorEssence, and TrendyThreads exhibit varying strengths and weaknesses in these key factors. This comparative analysis serves as a powerful tool for strategic decision-making. It lets stakeholders quickly grasp FashionFleet’s competitive edge and make informed choices in the dynamic retail landscape. The visual clarity and concise representation of strengths make the table an effective communication tool for showcasing FashionFleet’s market positioning and differentiation.
Recommended Competitive Landscape Slide Templates
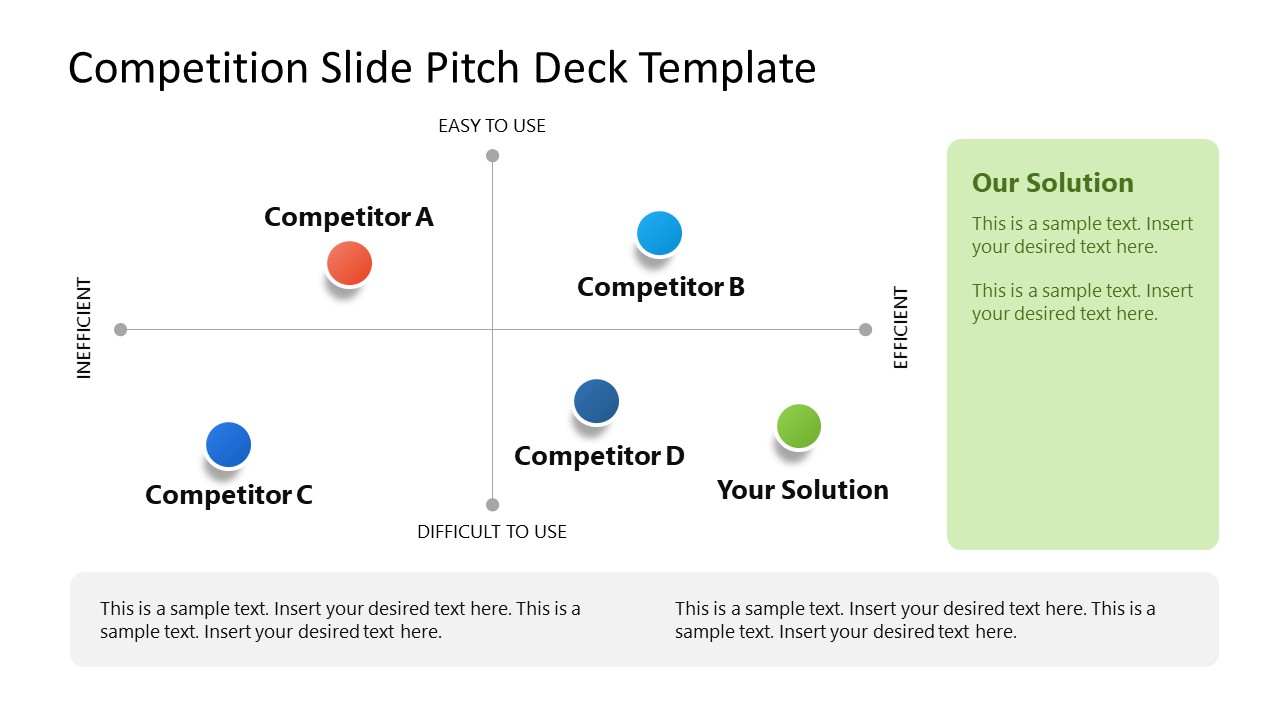
1. Competition Slide Pitch Deck Template for PowerPoint
Bring your competitive landscape slide to life by using this easy-to-customize pitch deck competition template. Four different layouts to represent your ideas for clear communication.
2. Venn Diagram Unique Selling Proposition for PowerPoint
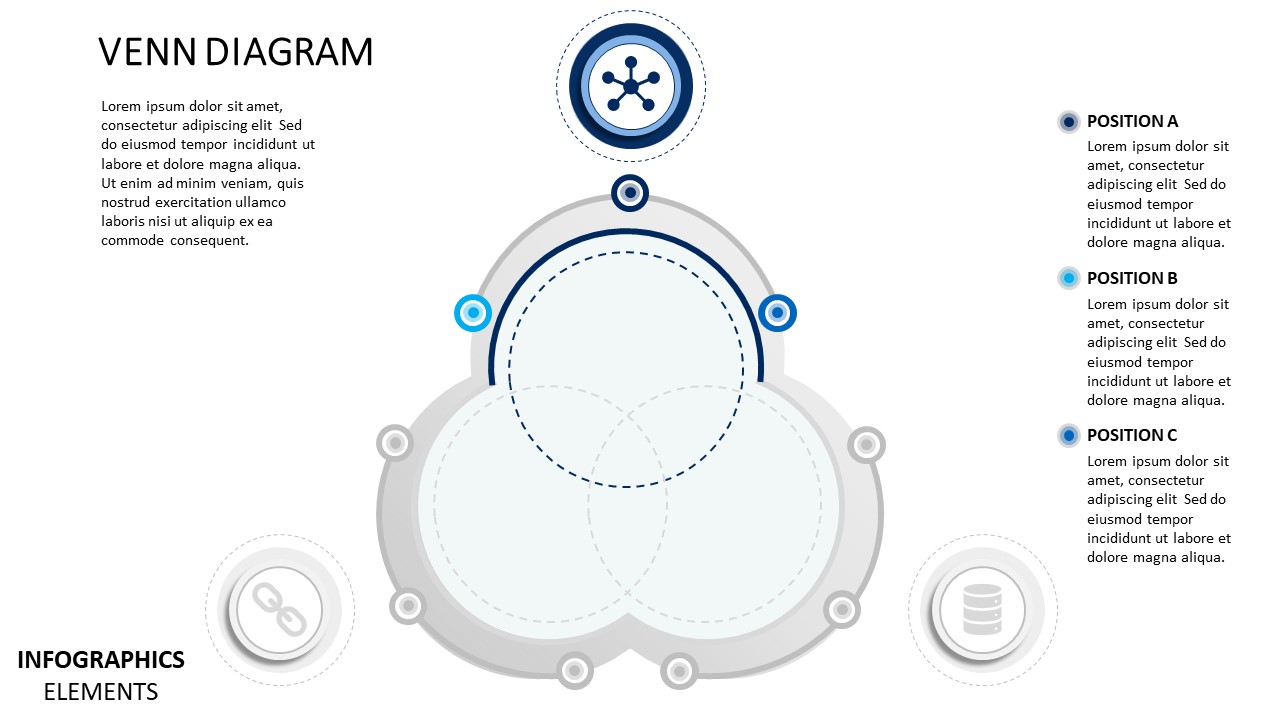
Create your USP Diagrams in the blink of an eye by editing this multi-purpose Venn diagram PPT template. An ideal complement for your competitive landscape slide pitch deck.
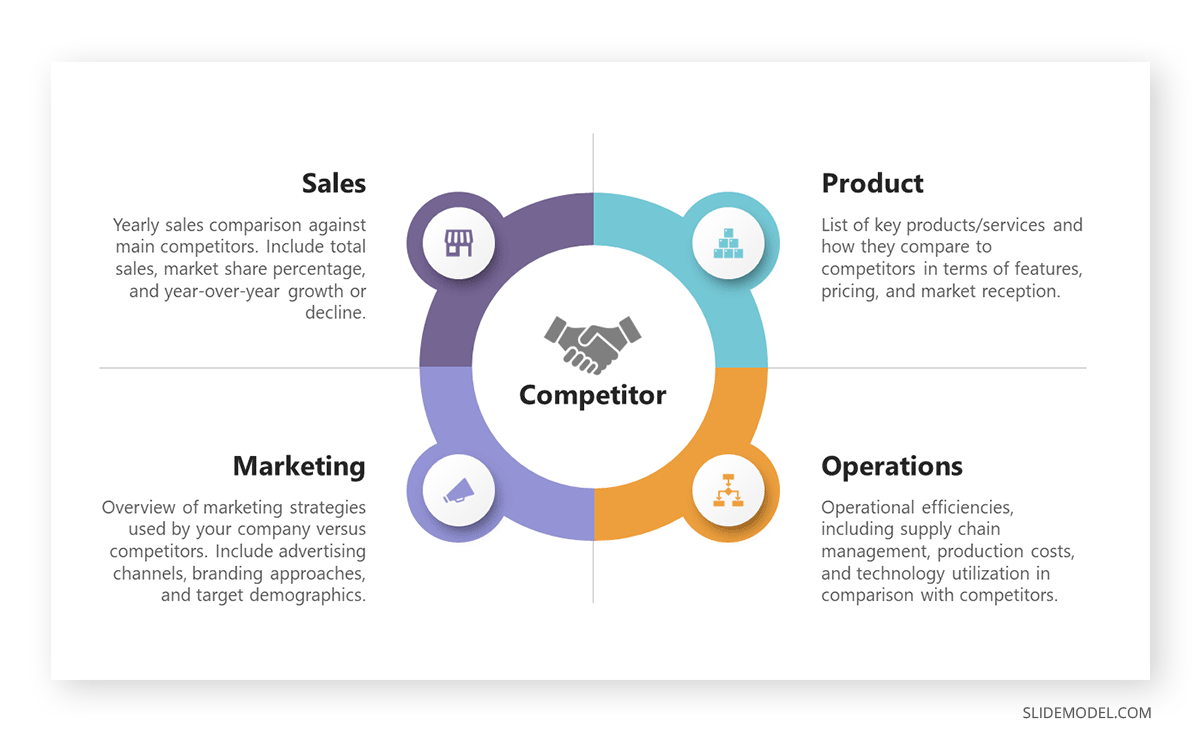
3. Pitch Deck Competitor Analysis PowerPoint Template
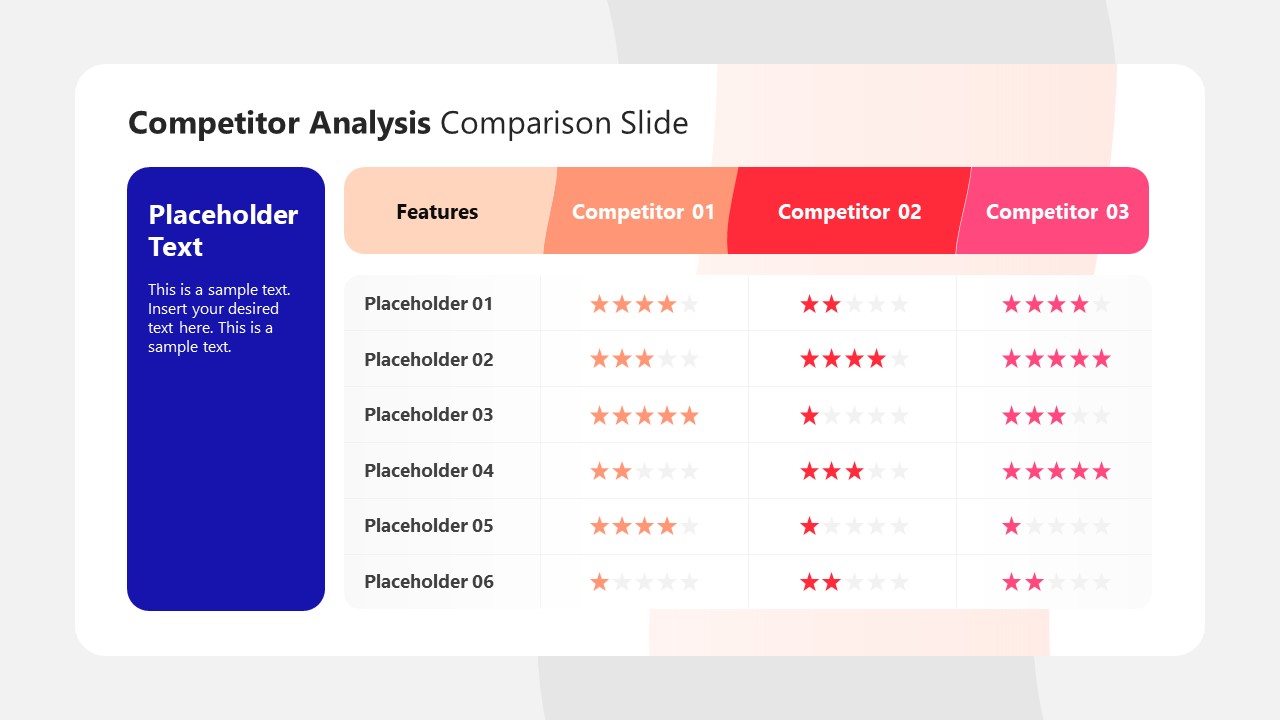
Your presentations can depict key competitor information by using a highly visual slide that contrasts features among three different competitors. The blue placeholder area informs the audience what the comparison is about.
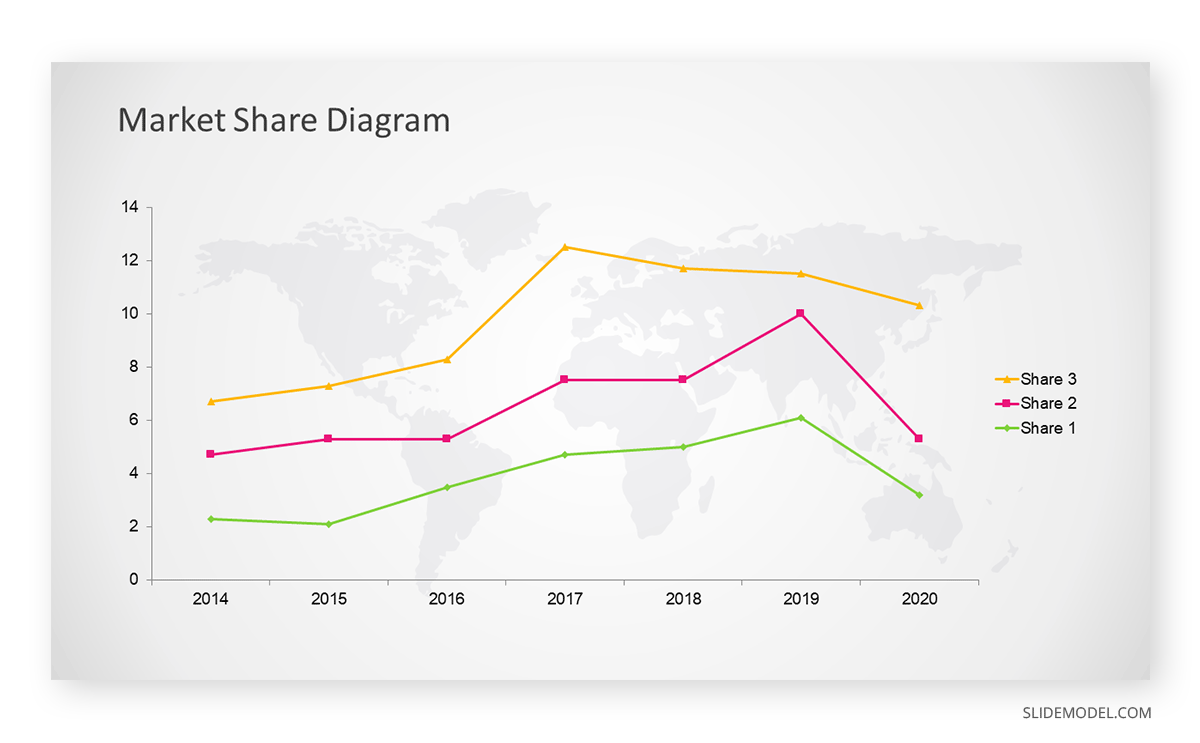
4. Market Share Diagrams for Competitive Landscape Analysis
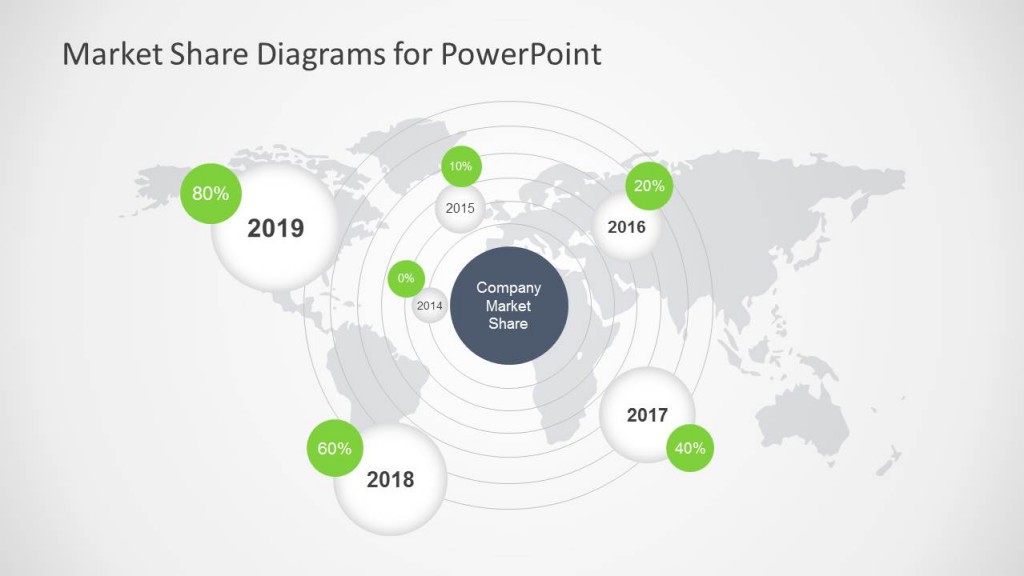
Represent the evolution of market shares through a specific time period by using this PPT template. It allows us to give a global overview of the current positioning, discuss one market share in particular, or study the trend changes.
5. Competition Slide Matrix Pitch Deck Template
Use a Perceptual Map to analyze competitor financial data in an understandable format for easier study. Presenters can further complement this pitch deck competitor analysis template with handouts of raw financial data or upcoming graph slides.
6. Competitive Advantage Slide Pitch Deck
Grab a compendium of tools intended to create outstanding competitor analysis studies for your business presentations. An ideal set of tools for presenters looking to simplify data in a highly visual format.
7. Competitive Landscape Template for PowerPoint
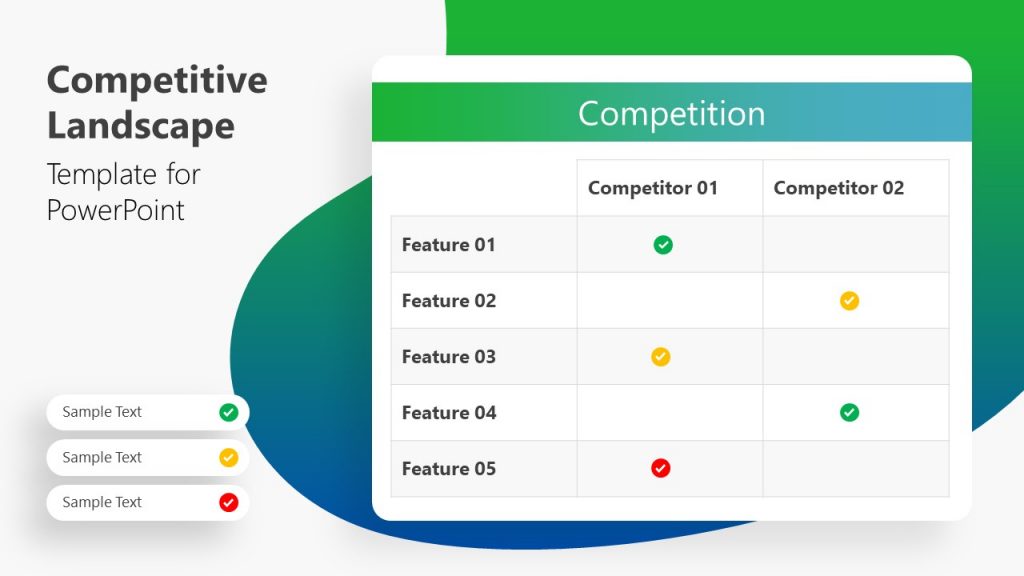
If your intent is to represent a competitive landscape slide in style, this is the option to go. Layouts for comparison between 2, 3, 4 and 5 competitors, with 5 rows to list features.
How to Present the Competition Slide
Begin with a confident and engaging introduction, setting the stage for the competitive landscape discussion. Clearly state the purpose of the competition slide to guide the audience’s understanding.
Presenters must focus on emphasizing what sets your business apart, ensuring a confident delivery that builds trust in investors. Use visuals to enhance clarity and make complex information more accessible. When handling questions and objections, approach them calmly and composedly. Anticipate potential concerns investors may have about your competition slide and be ready to address them with well-prepared responses. Acknowledge weaknesses transparently, but pivot to your strengths and unique value propositions. This showcases your understanding of the competitive landscape and demonstrates a proactive approach to potential challenges.
Regarding the final stages of your presentation, we highly advise you to engage in active listening during the Q&A session, ensuring you comprehend the specific concerns raised. Respond thoughtfully, drawing on the data and insights presented in your competition slide to reinforce your strategic positioning. Anticipate questions and objections, preparing well-reasoned responses. Use data and visuals to support your arguments and turn objections into opportunities.
Conclusion
Creating a competitive landscape slide in your pitch deck is pivotal for entrepreneurial success. A competition slide is not just a visual representation; it’s a strategic tool that communicates your business’s unique value proposition, strengths, and market positioning. It is a dynamic narrative that propels your pitch forward. Craft it carefully, align it with your storytelling, and watch it secure your business’s desired position.
References
[1] Kamps, H.J., 2020. Pitch Perfect. Apress. https://www.goodreads.com/author/list/157492.Haje_Jan_Kamps
[2] Getty, P.M., 2014. The 12 Magic Slides: Insider Secrets for Raising Growth Capital. Apress.
https://www.goodreads.com/book/show/42282282-the-12-magic-slides
[3] Pistelli, D. 2022. Chapter 4: Pitch Deck Guidelines. GründerAtelier. https://gruenderatelier.de/9-easy-steps-to-get-investment-ready-chapter-4-pitch-deck-guidelines/
[4] Laverty, M. and Littel, C. (no date) 7.3 Developing Pitches For Various Audiences And Goals – Entrepreneurship, OpenStax. https://openstax.org/books/entrepreneurship/pages/7-3-developing-pitches-for-various-audiences-and-goals
[5] Shimasaki, C. 2020. Investor Presentations: What Do You Need in an Investor Pitch Deck? Biotechnology Entrepreneurship, 325–336. doi:10.1016/b978-0-12-815585-1.00023-1
[6] Aderibigbe, B., 2017. The key elements of investors’ presentation. https://www.theseus.fi/bitstream/handle/10024/124513/The%20Key%20Elements%20of%20Investors%20Presentaion.pdf?sequence=1
[7] Spinuzzi, C., Nelson, S., Thomson, K.S., Lorenzini, F., French, R.A., Pogue, G., Burback, S.D. and Momberger, J., 2014. Making the pitch: Examining dialogue and revisions in entrepreneurs’ pitch decks. IEEE Transactions on Professional Communication, 57(3), pp.158-181. https://repositories.lib.utexas.edu/server/api/core/bitstreams/2de34b35-42a9-4118-ae77-b4adf96e29d5/content