Business Review PowerPoint Template – Create Quarterly Reports and Annual Business Reviews with this professional PowerPoint Template that provides a structured theme to present every corporate area with data driven charts and infographics.
Business Reviews are quarterly and annual publications comprising information about results of and organization strategies. Generally carried on by the C-Level executives of an organization to present it to shareholders, involves a performance oriented strategic review of the business, focusing on financial results, process improvements, production yield and improvements in other measurable key performance indicators like people retention, attrition or working mood. Business Review are fundamental not only for measuring performance of past events but also to analyze future plans and objectives. The current strategies should be tackling the areas where poor performance is identified.
Modern organizations execute management by indicators practices and implement formal business reviews mechanisms in order to monitor overall strategic performance and be in control of the business.
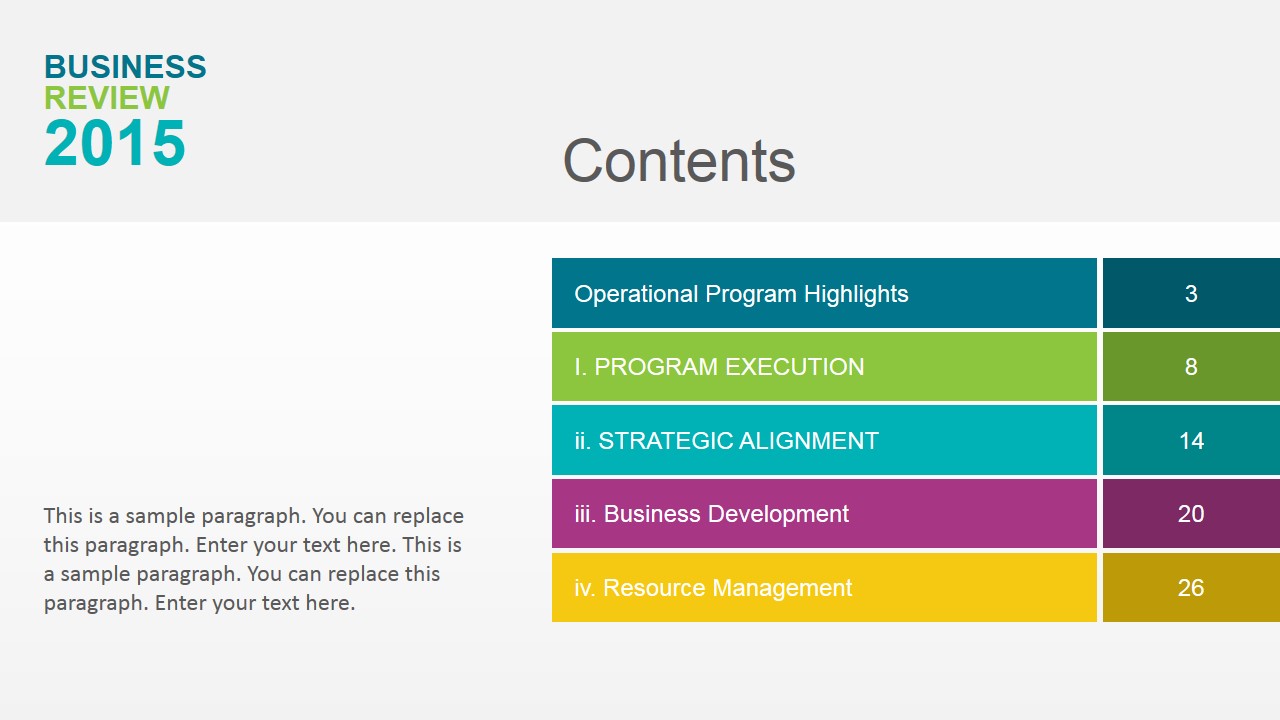
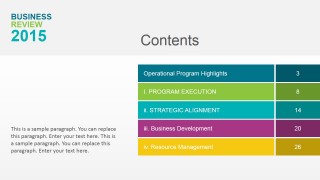
The Business Review PowerPoint Template covers the main strategic areas of every organization (small or big).
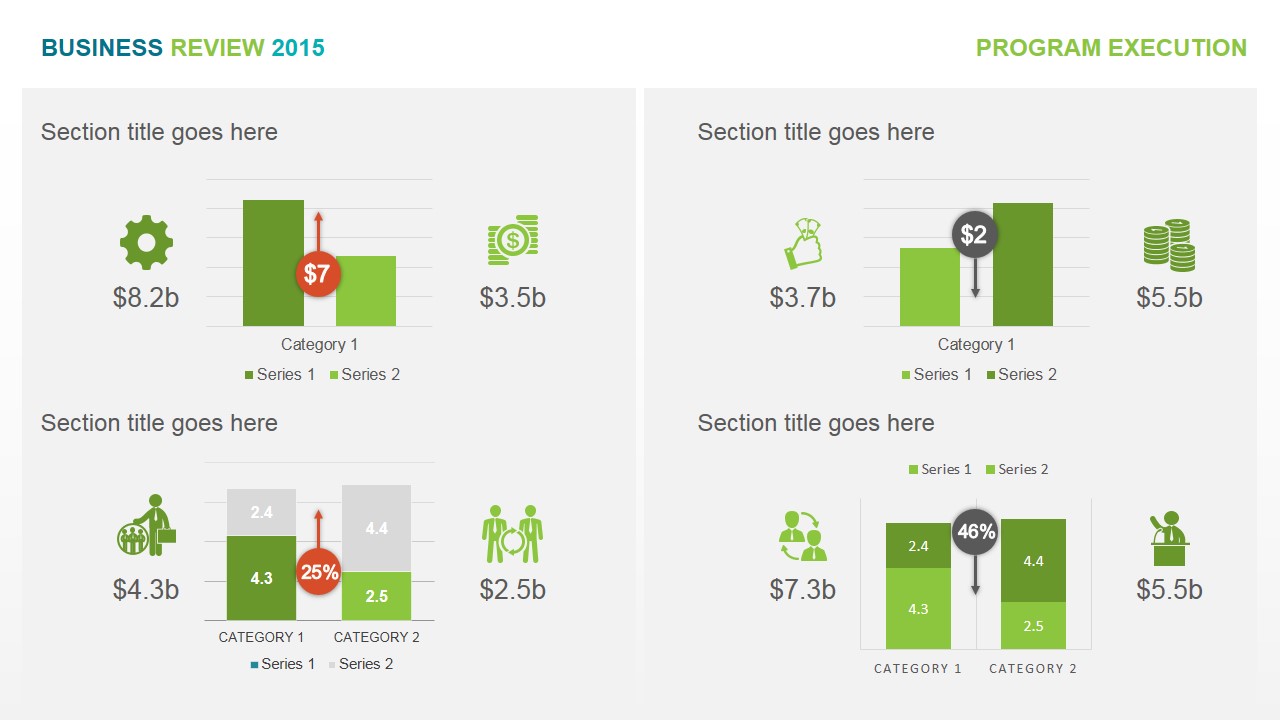
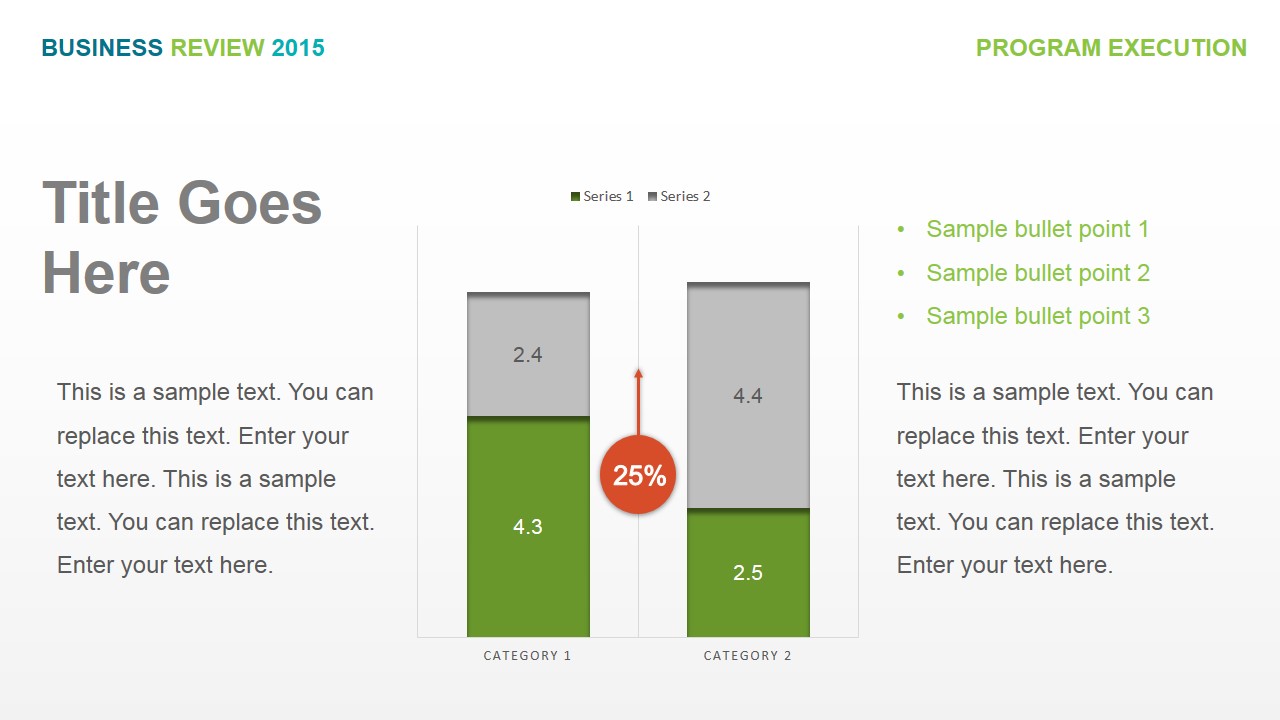
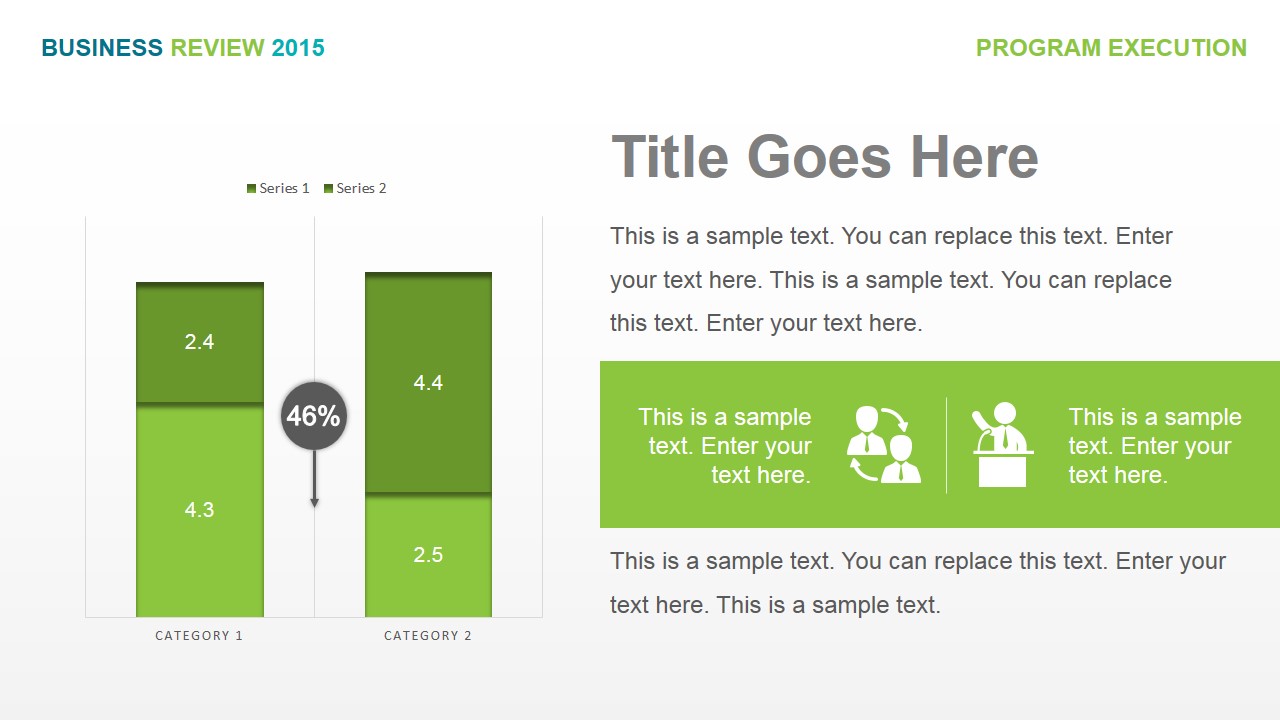
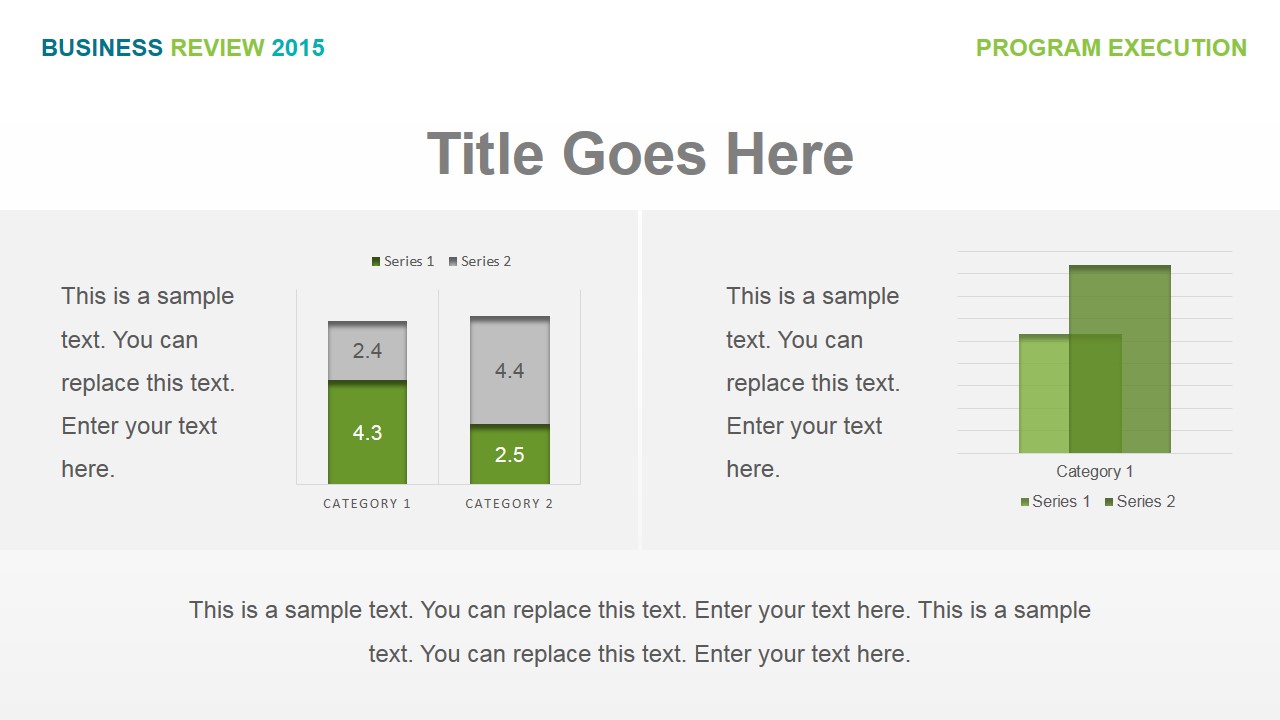
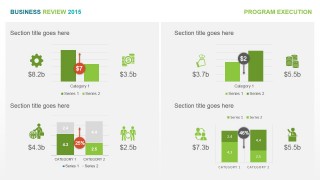
- Program Execution: Every organization executes operations to deliver business. Under the Program Execution section of the Business Review the Operational Key Performance Indicators are reviewed against previous periods and it variation evaluated.
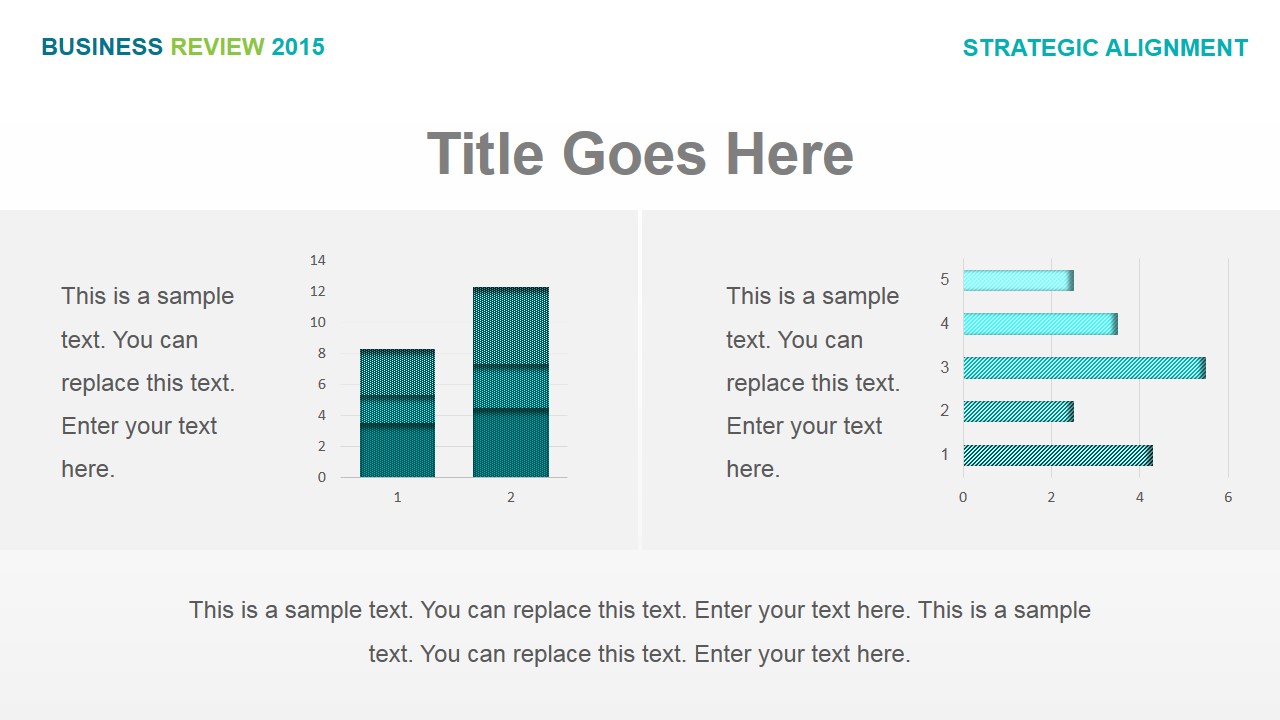
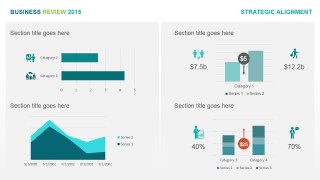
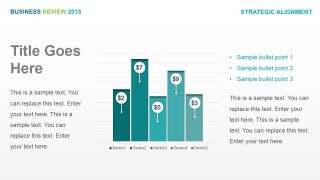
- Strategic Alignment: Every Mature Organization defines KPI’s for their strategic goals. The Strategic Alignment Section evaluates the current performance and projection of Strategic KPI’s.
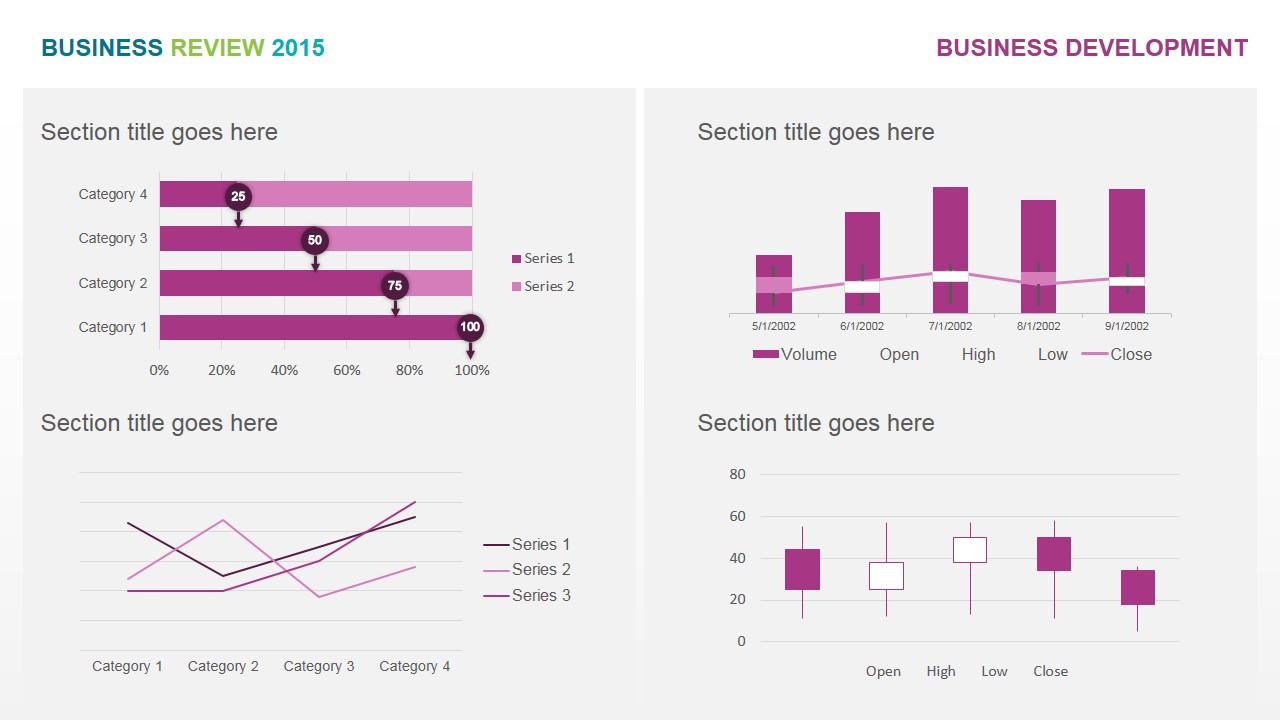
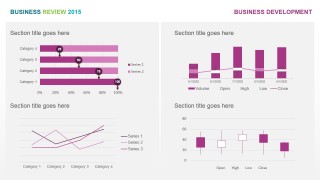
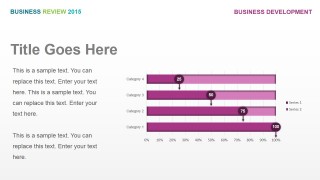
- Business Development: For profit organizations operate businesses. The Business Development section analyzes the Sales and Marketing KPI’s and their alignment with Strategic goals.
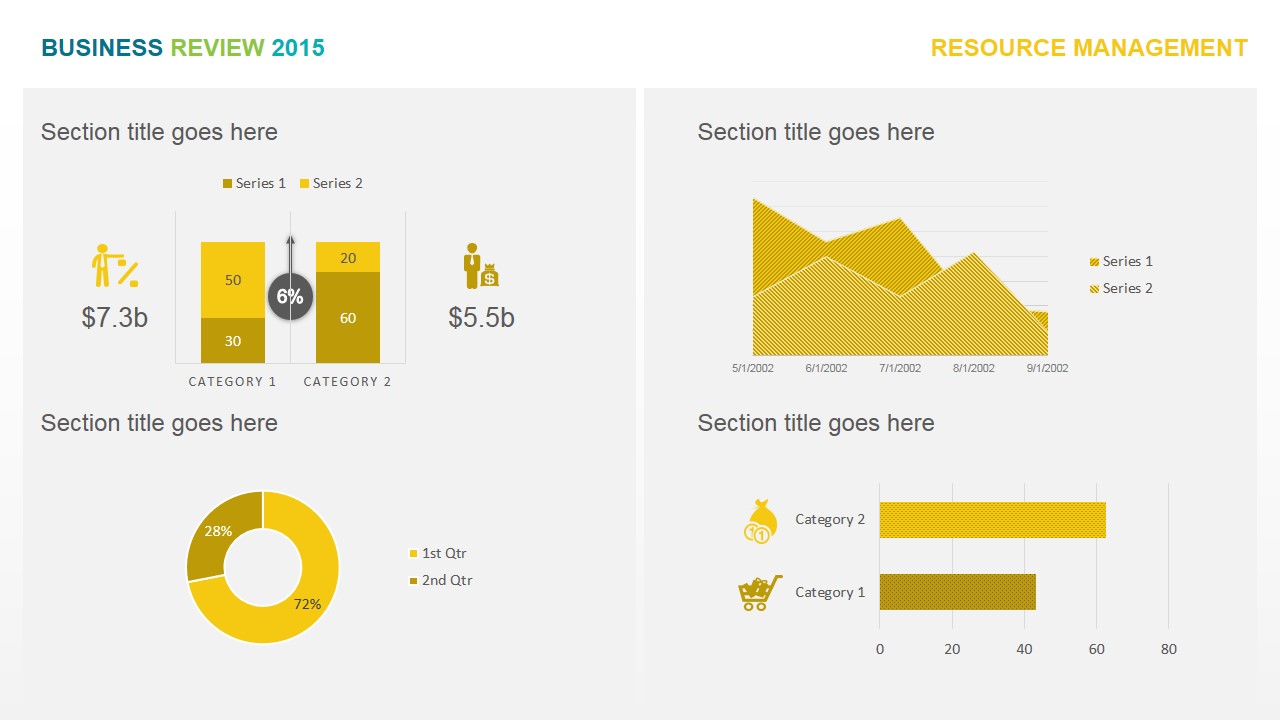
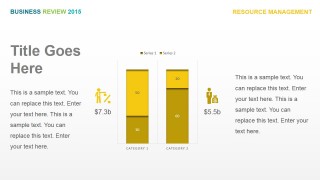
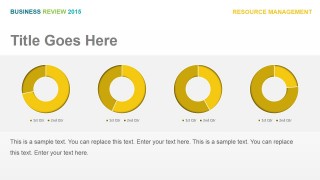
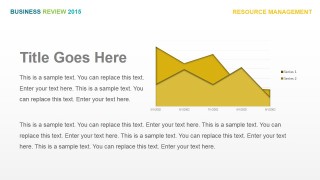
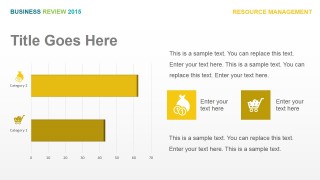
- Resource Management: Organizations Requires resources to execute. This section analyzes the utilization of financial resources and the management of human resources (people).
Business Review do not have special preconditions, but in order to execute the business review as a formal business practice, it is important to document the main business strategy, communicate the goals that need to be achieved to follow the strategy and how are they going to be measures. Organizations which implement Balanced Scorecard already execute this steps.
Our Business Review PowerPoint Template provides top of the line, 100% editable PowerPoint Charts and vector to create impressive infographics. This representations are ideal for summarizing strong numeric information. This business PowerPoint template can be used to prepare presentations related to Quarterly Business Review (QBR).
Impress your audience and create professional decks with our Business Review PowerPoint Template.
What’s inside this template
Example presentation scenarios
- A CEO or general manager can use the contents slide and four section dividers to guide a board audience through quarterly performance by business area.
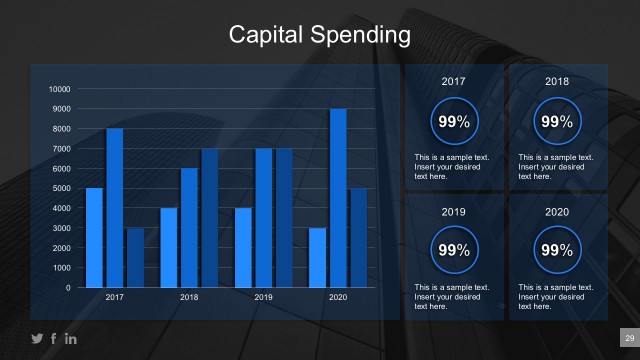
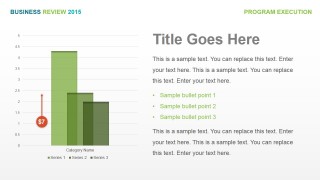
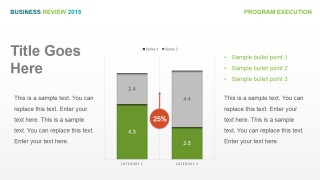
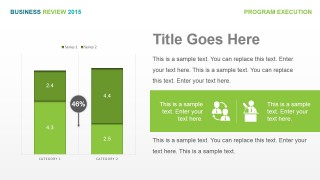
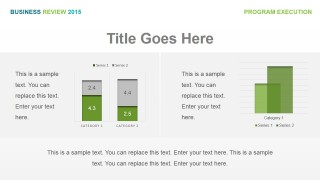
- A program manager can present execution status with the KPI dashboard, clustered column charts, and percentage markers to compare current outcomes against targets.
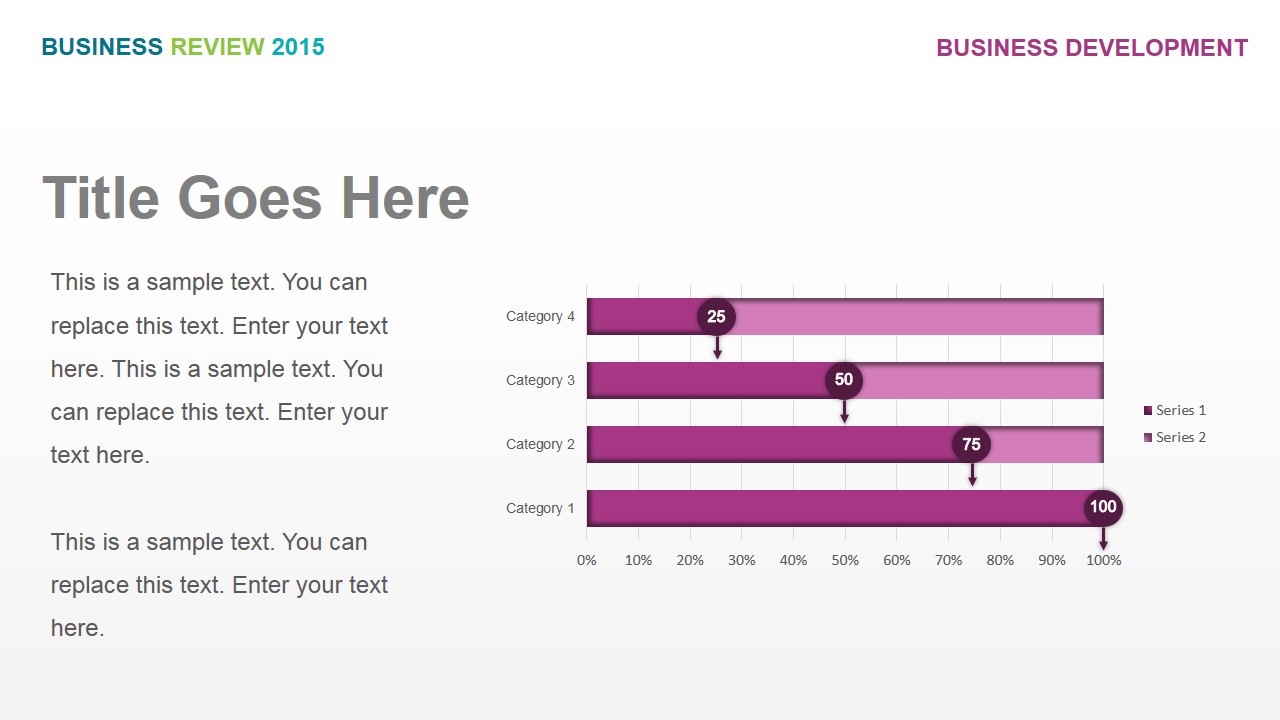
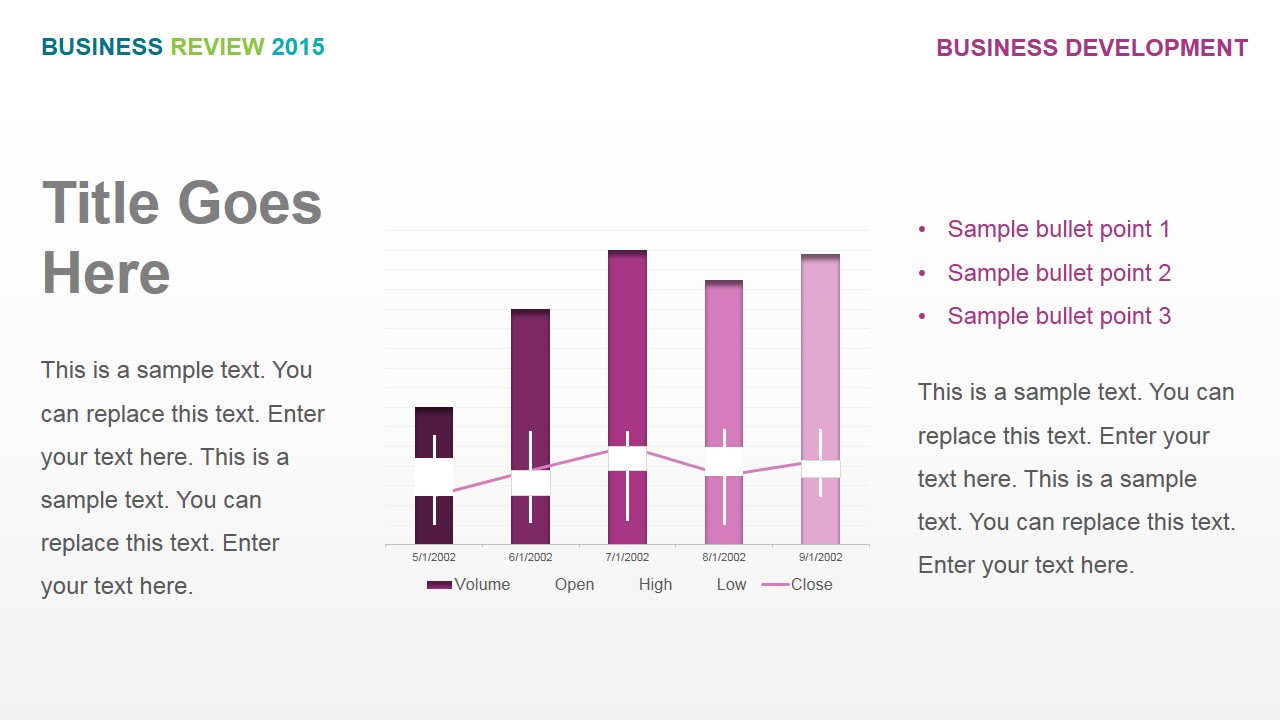
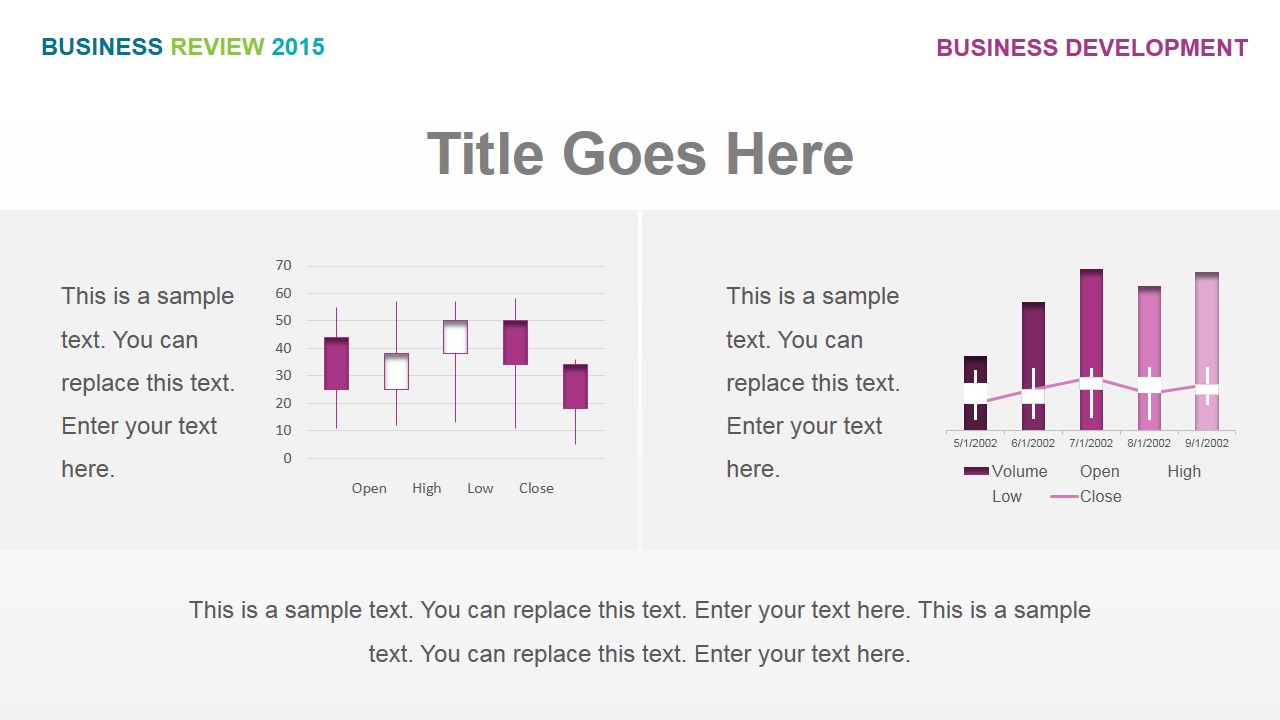
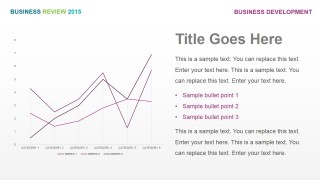
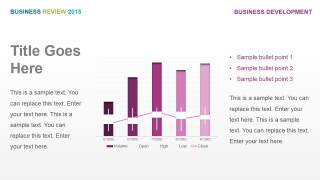
- A sales or marketing leader can explain pipeline and market activity with the business development line chart, progress bars, and column-line chart.
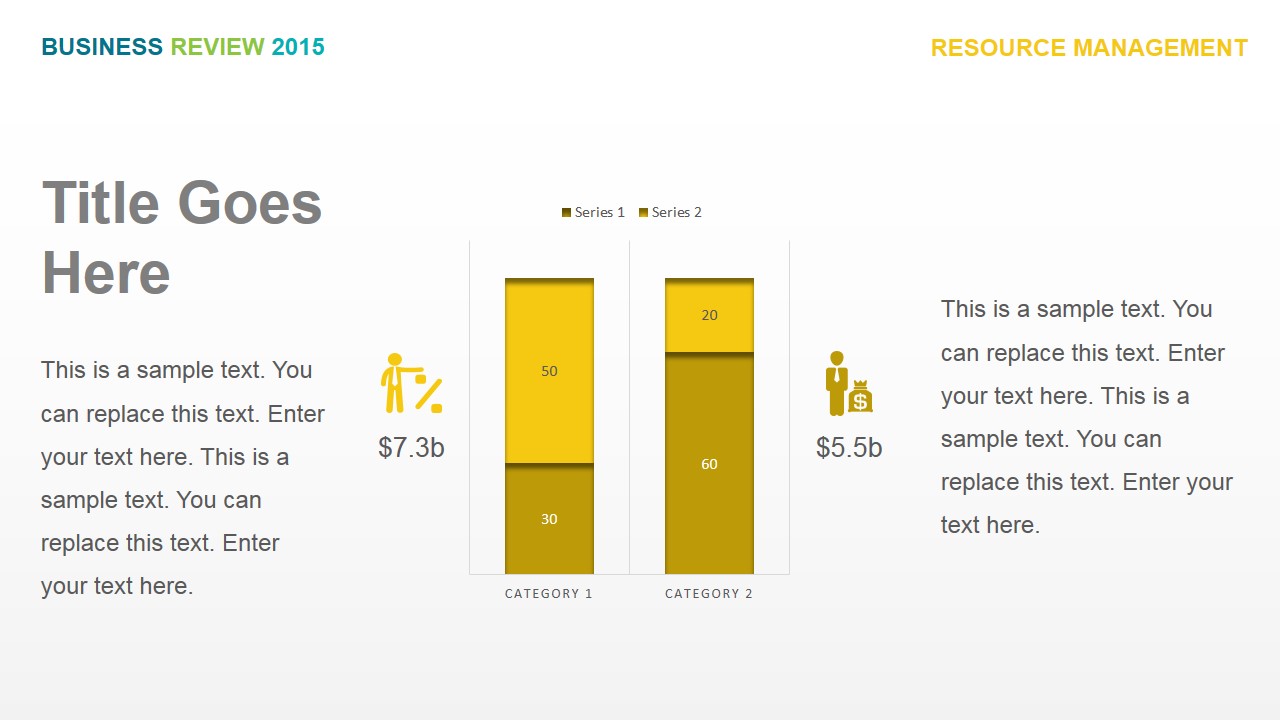
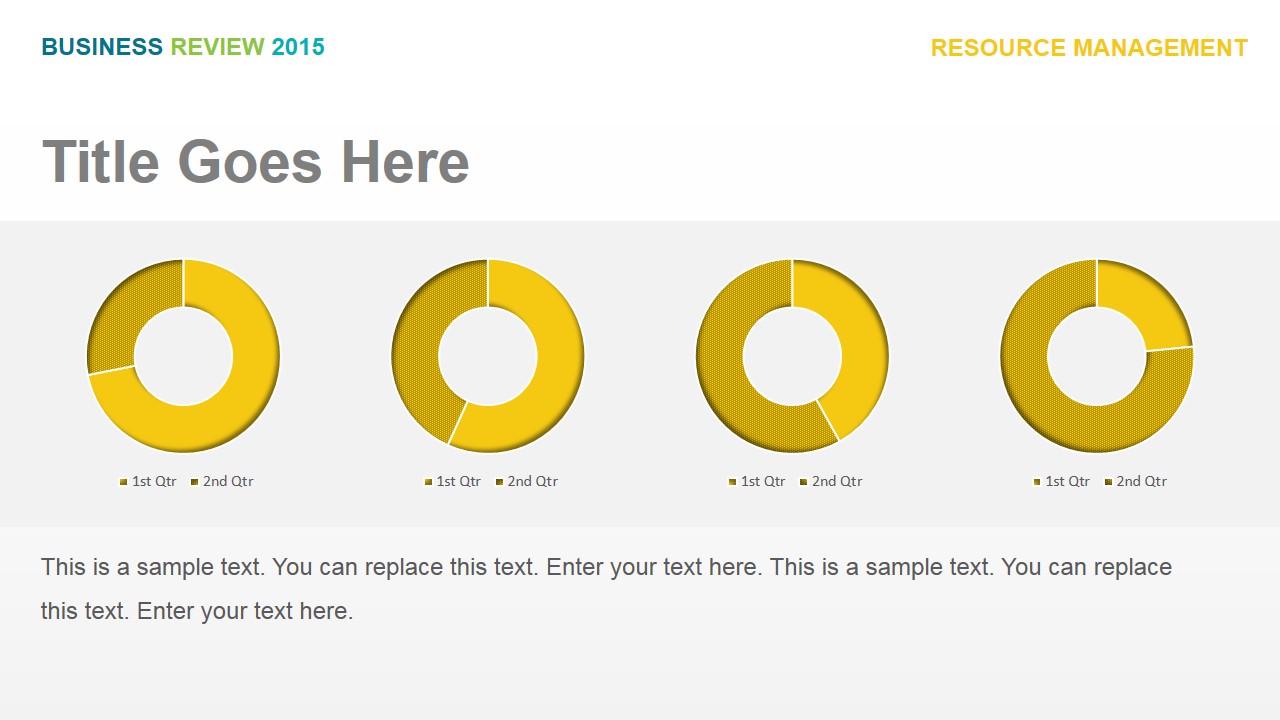
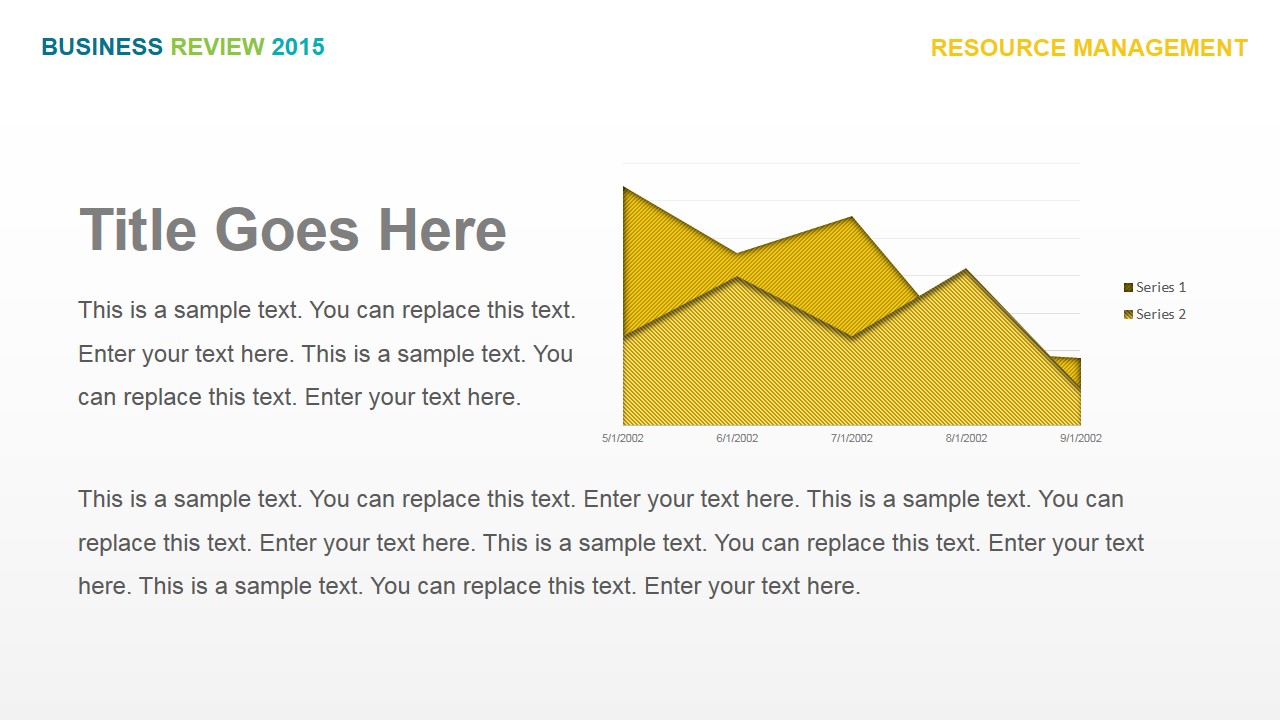
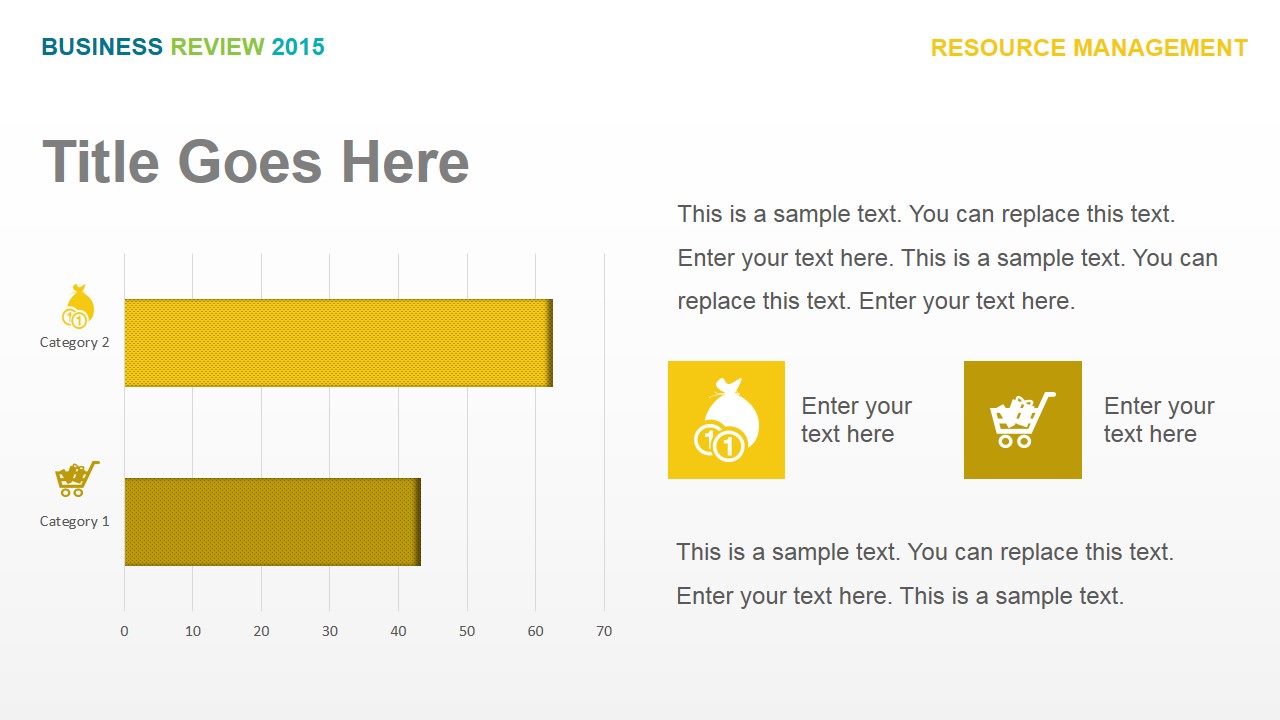
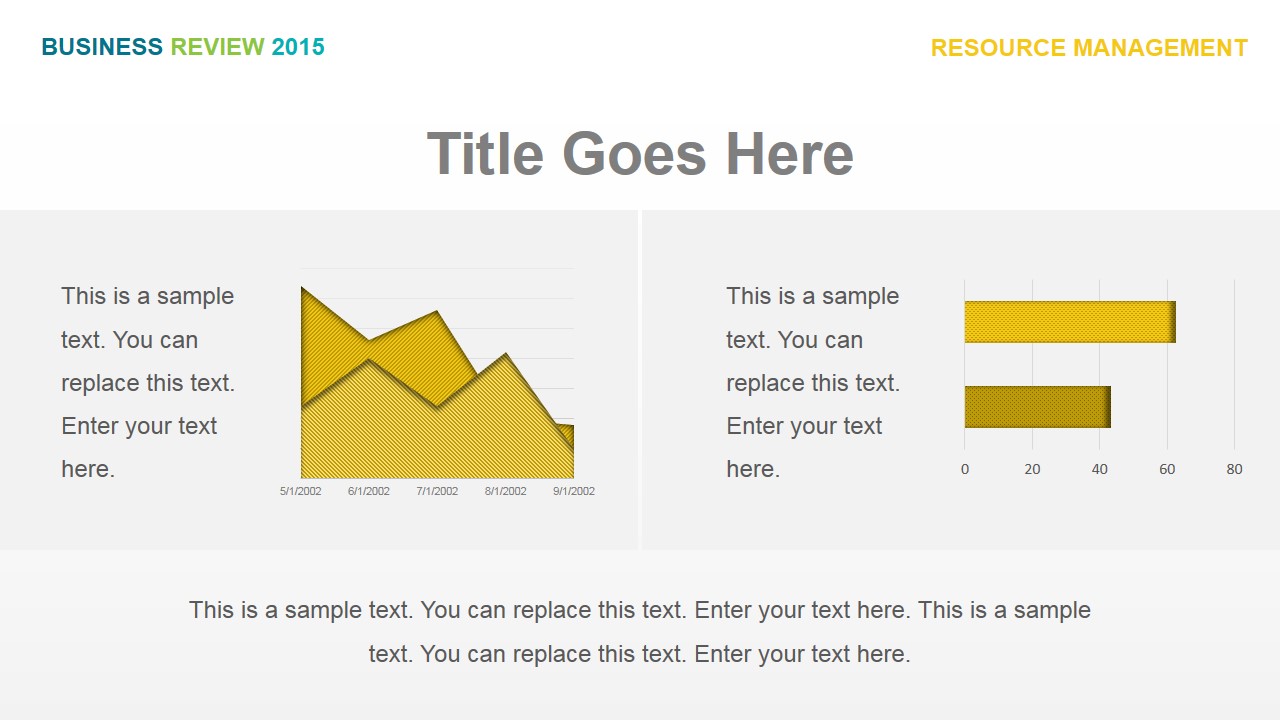
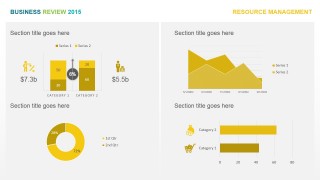
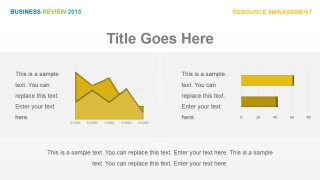
- A finance or operations manager can review resource allocation with the resource management donut charts, stacked columns, and area chart.
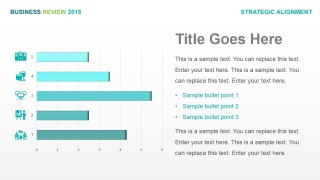
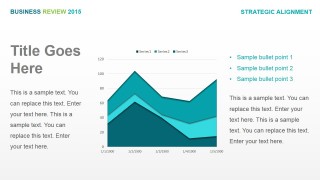
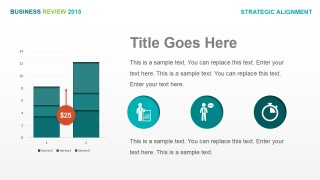
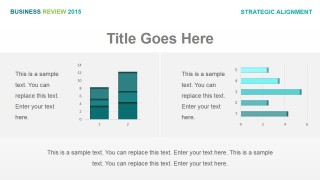
- A strategy team can use the strategic alignment section to connect goals with KPI movement using horizontal bars, stacked area charts, and icon-supported metrics.
Features
- 100% editable presentation template
- Compatible with Microsoft PowerPoint
- 16:9 aspect ratio slides
- Scalable vector shapes, icons and illustrations
- AI-Ready for Microsoft Copilot and Claude
- Instant access and download
Frequently asked questions
Q: How should a presenter structure the business review so the audience does not get lost in the metrics?
A: Start with the contents slide to name the four review areas, then use each section divider as a reset point. Within each section, lead with the dashboard-style slide before moving into single-chart slides. This sequence helps executives see the headline first, then inspect supporting bar, line, area, or donut charts as needed.
Q: Who is this template best suited for, and what type of business message does it support?
A: It is best suited for executives, program managers, sales leaders, finance managers, and operations teams who need to report performance across several business areas. The visible layouts support a fact-based review: program execution metrics, strategic alignment indicators, business development trends, and resource management figures.
Q: Why does the deck use section photography alongside KPI dashboards and charts?
A: The photography acts as a visual chapter break, while the dashboards and charts carry the analytical message. This design separates orientation from evidence: photo dividers signal a new business theme, and the following KPI pages use repeated chart structures so the audience can compare sections without relearning the slide design.


















Business Review PowerPoint Template
31-slide business review presentation template with KPI dashboards, section dividers, and performance charts
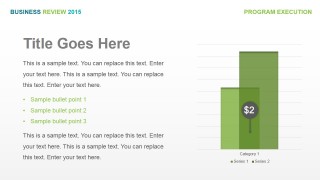
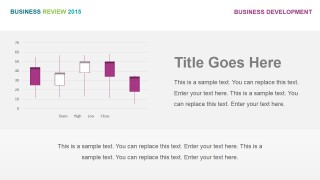
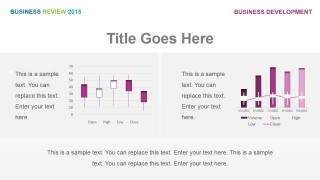
Business Review PowerPoint Template is a 31-slide Microsoft PowerPoint deck for quarterly and annual reviews. It includes a contents slide, KPI dashboard pages, section dividers, bar charts, line charts, area charts, donut charts, and business performance layouts for executives, managers, sales teams, and program leaders.
- Category
- Business PowerPoint Templates
- Rating


 Loading...
- Aspect ratio
- 16:9, 4:3
- Item ID
- 4119-01
- Colors
 Microsoft PowerPoint
  Microsoft Copilot
  Claude for PowerPoint
 Other formats supported
Subscribe today and get immediate
access to download our PowerPoint templates.