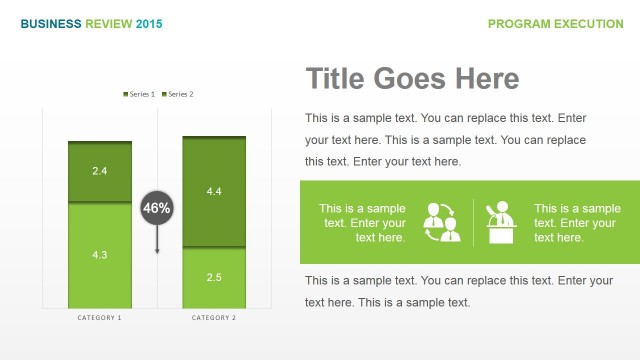
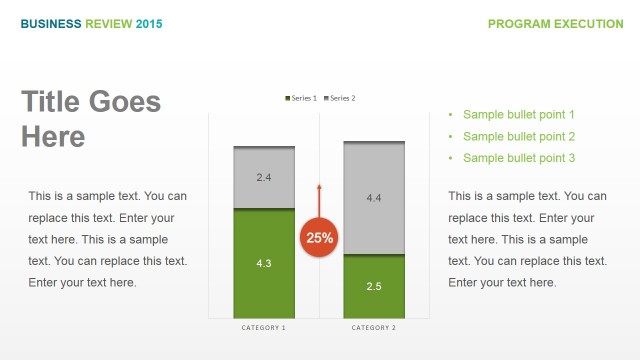
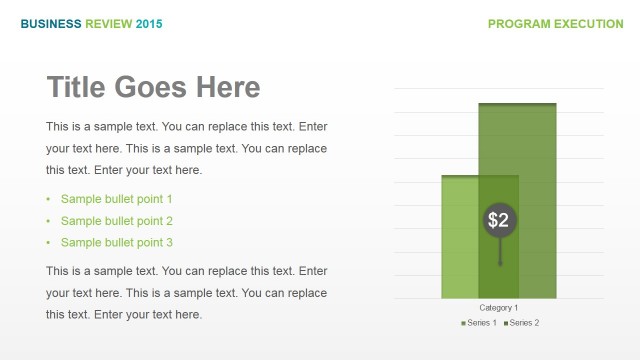
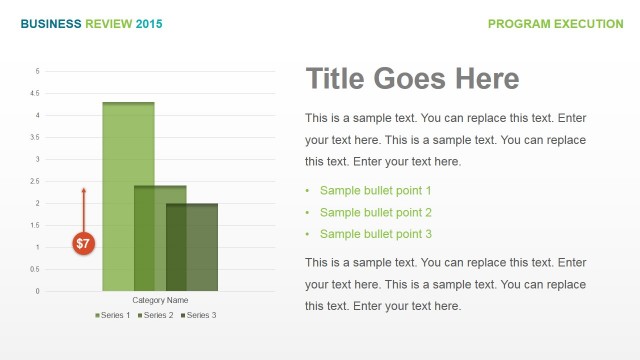
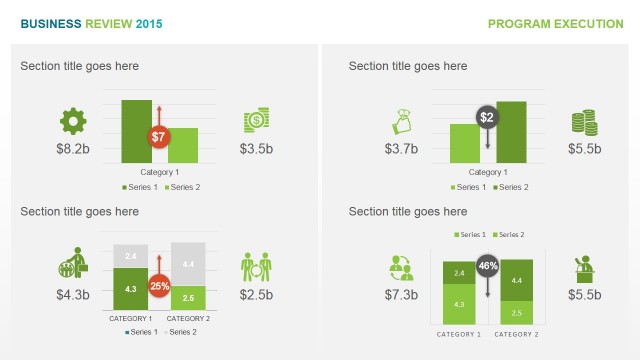
KPI Comparison Over Two Dimensions
Shown on the PowerPoint design is a KPI comparison over two dimensions, that is, a set of financial information and statistics may be shown in two different forms, for further analysis. The information may range from production volumes to annual product sales.
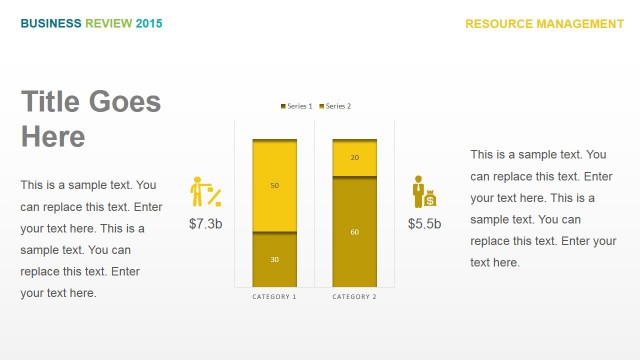
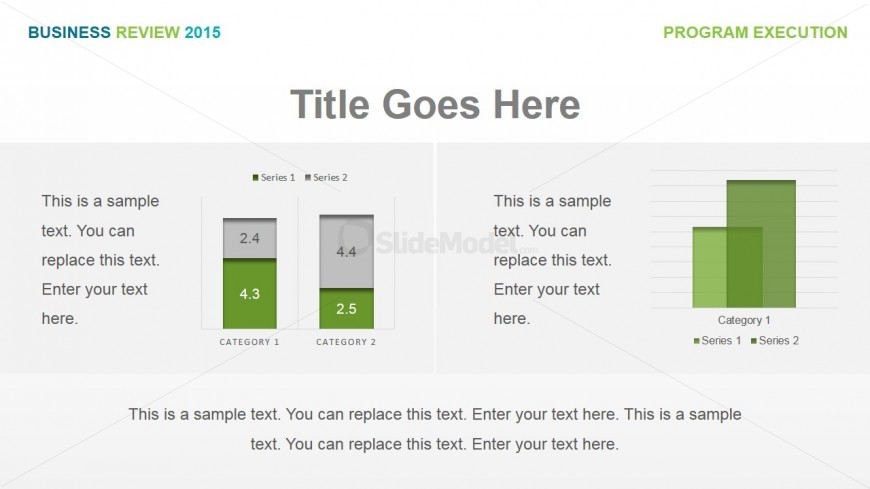
A light gray PowerPoint shape may be found at the center of the slide design, which contains two graph, a stacked column chart and a comparison column chart with overlapping bars. Each bar is accompanied by a text placeholder where a discussion of the data may be inserted. Below the diagrams is a text placeholder where a summary of the presented information may be placed. The title may be placed in the placeholder found above the PowerPoint shape. All PowerPoint objects are 100% customizable to fit the presenter’s needs and preferences.
Return to Business Review PowerPoint Template.