Two Chars Comparison of Strategy KPIs
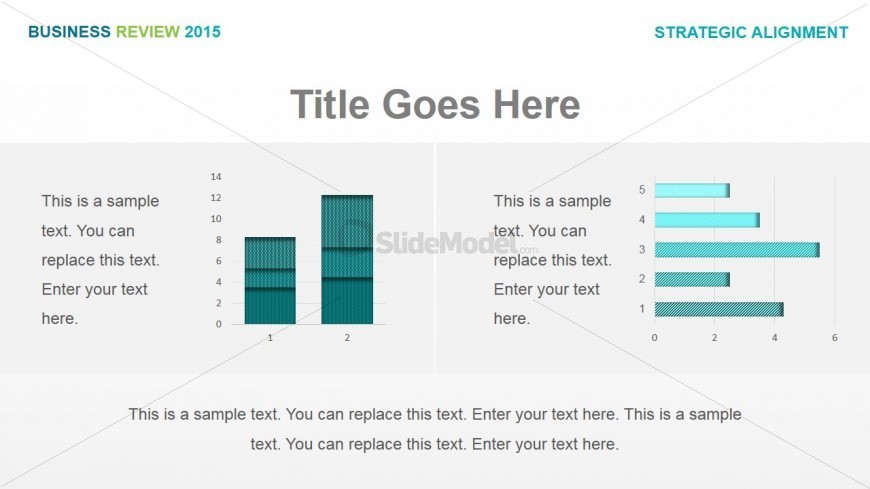
The two charts comparison for PowerPoint found on the slide design may be used to show two different sets of data for a specific business statistic, for purposes of discussion during a marketing presentation to key members of the business organization. The information to be presented may be related to the key performance indicators established by the company, and thus, may be utilized by human resource departments and upper level management to monitor the performance of their employees and stocks.
The PowerPoint slide contains two charts, a column hart and a bar chart. Both of which are found in a cyan color scheme, and have corresponding text placeholders where descriptions may be inserted. The title for the PowerPoint template may be inserted in the text placeholder found above the diagrams. The summary of information found in the Office template may be inserted in the text placeholder located below the two graphs. All PowerPoint objects are 100% editable to fit the presenter’s preferences and needs.
Return to Business Review PowerPoint Template.