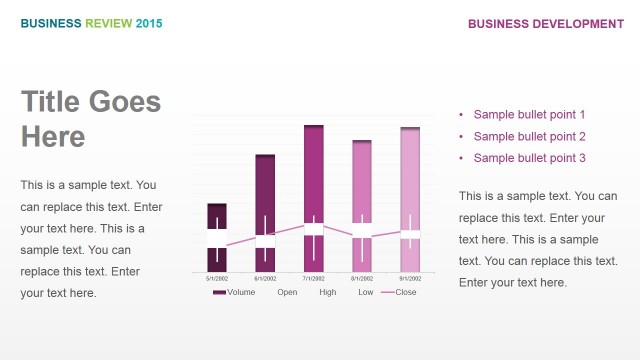
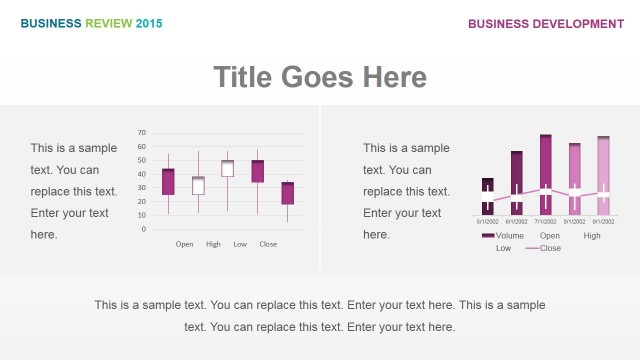
Price Variation vs Volume of Sales
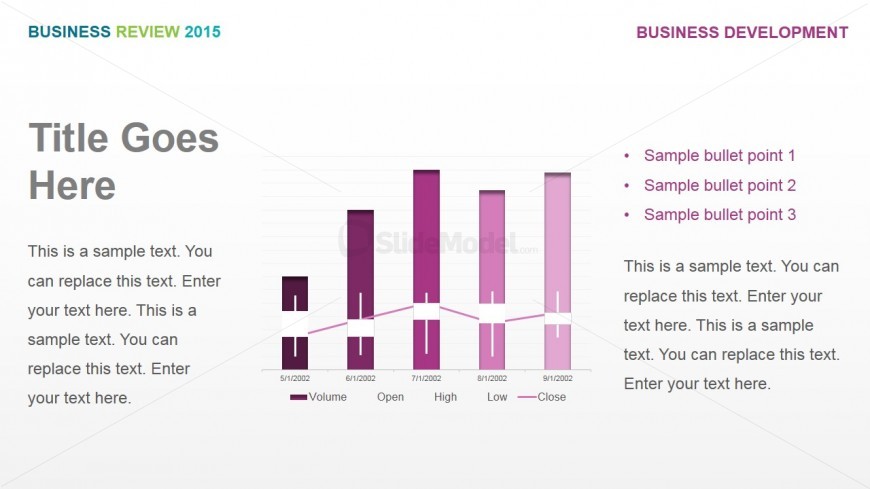
The PowerPoint candle chart with price variation vs volume of sales found on this slide design may be used to show the distinct relationship of the two elements as shown in the span of five fiscal periods. The information found on this PowerPoint template may be utilized in making financial decisions concerning selling prices and future marketing strategies.
The candle graph is shown with bars of different shades of violet and corresponding text placeholders for labels and legends. On one side of the PowerPoint graphic is a text placeholder where the title and descriptions may be inserted, while other relevant information, such as statistics and key details, may be placed in the other text placeholder to the right of the candle chart. All PowerPoint objects are 100% customizable to suit the presenter’s needs and preferences.
Return to Business Review PowerPoint Template.