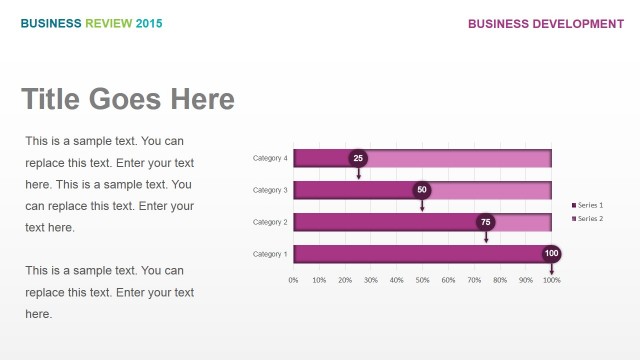
Quota Achievement by Product and Services

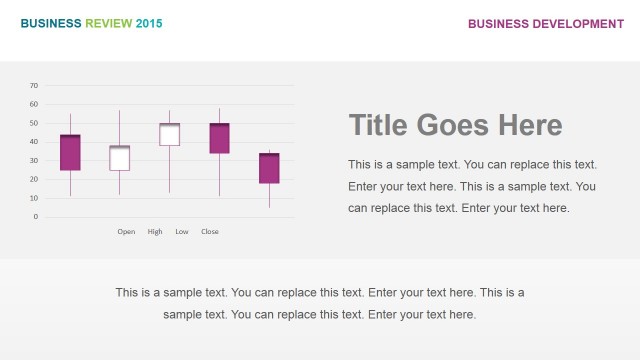
The slide design features a bar graph PowerPoint graphic which may be used to show quota achievement by products and services. The graph may be used to show statistical data containing the respective sales reached by four different marketing teams, as presented in the degree to which they have reached their established quotas.
The bar graph is found dominating the right side of the PowerPoint slide. It is shown in a violet color scheme, and has corresponding text placeholders for the labels of the axes and the legend. The title and the appropriate explanations and discussions may be inserted in the text placeholders found beside the bar graph. The PowerPoint objects are 100% customizable to suit the presenter’s needs and preferences.
Return to Business Review PowerPoint Template.