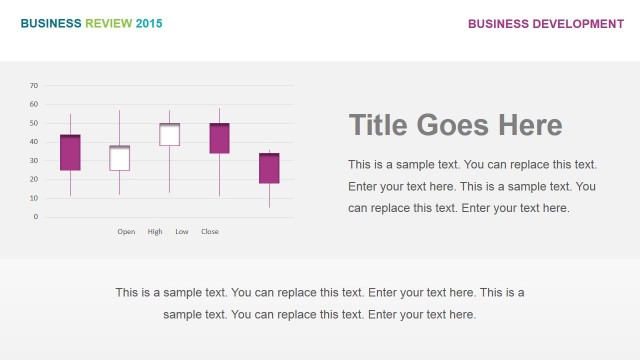
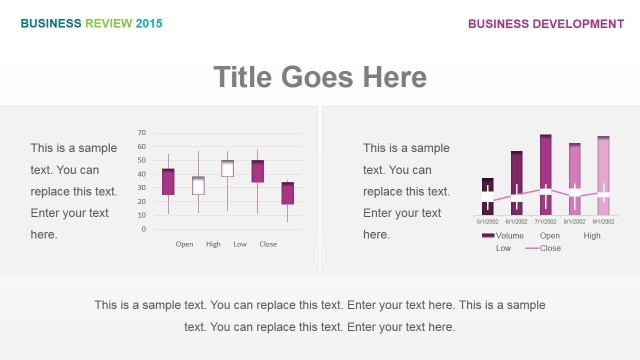
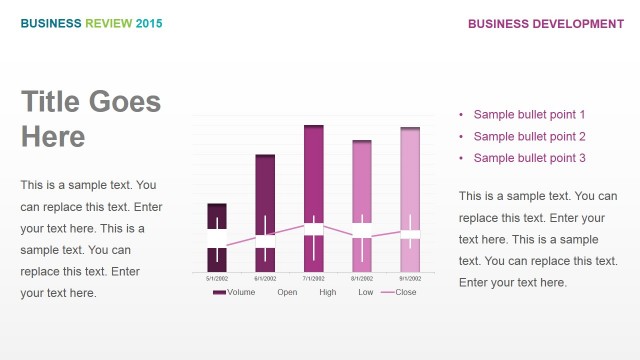
Prices Variation Per Period

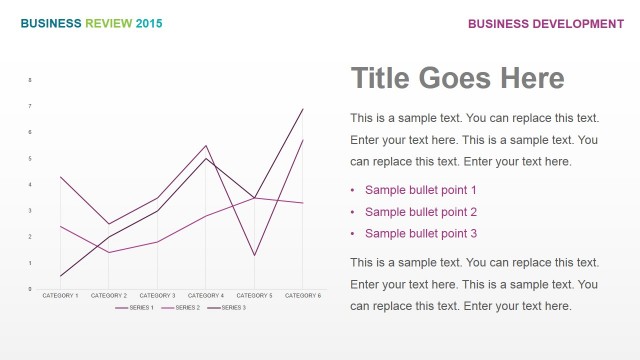
The slide design features a candle chart showing price variations per period, which may be used to emphasize the open, high, low, and close values of the price data in the market environment. The price movements shown on the PowerPoint slide may be used in business decisions such as the expansion or contraction of factory production, in relation to the behavior of prices.
The candle chart is shown near the top of the PowerPoint template in violet and white, and is found next to a set of text placeholders where the title and description may be inserted. A text placeholder found below the diagram may be inserted with the summary or explanation for the Office template. All PowerPoint objects are 100% customizable to suit the presenter’s needs and preferences.
Return to Business Review PowerPoint Template.