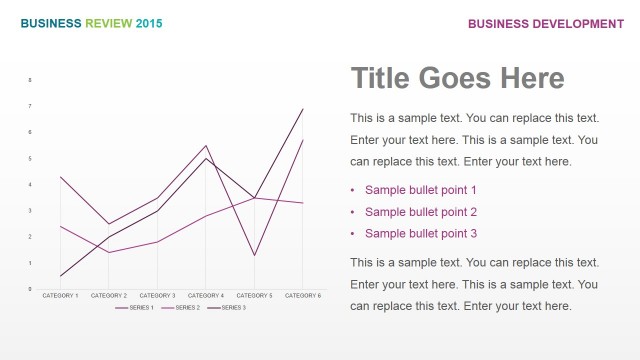
Period Sales Performance By Product

The PowerPoint design may be used to show period sales performance by product as shown on a line chart. It may be utilized so as to easily compare the growth and decline of their corresponding sales volume, so that the company management can make effective business decisions for the improvement of the organization.
The slide design features a line chart, colored in different shades of violet, with text placeholders for the labels of the x-axis and the legend. The title, and other related information may be inserted in the text placeholders found beside the PowerPoint graphic. The bulleted list, highlighted in violet, may be inserted with key points that the presenter wishes to emphasize in the business organization. All PowerPoint objects are 100% customizable to suit the presenter’s needs and preferences.
Return to Business Review PowerPoint Template.