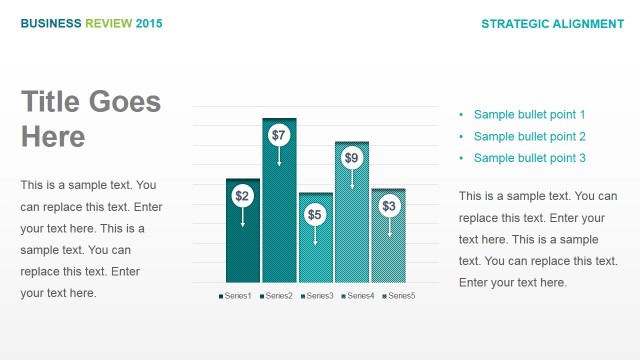
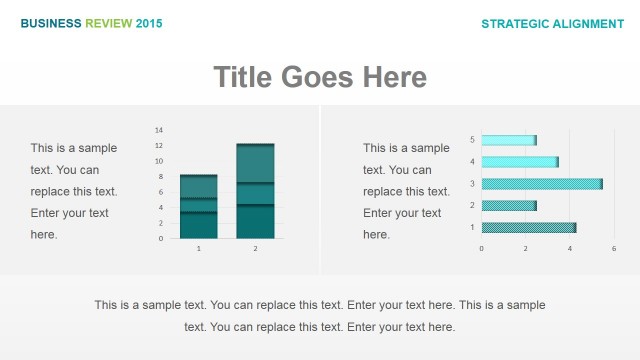
Stacked Area Chart of Strategic Goals Fluctuations
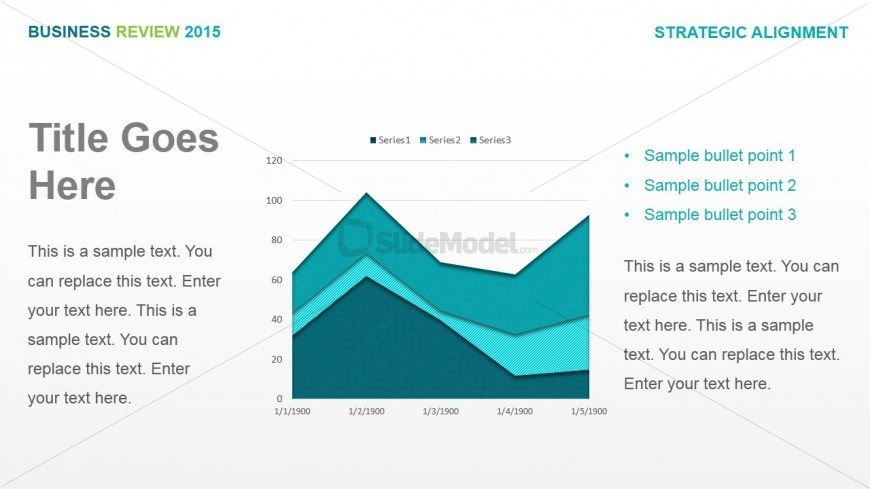
The stacked area chart of strategic goals fluctuations shown on this PowerPoint slide may be used to show different business statistics such as production volume and sales, across several periods. The PowerPoint template may be used in presentations which emphasize key business decisions for the improvement of company practices.
The PowerPoint graphic is found at the center of the slide design, in different shades of blue. The area chart also has text placeholders to be inserted with labels for the axes and legend. Flanking the chart are two sets of text placeholders, which may be inserted with the title, additional information, and a corresponding explanation for improved clarity of presentation. The PowerPoint objects are 100% customizable to suit the presenter’s needs and preferences.
Return to Business Review PowerPoint Template.