Stacked Column Chart Infographic
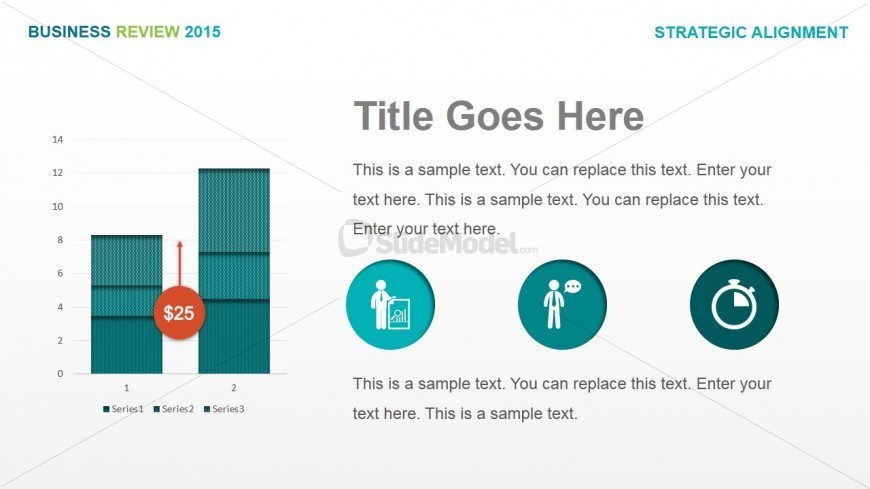
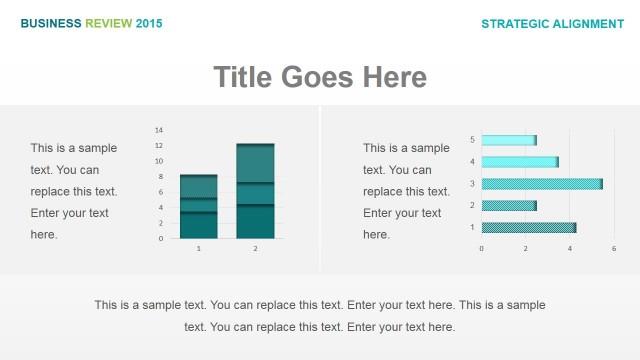
Located on the PowerPoint template is a stacked column chart infographic which may be used to show important business statistics concerning two different sets of data, for purposes of deliberation. The PowerPoint slide may be utilized in business presentations involving updating key members of the business organization on the current state of the company performance so that they may be able to act accordingly.
The stacked column chart is found on the left side of the PowerPoint slide, colored in shades of cyan. To the right of this, is a set of text placeholders where the title and discussions may be inserted. There are also three generic business icons, representing people and a stopwatch, which may be used as helpful visual aids to the discussion. The PowerPoint objects may be modified to suit the presenter’s needs and preferences as they are 100% customizable.
Return to Business Review PowerPoint Template.