Resource Management Performance Indicators
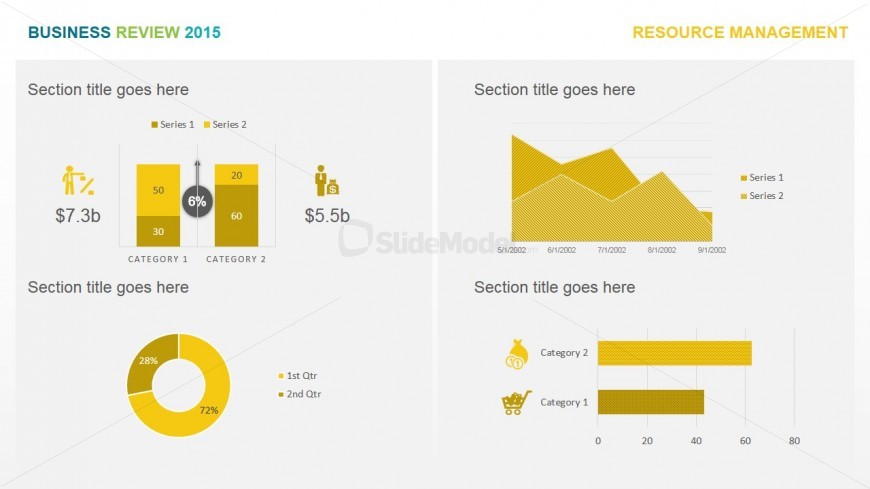
Featured on the slide design are resource management performance indicators for PowerPoint, which may be used to show a set of financial statistics concerning key business elements. These statistics may be utilized to show the corresponding performances of data such as sales, production volume and employee turnover, which are helpful in determining future business decisions.
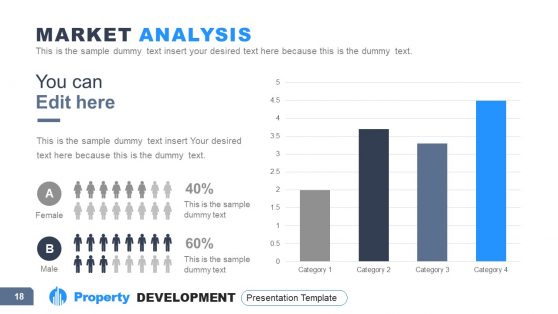
The PowerPoint slide contains four different graphs such as a column chart, a donut diagram, an area chart, and a bar graph. All of the charts have a yellow color scheme and corresponding text placeholders for section titles, axes labels, and legends. The PowerPoint objects are 100% editable to fit the presenter’s needs and preferences.
Return to Business Review PowerPoint Template.
Download unlimited PowerPoint templates, charts and graphics for your presentations with our annual plan.
DOWNLOADReturn to Business Review PowerPoint Template.
