Professionals who work with technical documentation often rely on Mermaid.js to produce structured visuals from plain text. The library converts a lightweight, Markdown-compatible syntax into flowcharts, sequence diagrams, Gantt charts, class diagrams, and a range of other diagram types, all without opening a drawing application. For developers, architects, and analysts, this removes the friction of maintaining diagrams separately from the documents that describe them.
The challenge arises when those diagrams need to appear in a PowerPoint presentation. Microsoft Office does not include a Mermaid renderer, which means the syntax cannot be pasted into a slide and is expected to display a visual. To bring a Mermaid diagram into PowerPoint, a conversion step is required: either export the rendered image and insert it as a static file, or rebuild the structure using PowerPoint’s native drawing tools when the slide needs to remain editable by colleagues.
This article walks through both approaches in detail. It covers the full range of Mermaid diagram types, from flowcharts and sequence diagrams to ER diagrams, Gantt charts, Git graphs, and user journey maps, and explains how each translates to a presentation context. It also covers diagram types that fall outside Mermaid’s direct scope but are frequently needed in business presentations, including swimlane diagrams, WBS charts, Wardley maps, and Ishikawa diagrams. Format choices between SVG and PNG are addressed, along with practical guidance for keeping exported diagrams legible and presentation-ready.
What Are Mermaid Diagrams?
Mermaid is an open-source JavaScript library that parses text written in a lightweight syntax and renders it as SVG output in the browser. The project has broad adoption across developer tooling platforms, including GitHub, GitLab, Notion, Jira, and Confluence, all of which natively support Mermaid code blocks. Writing a diagram in Mermaid means writing structured text that can be stored in a repository, reviewed in a pull request, and updated in any text editor.
The syntax is intentionally readable without rendering. A flowchart reads as a series of labeled arrows connecting named nodes. A Gantt chart presents a structured list of tasks, with date ranges assigned to sections. This readability makes Mermaid well suited to documentation workflows where diagrams need to stay in sync with the specifications they accompany, since a diagram update is simply a text edit rather than a round-trip to a drawing application. The code below produces a three-step approval flow with a yes/no decision:
flowchart LR
    A[Submit Draft] --> B{Approved?}
    B -- Yes --> C[Publish]
    B -- No --> D[Revise]
For presentation purposes, the important thing to understand is what Mermaid produces as output: clean, scalable vector graphics rendered in the browser. The rendering quality is consistent and professional, and the diagrams can represent processes, data structures, timelines, and system interactions with appropriate precision. Business users who receive technical documentation may encounter Mermaid diagrams without recognizing them as such. A process chart in a requirements document, a data flow in a system specification, or a timeline in a project brief may all have originated from Mermaid syntax. Understanding that origin matters because it means the source is accessible and changes can be made by editing a few lines of text rather than redrawing the entire visual.
Why PowerPoint Cannot Render Mermaid Natively
PowerPoint is designed to display static content: text, images, shapes, charts generated from spreadsheet data, and embedded objects. It does not run JavaScript, and without a JavaScript runtime, the Mermaid library cannot execute. Pasting Mermaid syntax into a text box on a slide produces exactly that: a block of unformatted code text, not a rendered diagram.
This limitation applies to all versions of PowerPoint, including the desktop application and the web version available in Microsoft 365. Third-party add-ins exist for some diagramming tools, such as Lucidchart and draw.io, but there is no widely adopted plugin that converts Mermaid syntax directly into rendered diagrams inside PowerPoint. The closest available option for teams that want to keep diagrams in Mermaid is to establish a consistent export workflow rather than search for an in-application solution.
The practical consequence is that any Mermaid diagram must be converted to an image before it can appear in a slide deck. The two formats that matter for this purpose are PNG and SVG. PNG is a raster format, meaning its quality is fixed to the export resolution. SVG is a vector format, meaning it scales without quality loss at any slide size or projection scale. Both can be inserted into PowerPoint, but they behave differently in ways that matter for professional presentations, a distinction covered in detail later in this article.
Workflows for Bringing Mermaid Diagrams into PowerPoint
For anyone working with mermaid diagrams in PowerPoint, two distinct workflows apply depending on whether the goal is to display the diagram as quickly as possible or to maintain a version that colleagues can edit directly inside the presentation file. The right choice depends on who will maintain the slide, how often the diagram changes, and whether visual editability within PowerPoint is required.
Exporting from a Mermaid Rendering Tool
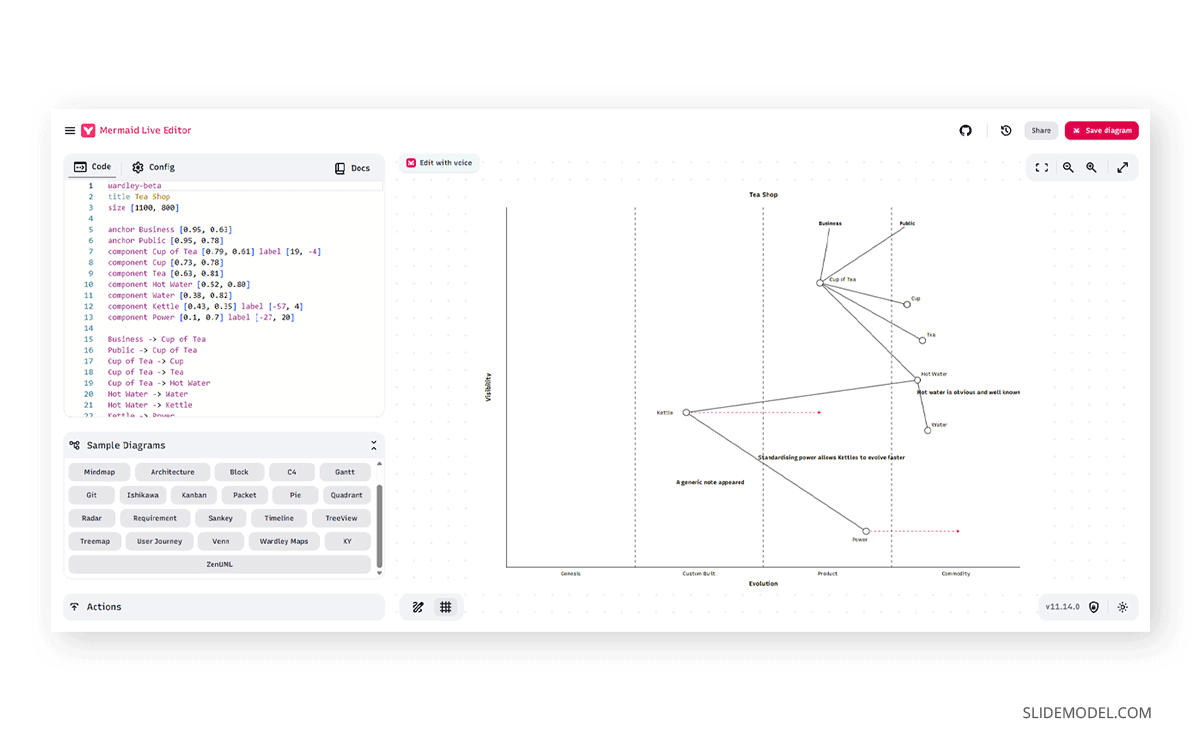
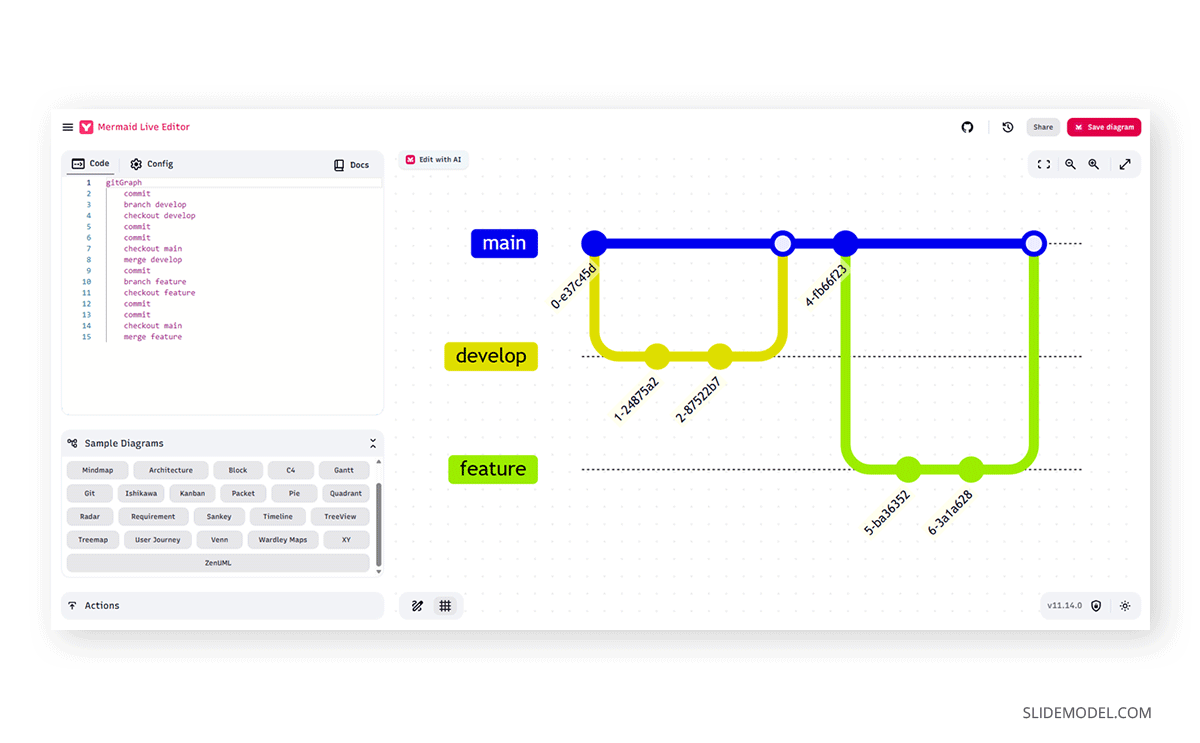
The most straightforward path from Mermaid source to PowerPoint slide goes through a web-based rendering tool. The Mermaid Live editor is the official open-source tool maintained by the Mermaid project team. It provides a split-panel interface: Mermaid syntax on the left and the rendered diagram on the right, both updating in real time as the code changes. The tool supports exporting diagrams in both PNG and SVG formats via a download button in the interface.
To use it, paste the diagram syntax into the editor, review the rendering for accuracy, and export the file in the desired format. For professional presentations, SVG is the preferred format because it produces a clean, scalable output that remains sharp at any slide size. A screenshot taken directly from the browser is a workable alternative for draft slides, but for final presentations, the export function produces cleaner output with proper padding and consistent rendering settings.
The tool also supports sharing diagrams through a URL that encodes the current syntax. This is useful for teams collaborating on diagram content before a presentation is finalized, since the link opens the diagram in an editable state, allowing any team member to propose changes by modifying the syntax and sharing the updated URL.
Another workaround is to try it in LLM AI tools, like Claude or ChatGPT, which convert Mermaid.js syntax into an image format that can be pasted into PowerPoint. In case you aren’t familiar with the syntax, you can directly ask to generate the diagram using Mermaid and set the parameters you need to see in the diagram.
Inserting the Exported Diagram into PowerPoint
Once you have an exported PNG or SVG file, inserting it into PowerPoint follows the same process as inserting any image. Open the Insert tab, select Pictures, choose the file from your device, and PowerPoint places the image on the slide. From there, the image can be resized, repositioned, and cropped as needed.
SVG files inserted into PowerPoint behave as scalable objects. They can be resized without quality loss, which is a significant advantage when preparing slides for high-resolution displays or printed materials.
PNG files behave as standard raster images. The quality visible in the slide is the quality captured at export time. A PNG exported at low resolution may appear soft or pixelated when the slide is displayed at full screen on a large monitor or projector. If a PNG is the only available format, export at the highest resolution the tool offers and check the image at full-screen zoom before finalizing the slide. When resizing either format in PowerPoint, always use a corner handle rather than a side handle to preserve the original aspect ratio.
When a diagram needs to appear alongside text on the same slide, use PowerPoint’s two-column layout placeholder rather than free-floating the image over a text block. This keeps the content anchored to the slide grid and avoids the diagram shifting position if the presentation is opened on a different screen size or version of Office. For diagrams that will appear on multiple slides in a deck, group the image and any added annotations before copying them to other slides to ensure the layering stays intact.
Mermaid Diagram Types and Their Use in Presentations
Mermaid supports a wide range of diagram types, each suited to different communication needs. Understanding which type to use and how to present it effectively is as important as the export process itself. The sections below address each diagram type, what it communicates, and how it translates to a PowerPoint slide context.
Flowcharts and Operational Flow Charts
Flowcharts are the most commonly used diagram type in Mermaid and the most immediately recognizable in a business context. Mermaid flowcharts use nodes and directed edges to represent steps, decisions, and outcomes, with support for multiple node shapes, including rectangles for processes, diamonds for decisions, and rounded rectangles for start and end points. The syntax also supports labeled edges that indicate the nature and direction of connections. Learning how to make a flowchart effectively is a foundational skill for any professional who needs to communicate process logic visually.

In presentations, flowcharts are well-suited for explaining processes, decision trees, and approval workflows. An operational flow chart might map the steps a support team follows when handling an escalated case, from initial triage through resolution and closure. A decision tree might guide the audience through a series of conditions to reach a recommended action or outcome.
When exporting Mermaid flowcharts for PowerPoint, pay attention to the diagram’s orientation. Mermaid supports top-down (TD) and left-right (LR) layouts. Left-right layouts tend to fit better in standard landscape slides because they use horizontal space more efficiently. For complex process chart examples with many decision points, a top-down layout may be more readable, but check that the diagram remains legible when scaled to fit within the slide boundaries. Diagrams that are clear in a browser window often become unreadable at slide scale if the labels are small or the layout is dense.
Sequence Diagrams for System Interactions
Sequence diagrams show how different systems, services, or actors interact over time. They use vertical lifelines representing each participant and horizontal arrows showing messages passed between them, arranged chronologically from top to bottom. In Mermaid, the syntax defines participants and messages in a few lines of code, and the renderer handles the layout automatically.
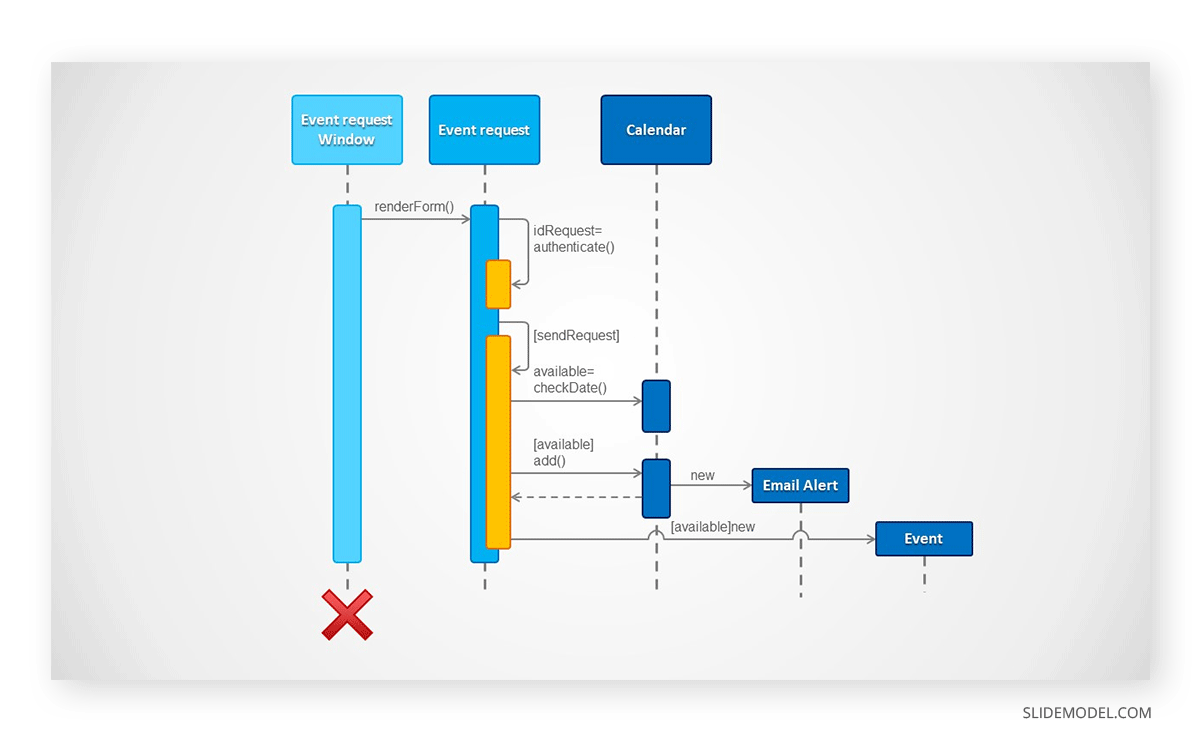
In a technical presentation, sequence diagrams are useful for explaining API calls, authentication flows, data exchange protocols, or any system-level process where the order of interactions matters. A diagram showing how a mobile application authenticates a user through an OAuth provider, for example, is far easier to communicate visually than through prose, and a properly exported Mermaid sequence diagram makes that communication precise without requiring the presenter to draw anything manually.
When presenting sequence diagrams in PowerPoint, the key challenge is label readability. Sequence diagrams with many participants and messages can become dense when scaled to fit a slide. Consider whether the full sequence should appear on one slide or be broken into stages across several slides, with each stage highlighting a specific part of the interaction, to better serve the audience. For executive audiences unfamiliar with sequence notation, a brief annotation layer added in PowerPoint can clarify the reading direction and the meaning of each arrow type.
Class Diagrams and Data Architecture
Class diagrams represent the structure of a system in terms of its objects, attributes, methods, and relationships. They originate in object-oriented software design but are used increasingly in business contexts to represent data models, system entities, and their associations. For a presentation on creating a data architecture diagram, class diagrams provide a precise, compact format that conveys structure without requiring the audience to read a full schema document.
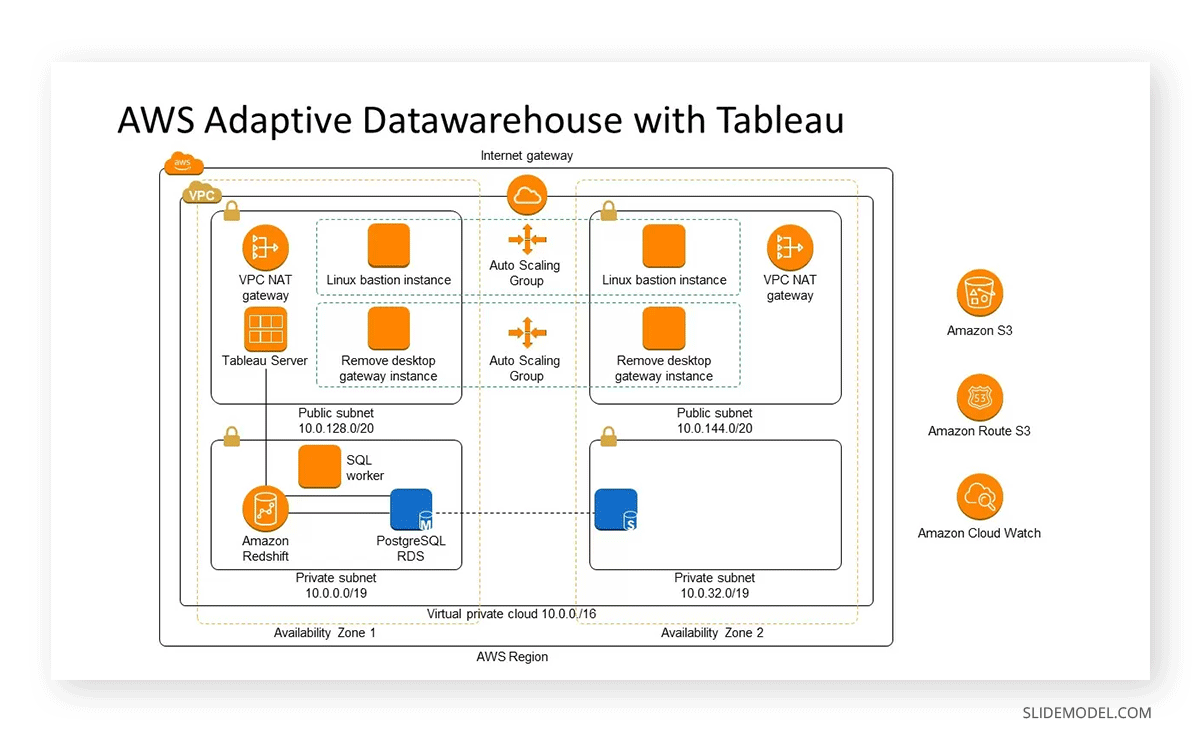
In Mermaid, class diagrams use notation that maps closely to UML conventions. Arrows represent inheritance, composition, and association. A class diagram for a customer data platform might include the Customer, Order, Product, and Subscription classes, with their attributes listed inside each box and relationship arrows connecting them. This gives a technical or executive audience a clear map of how data is organized.
When exporting class diagrams for use in PowerPoint, the diagram is usually detailed enough that SVG is the only appropriate format. The fine lines and small attribute labels in a class diagram will appear pixelated in a PNG when exported at standard screen resolution and then resized on the slide. SVG rendering ensures every element remains sharp regardless of how the image is scaled. For presentations that focus on how data moves between systems rather than how it is structured, a data flow diagram offers a complementary format that maps inputs, processes, and outputs across system boundaries.
State Diagrams and Entity-Relationship Diagrams
State diagrams capture how a system transitions between defined states in response to events. They are useful in presentations that explain the lifecycle of an object, a user session, an order, or any entity that passes through a defined series of conditions. A state diagram for a subscription service might show states such as active, pending cancellation, and canceled, with labeled transitions indicating what event triggers each change. Entity-relationship diagrams serve a related purpose in database and integration contexts, showing tables, their fields, and the relationships between them, including cardinality notation for one-to-one, one-to-many, and many-to-many relationships.
For a business audience, ER diagrams are most useful in presentations involving data migration, system integration, or database design reviews. A non-technical audience will generally need an explanation of the notation alongside the diagram, which should be factored into the slide design. Consider adding callout boxes or annotations directly in PowerPoint, layered on top of the exported SVG, to highlight the specific relationships or fields most relevant to the discussion.
Gantt Charts and Timelines
Gantt charts are among the most widely recognized diagram types in business presentations. They place project tasks on a timeline, making it straightforward to communicate scheduling, dependencies, and progress at a glance. Mermaid includes Gantt chart support with syntax that defines tasks by section, start date, and duration. Knowing how to make a Gantt chart in PowerPoint gives you the flexibility to choose between a static Mermaid export and a fully editable native version depending on how frequently the schedule changes.
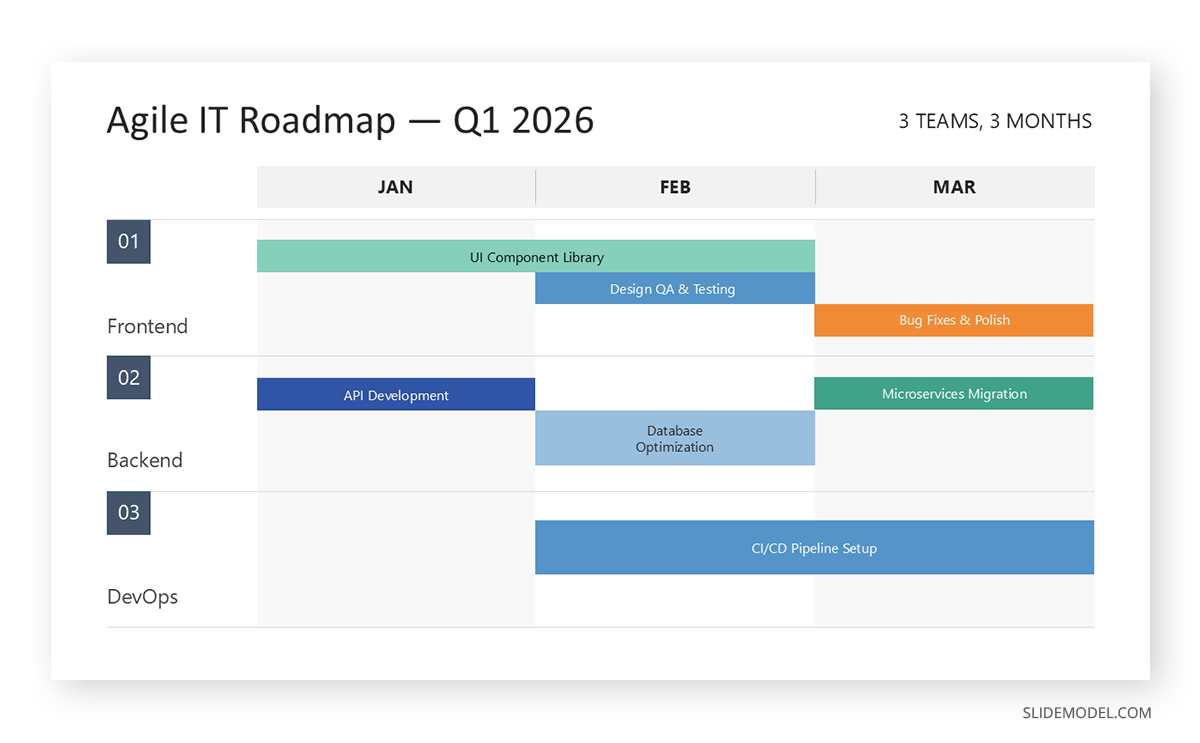
For project planning and status update presentations, a Mermaid-generated Gantt chart can be exported and inserted as a static image, which works well for progress reviews where the data is stable. The limitation is that the image version cannot be edited in PowerPoint, so any date changes or task additions require returning to the Mermaid source, re-exporting, and replacing the image on the slide. Teams that update schedules frequently should evaluate whether rebuilding the Gantt chart using PowerPoint’s native table or shape tools is more efficient in the long run.
A timeline is a simpler version of the same concept, showing key milestones and dates without task duration bars. Mermaid supports timeline diagrams with a dedicated syntax that assigns events to time periods. Timelines work particularly well in executive presentations where the audience needs to understand the sequence of major decisions or deliverables without the detail of a full project plan.
User Journey Maps and Pie Charts
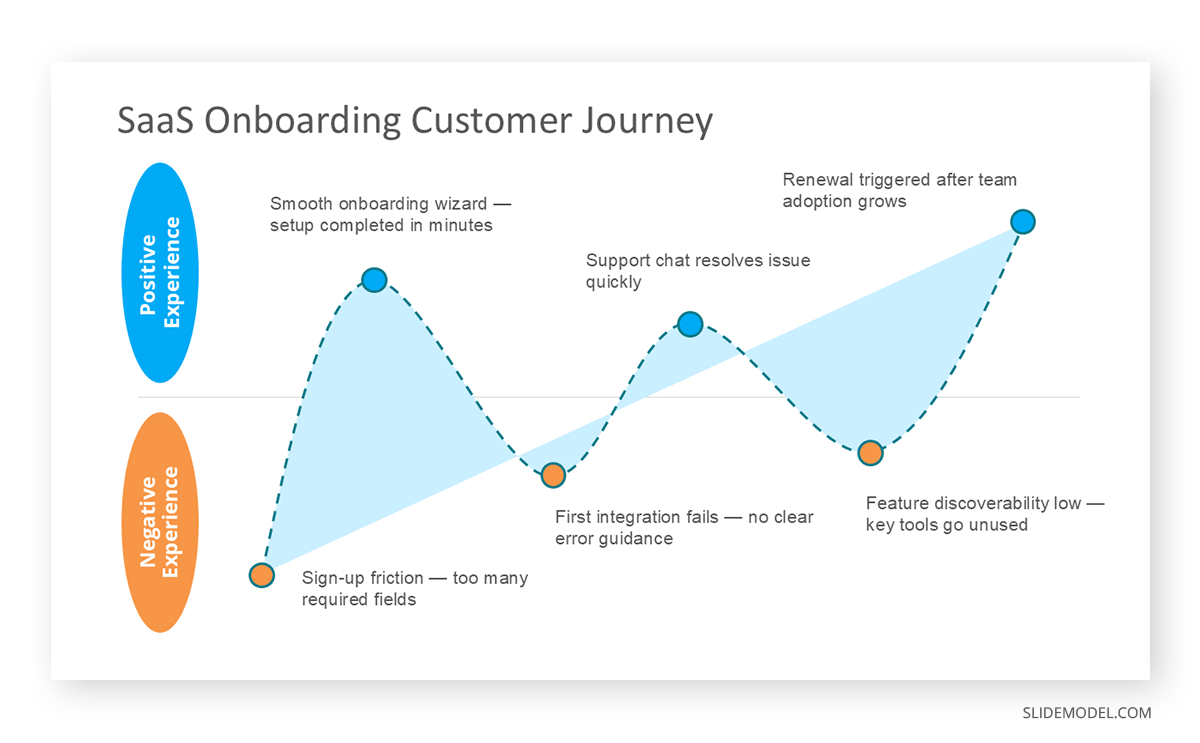
User journey maps illustrate the sequence of steps a user takes when completing a task or interacting with a product. Mermaid supports journey diagrams that define phases, tasks, and satisfaction scores for each actor in the process. In a presentation, this format is useful for product teams or UX-focused discussions where the audience needs to understand the full scope of a user experience, including where friction occurs and where the experience performs well.
Pie charts in Mermaid use simple syntax that assigns values to labeled segments. While functional, they are relatively plain compared to the chart options available natively in PowerPoint. For standard data visualization needs in a presentation, PowerPoint’s built-in chart tools offer more formatting control and allow values to be updated without re-exporting a diagram. For a full overview of options, check our article on how to make a graph in PowerPoint, which covers chart types, formatting controls, and design best practices in full detail.
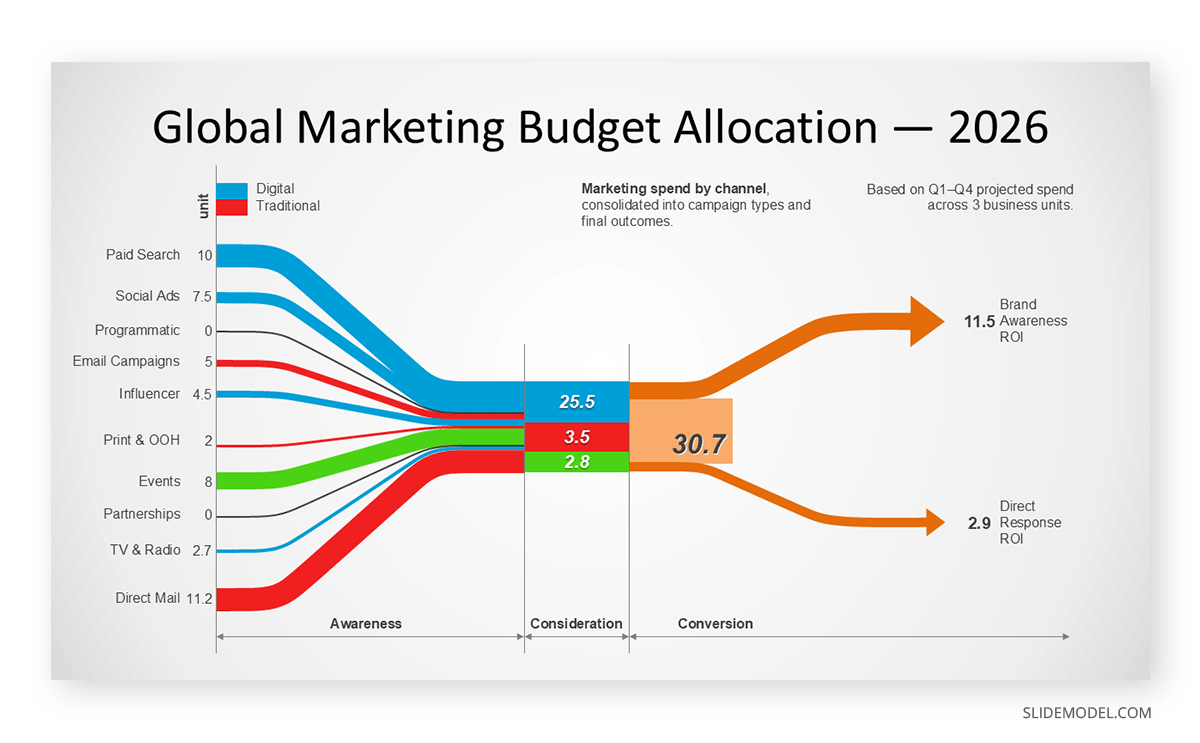
For data that flows between categories or stages rather than showing simple proportions, a Sankey diagram is worth considering. Mermaid does not include a native Sankey type, so these are built using PowerPoint’s native drawing tools or a dedicated chart application when this format is needed.
Git Graphs
Git graphs visualize the history of a code repository by showing branches, commits, and merges in a branching timeline format. Mermaid generates these from a small set of commands that define commits, branch creation, and merge operations. The output is clean and readable for technical audiences familiar with version control concepts.
For technical presentations, Git graphs are useful for explaining branching strategies, release workflows, or the development history of a codebase during a retrospective or architecture review. They are less common in general business presentations but are relevant in engineering team meetings, developer onboarding sessions, and technical design discussions where version control workflows need to be communicated visually rather than described verbally.
When inserting a Git graph into PowerPoint, the same export process applies as with other diagram types: render it in a Mermaid tool, export it as SVG or PNG, and insert it as an image. Git graphs with many branches can become complex at a glance. Before exporting, simplify the source to show only the branches and commits that are relevant to the specific point being made in the presentation. A diagram showing three branches over four commits communicates a branching strategy far more clearly than one showing twelve branches with overlapping merges.
PNG vs SVG: Format Compatibility and Export Options
The choice between PNG and SVG when exporting Mermaid diagrams for PowerPoint has meaningful consequences for how the diagram looks in the final presentation. Both formats are fully supported in PowerPoint, but they behave differently in ways that affect quality, scalability, and file management.
PNG is a raster image format. Quality is determined by the resolution at the time of export. A PNG captured from a browser at standard zoom is generally sufficient for a slide viewed on a laptop at 1080p, but it may appear soft or pixelated when projected at large scale or included in a printed version of the deck. Exporting at higher resolution, when the rendering tool offers that option, reduces this risk. As a rule of thumb, aim for at least 150 DPI for screen use and 300 DPI for printed output.
SVG is a vector format. The image is defined as mathematical shapes, paths, and text, which means it scales to any size without quality loss. An SVG exported from Mermaid will appear sharp whether it occupies a quarter of a slide or fills the entire canvas. PowerPoint supports SVG insertion natively in versions from 2016 onward, treating SVG files as scalable objects that can be resized freely without degradation. For a detailed explanation of how SVG files behave in PowerPoint and what to expect across different Microsoft 365 versions, our guide to SVG in PowerPoint covers specifics on scaling, grouping, and compatibility.
For professional presentations, SVG is the preferred format whenever the Mermaid rendering tool offers it. The file size is typically smaller than that of a high-resolution PNG, and the rendering quality is consistently high. One area where PNG may be the better choice is when the diagram contains complex rendering that does not translate cleanly to SVG in a particular tool, or when the presentation will be converted to a format that does not preserve SVG layers. In those cases, a high-resolution PNG is a reliable and universally compatible fallback.
Rebuilding Mermaid Diagrams with PowerPoint’s Native Tools
Importing an image from Mermaid works well for diagrams that are finalized and do not need further editing inside PowerPoint. When the diagram needs to be modified by a colleague who does not have access to the Mermaid source, or when the presentation requires editable labels, animated steps, or formatting that matches the organization’s design system, rebuilding the diagram in PowerPoint is the more practical approach.
PowerPoint offers shapes, connectors, SmartArt, and tables as the core building blocks for diagrams. These can approximate the visual structure of most Mermaid diagram types with full layout control. The output will be styled according to the slide deck’s design rather than Mermaid’s default rendering, which is often an advantage rather than a limitation in a professional presentation context.
Swimlane Diagrams
A Mermaid swimlane diagram is approximated using the subgraph feature, which groups nodes into named containers that render as bordered sections. The result is a multi-lane layout, but control over lane dimensions and visual separation is limited compared to a purpose-built swimlane layout. For formal swimlane presentations, building directly in PowerPoint with rectangular shapes for lane boundaries, labeled boxes for process steps, and connectors to show the flow between them is generally more effective. The full structure and conventions of swimlane diagrams, which cover lane count conventions, labeling, and flow direction in depth.
Swimlane diagrams are widely used in operational and process-focused presentations. They are particularly effective for illustrating cross-functional processes in which each department or system has a clearly defined area of responsibility. An order fulfillment workflow that spans Sales, Operations, Warehouse, and Finance, for example, becomes significantly clearer when each function occupies a dedicated horizontal lane, and the flow of handoffs between lanes is visible at a glance.
WBS Charts
A work breakdown structure, or WBS chart, organizes a project into a hierarchical tree of deliverables, components, and tasks. It is standard in project management presentations and proposals. Mermaid does not include a native WBS chart type, so these are typically built using a dedicated project management tool or constructed directly in PowerPoint. Understanding how to create a work breakdown structure is useful background for anyone building project scope presentations, since the WBS defines how work is organized before a Gantt chart or timeline is developed.
In PowerPoint, a WBS chart can be constructed using SmartArt with the Hierarchy layout, which automatically handles the indented tree structure. For full layout control, building the chart manually with rectangular shapes and connectors allows precise positioning and custom formatting. The top level shows the project name, the second level shows major deliverables or phases, and lower levels break those into sub-deliverables or work packages. This structure clearly communicates the project scope and helps audiences understand how responsibilities are organized before discussing the schedule or budget.
Wardley Maps and Ishikawa Diagrams
Wardley Maps are strategic planning tools that plot components of a value chain against two axes: visibility to the end user and evolutionary maturity, ranging from genesis through custom-built, product, and commodity stages. They are used for competitive landscape analysis, build-versus-buy decisions, and communicating technology strategy to leadership. Mermaid does not include a native Wardley Map type; building one requires a coordinate axis and positioned labels with connectors, best handled in PowerPoint or a dedicated strategy tool.
Ishikawa diagrams, also called fishbone or cause-and-effect diagrams, are used in root cause analysis to show a central problem connected to branches representing categories of contributing causes, each with further sub-causes extending outward. The visual structure resembles a fish skeleton, which gives the diagram its common name. Mermaid does not include a native Ishikawa diagram type. In PowerPoint, these diagrams can be built using a central horizontal connector with diagonal branches and smaller sub-branches extending from each category. Precise alignment is important for the diagram to read clearly. The full guide to Ishikawa diagrams and cause-and-effect analysis, which covers the methodology and construction process for presentations in detail.
Tips for Clean, Presentation-Ready Diagrams
Whether exporting from Mermaid or rebuilding diagrams natively in PowerPoint, several principles apply to keeping business presentations clear and professional. The diagram is a communication tool, not a complete specification, and the slide context imposes constraints that a documentation context does not.
Reduce complexity before exporting. A Mermaid diagram written for technical documentation may contain more detail than a slide audience can absorb in the time the diagram is on screen. Remove intermediate steps irrelevant to the presentation’s argument, consolidate similar branches, and simplify labels to their most essential meaning. If the full detail is necessary, consider whether it belongs in the appendix rather than the main deck, or whether it should be broken across multiple slides with progressive disclosure.
Check text size after inserting. Diagrams that look readable in a browser tab or documentation viewer often contain small labels that become illegible when the image is scaled to fit a slide. After inserting a Mermaid export, zoom the slide view to 100 percent and verify that every label is readable at that scale. If it is not, return to the Mermaid source, simplify the layout, and re-export. Reducing the number of nodes or increasing the diagram’s font size in the source syntax are both effective approaches.
Align the diagram’s visual style with the rest of the deck when presentation quality is a priority. A Mermaid-exported diagram uses the default Mermaid colors and fonts, which may not align with the organization’s design system. When visual consistency is important, rebuilding the diagram in PowerPoint gives full control over colors, typography, and line weights. When speed is the priority and the diagram is being used as a technical reference rather than a polished asset, the default Mermaid export is acceptable, but adding a descriptive slide title helps contextualize the diagram for the audience. Our article on how to create beautiful diagrams for presentations covers design principles for diagrams that need to meet a higher visual standard in a slide deck.
For process-oriented diagrams, consider whether process mapping conventions familiar to your audience should inform the diagram’s notation. Different functions within an organization, from operations to software engineering, use different diagramming standards. Matching the notation to the audience’s background reduces the cognitive load of interpreting the diagram, allowing the conversation to focus on its content rather than its format.
Several browser-based presentation tools can support specific steps in the Mermaid-to-PowerPoint workflow. The tools page includes an image vectorizer that converts PNG exports to clean SVG files, which is useful when the rendering tool you are working with does not offer a direct SVG export. The whiteboard tool provides an infinite canvas for building native diagrams, including flowcharts and process maps, that can be exported directly as editable PPTX files without going through Mermaid at all. For technical presentations where the source syntax itself is part of the content, the Code to Slide tool converts a code snippet into a formatted, presentation-ready slide, making it straightforward to display Mermaid code alongside its rendered output on facing slides.
FAQs
Can I paste Mermaid code directly into a PowerPoint slide?
No. PowerPoint does not include a Mermaid renderer, so pasting Mermaid syntax into a text box displays the raw code as plain text. To show the rendered diagram, export it from a Mermaid tool as a PNG or SVG and insert the resulting image file into the slide.
What is the best format to use when exporting Mermaid diagrams for PowerPoint?
SVG is generally the better choice for professional presentations because it scales without quality loss. An SVG diagram will remain sharp whether the slide is displayed on a laptop or projected at large scale. PNG is an acceptable alternative when the export resolution is high enough, but it will lose quality if the image is enlarged beyond its original dimensions. For printed slide handouts, SVG is strongly preferred.
Does PowerPoint support SVG files?
Yes. PowerPoint 2016 and later versions natively support SVG insertion. Once inserted, SVG files can be resized without quality degradation. Some versions of PowerPoint allow you to ungroup an SVG to access and edit individual elements, though this depends on the file’s complexity and the version of Office installed.
How do I export a Mermaid diagram as an image?
The simplest option is the Mermaid Live online editor at mermaid.live/edit. Paste your diagram syntax, verify the rendering in the preview panel, and use the export controls to download the file as PNG or SVG. Other Mermaid-compatible documentation platforms and developer tools may offer their own export options with similar functionality.
Can I edit a Mermaid diagram inside PowerPoint after inserting it?
If you inserted the diagram as a PNG, it is a static image and cannot be edited inside PowerPoint. If you inserted it as SVG, some versions of PowerPoint allow you to ungroup the file to access individual shapes, but this does not reconnect to the Mermaid source. For a fully editable diagram, rebuild the structure using PowerPoint’s native shapes and connectors.
How do I handle swimlane diagrams in PowerPoint when Mermaid’s support is limited?
Mermaid can approximate swimlane layouts using subgraphs, which group nodes into named bordered containers. However, the lane control is more limited than that of a purpose-built swimlane. For formal swimlane diagrams intended for business presentations, building them directly in PowerPoint with rectangular lane boundaries, labeled process boxes, and directional connectors provides more precise control over layout and formatting.
What should I do if my Mermaid diagram is too complex to fit legibly on a single slide?
Simplify the source diagram before exporting by removing nodes or edges that are not central to the point being made. If the full complexity is necessary, break the diagram across multiple slides, with each slide showing a specific stage or section of the process. Progressive reveal animations in PowerPoint can also help audiences follow complex flows without being overwhelmed by all elements at once.
Are there Mermaid diagram types that translate poorly to a presentation context?
Git graphs are often too detailed for a general business audience and are most appropriate in technical team presentations or engineering retrospectives. Very large ER diagrams with many tables and relationships can also be difficult to read at slide scale. In these cases, consider whether a simplified high-level conceptual diagram would communicate the main point more clearly than exporting the full source.
Can I use Mermaid-generated diagrams in a printed version of a PowerPoint deck?
Yes, if the diagram was exported as SVG before insertion. SVG files print at full quality regardless of scale. PNG files print at the resolution of the original export, so a low-resolution PNG will appear soft in print. For slide decks that will be printed or distributed as PDFs, always use SVG exports where the tool supports it.
Is there a way to automate the process of updating Mermaid diagrams in PowerPoint?
Direct automation between Mermaid and PowerPoint is not available through standard tools. The workflow requires a manual re-export and image replacement each time the source diagram changes. Some teams manage this by storing Mermaid source files in a shared repository and assigning ownership of slide updates to a specific person before key presentations. Scripting tools can automate the export step in some pipelines, but the PowerPoint insertion step remains manual.
Final Words
Using Mermaid diagrams in PowerPoint requires a deliberate conversion workflow rather than a direct integration. Since PowerPoint does not render Mermaid syntax natively, the process involves exporting the rendered diagram as a PNG or SVG image and inserting it into the slide, or rebuilding the diagram structure using PowerPoint’s native drawing tools when editability or design consistency is a priority.
The right approach depends on what the diagram needs to accomplish in the presentation. A detailed sequence diagram or data architecture diagram is usually best served by an SVG export from a Mermaid rendering tool, which preserves precision and scales cleanly to any slide size or display. A swimlane diagram, WBS chart, or Wardley map will typically produce better results when built natively in PowerPoint, where layout, color, and typography can be controlled to match the deck’s design.
Understanding the full range of diagram types available through Mermaid, from flowcharts and Gantt charts to ER diagrams and Git graphs, gives you the flexibility to choose the right format for each communication need. With a consistent export process and attention to legibility and slide design, Mermaid diagrams can become a reliable part of any technical presentation workflow.