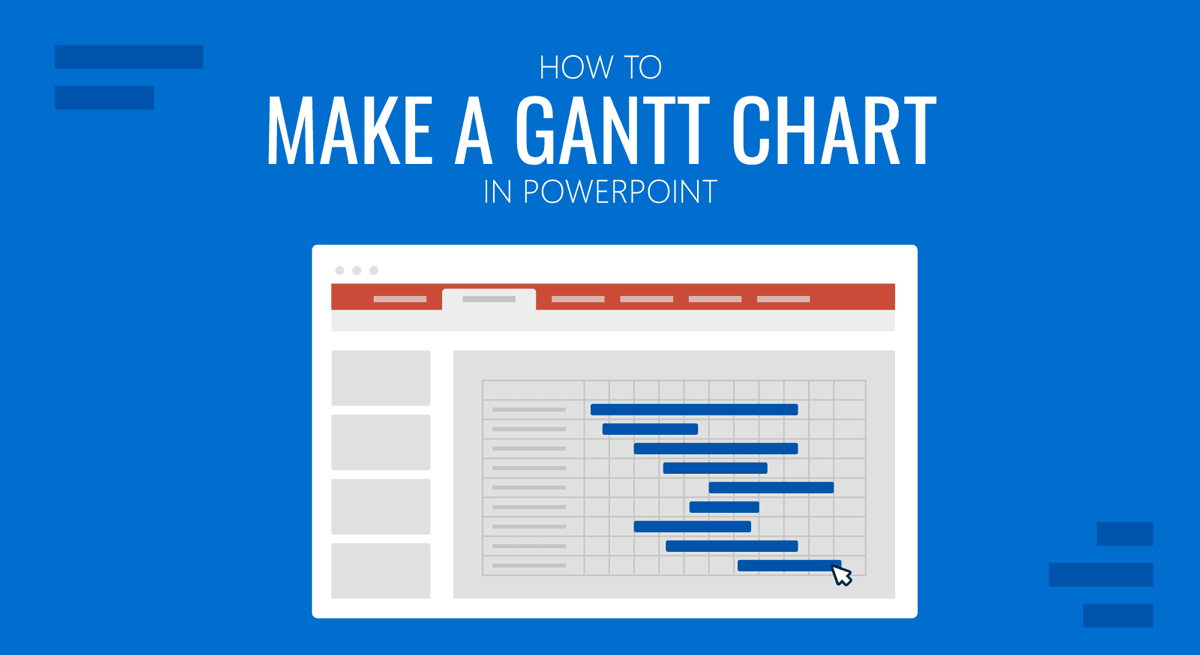
Even if you are unfamiliar with Gantt charts, you might have seen project schedules represented visually across a series of horizontal lines. These charts help monitor completed tasks and review the schedule in line with the planned timeline for a project. In this article, we will discuss the benefits of Gantt charts and show you how to make a Gantt chart in PowerPoint.
Why use a Gantt Chart in PowerPoint?
Gantt charts are commonly used in PowerPoint to help visualize project timelines through presentation slides. Gantt charts are used as a project management tool that helps plan and schedule projects and provide a visual footprint to assess if the project is on track. The visual representation of a Gantt chart can help represent activities based on a set timeline to project the estimated timeline and assess actual progress made against the planned activities.
How to Create a Gantt Chart in PowerPoint
You can create a PowerPoint Gantt chart using various methods or use PowerPoint templates. In the examples below, we will show you how to create a Gantt chart in PowerPoint using a bar chart and PowerPoint Shapes.
Create a Gantt Chart using a Bar Chart in PowerPoint
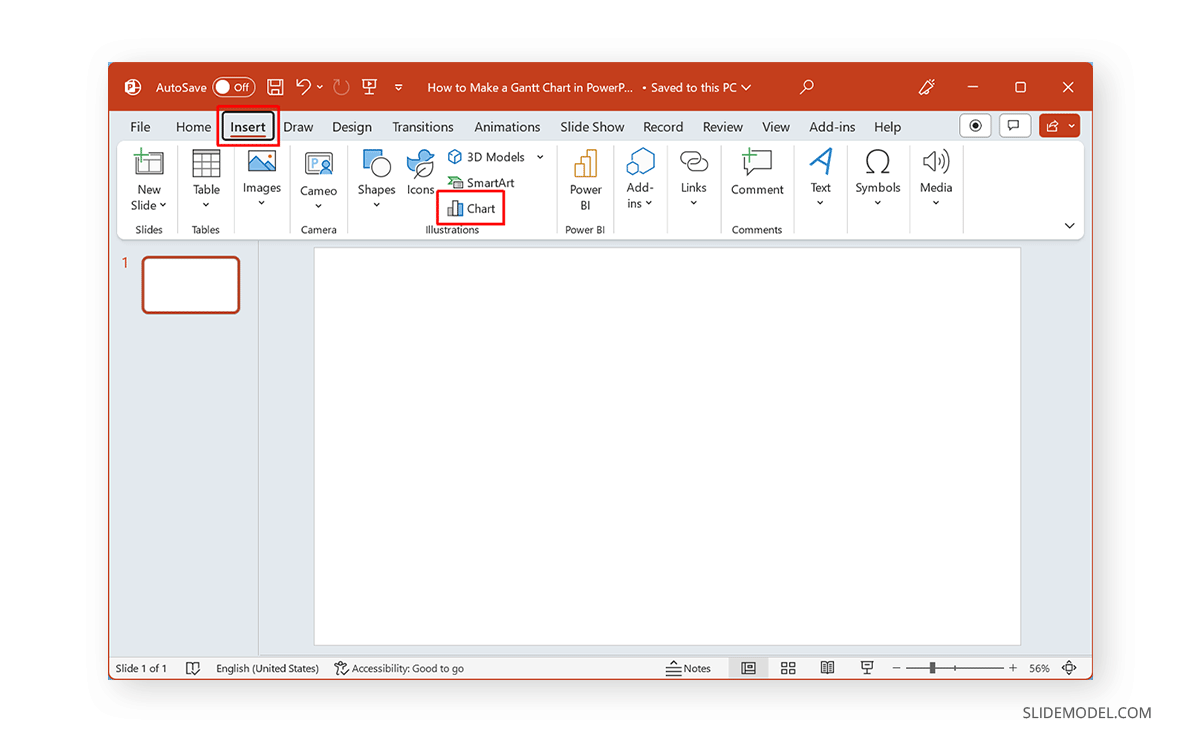
Step 1: Go to the Insert tab in PowerPoint and select Chart.
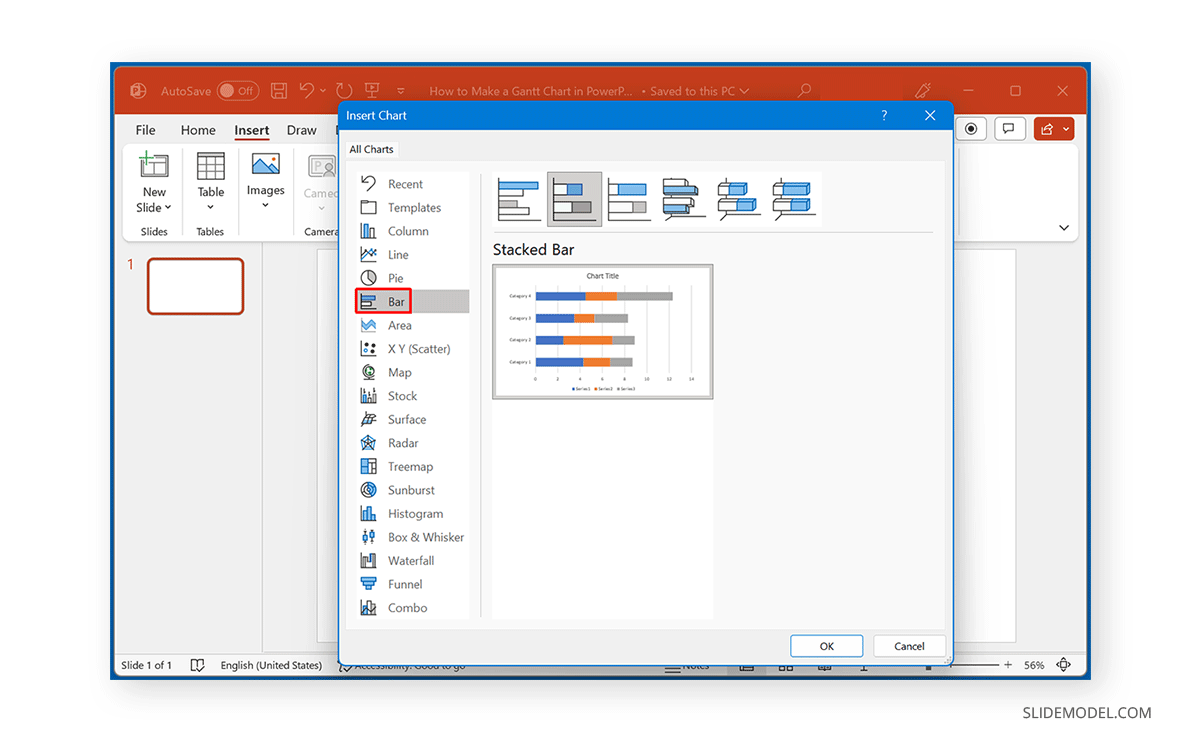
Step 2: Select Bar from the Insert Chart dialog box and select a Stacked Bar Chart to insert in PowerPoint.
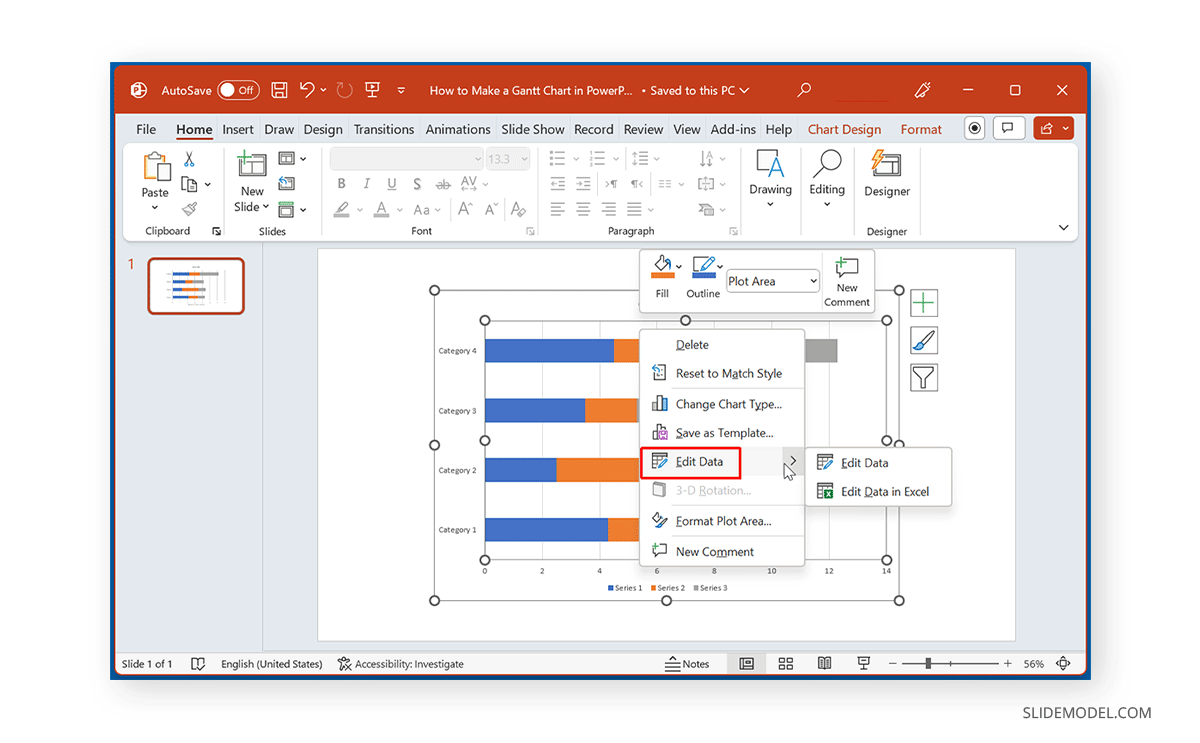
Step 3: Edit the default bar chart. You can do this by selecting Edit Data via the right-click menu or from the Chart Design tab.
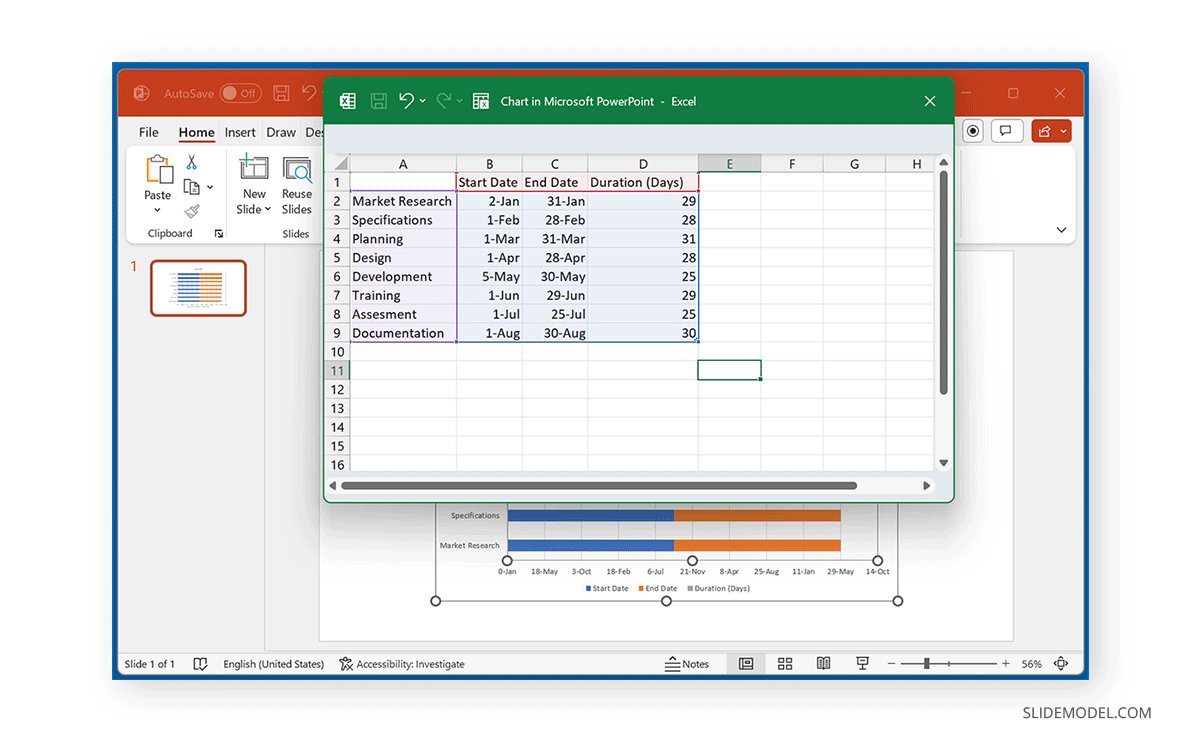
Step 4: Edit the chart information to reflect details for your Gantt chart. You can use a combination of dates, days, tasks, or other sequences to design your Gantt chart.
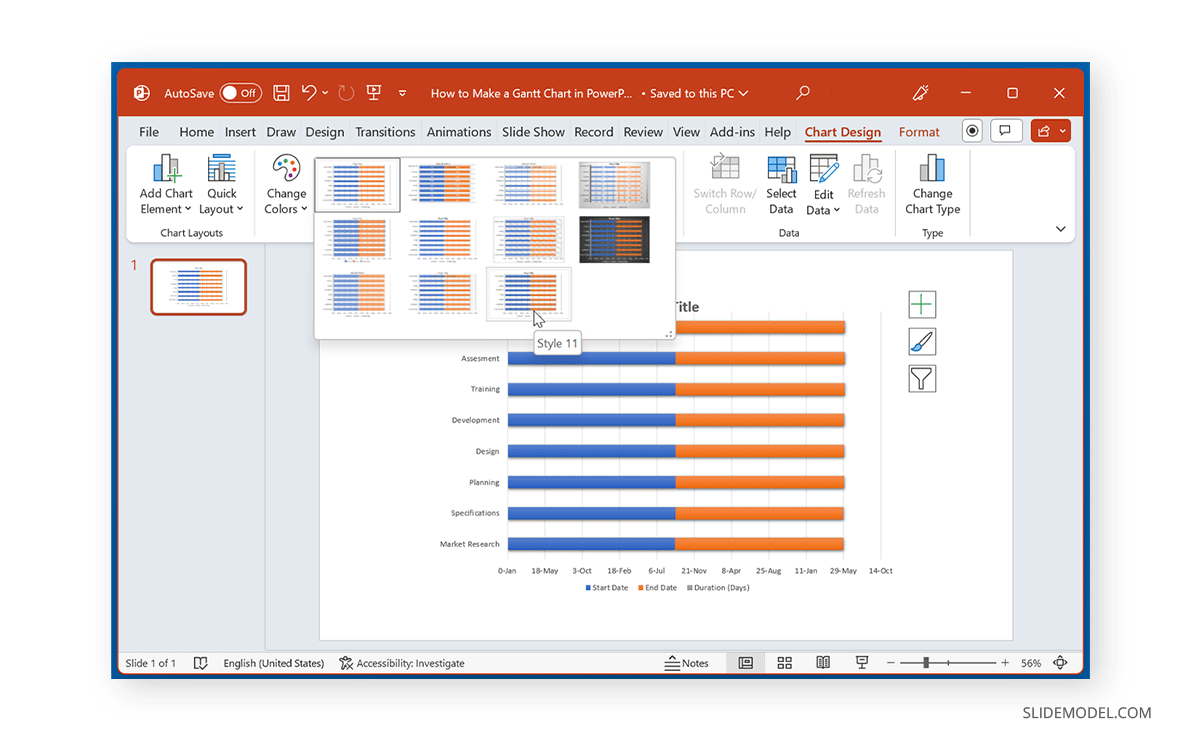
Step 5: Select a chart style and colors for your Gantt chart from the Chart Design tab. You can also format the layouts using Chart Design -> Quick Layouts.
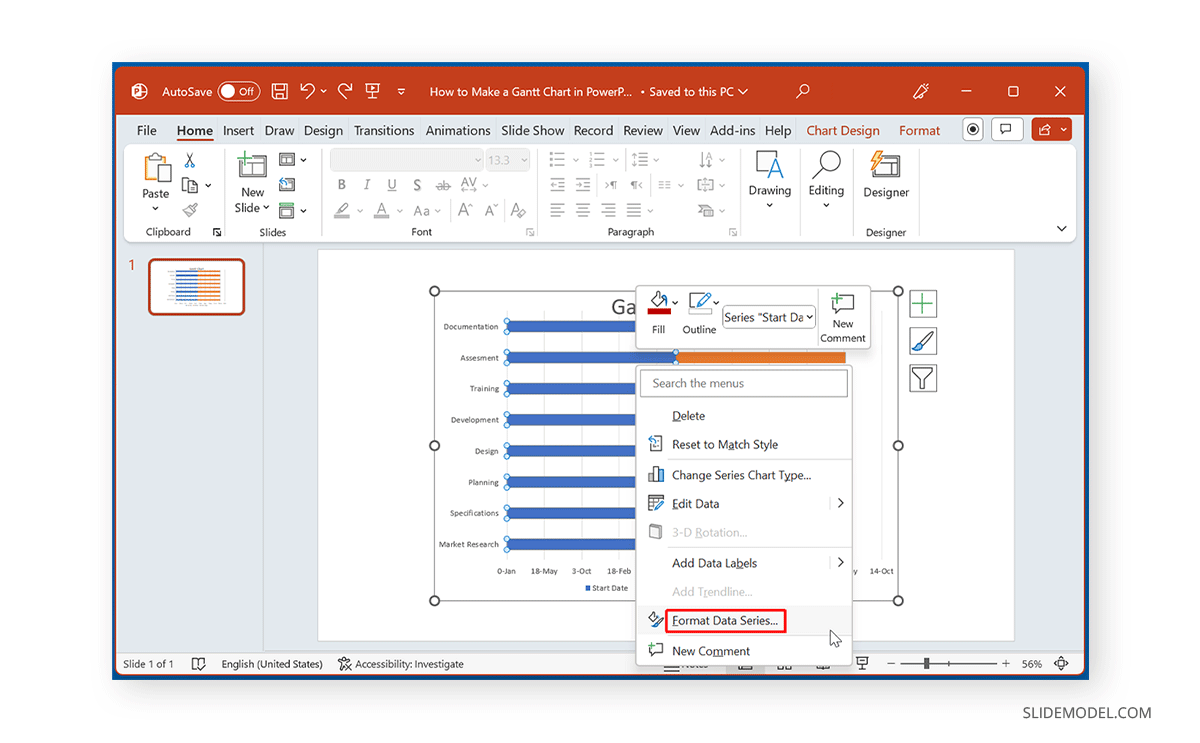
Step 6: Right-click the chart and select Format Data Series.
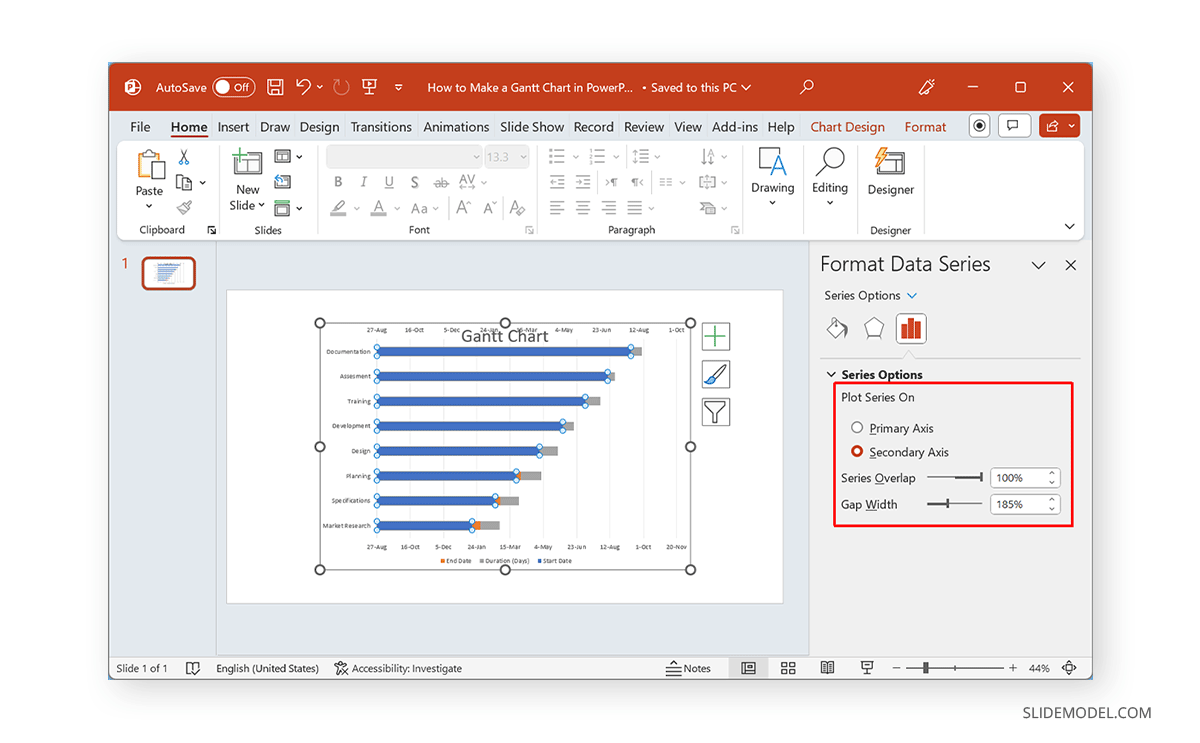
Step 7: From the Series Options on the right pane, select the format for your Gantt chart. For example, you can stick to the Secondary Axis only and hide the Primary Axis (as shown below).
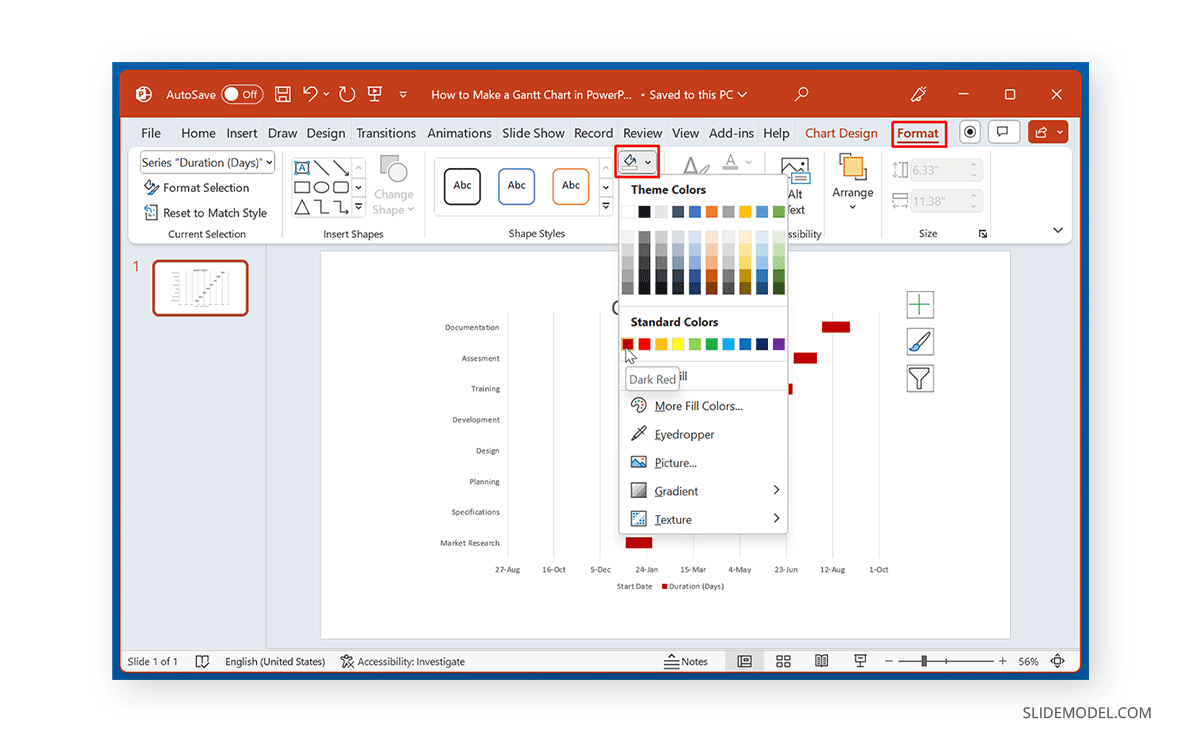
Step 8: From Format -> Shape Fill, remove the fill color for one of the Axis to hide it.
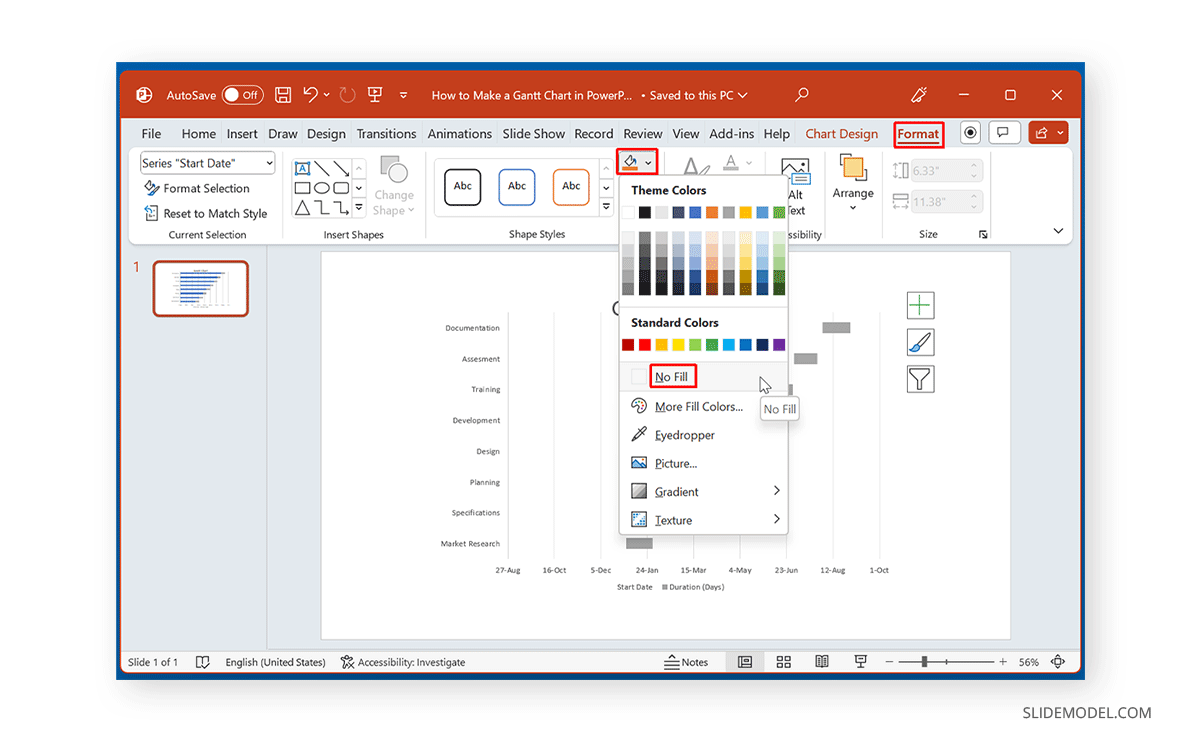
Step 9: Select a color for the Axis you intend to show to highlight it.
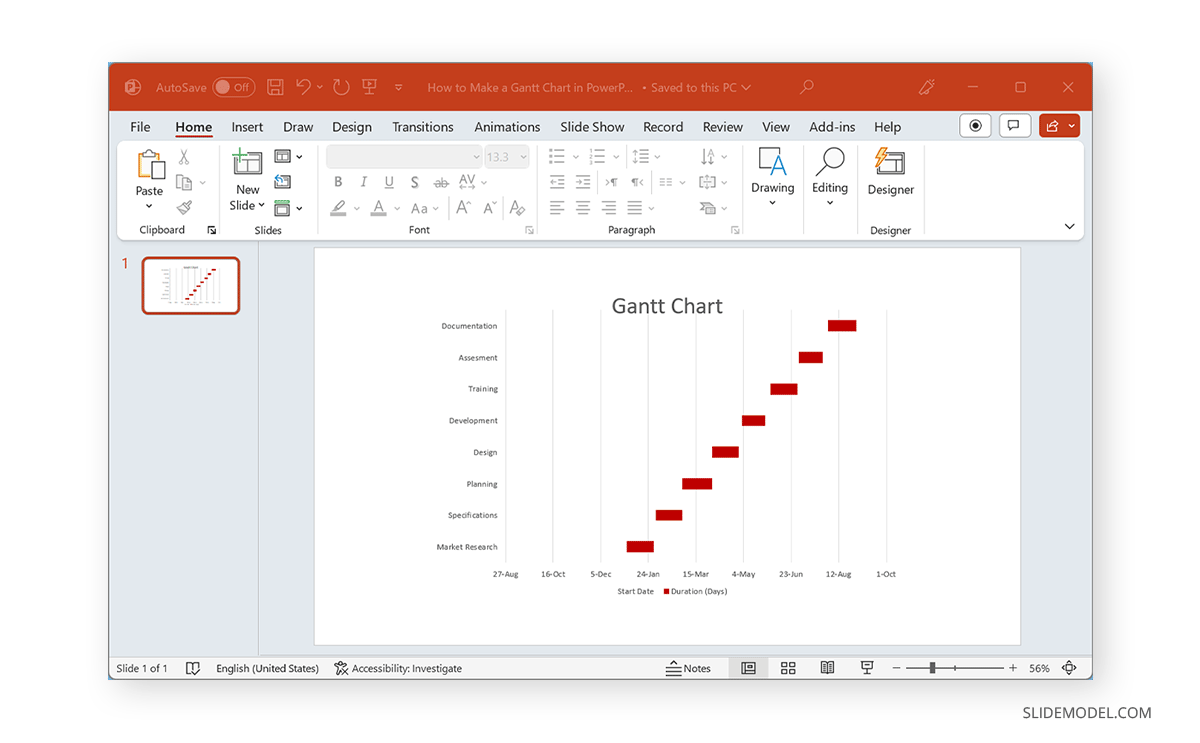
Below is an example of a Gantt chart showing the Secondary Axis across a timeline.
Create a Gantt Chart using a Bar Chart in PowerPoint using a Table and PowerPoint Shapes
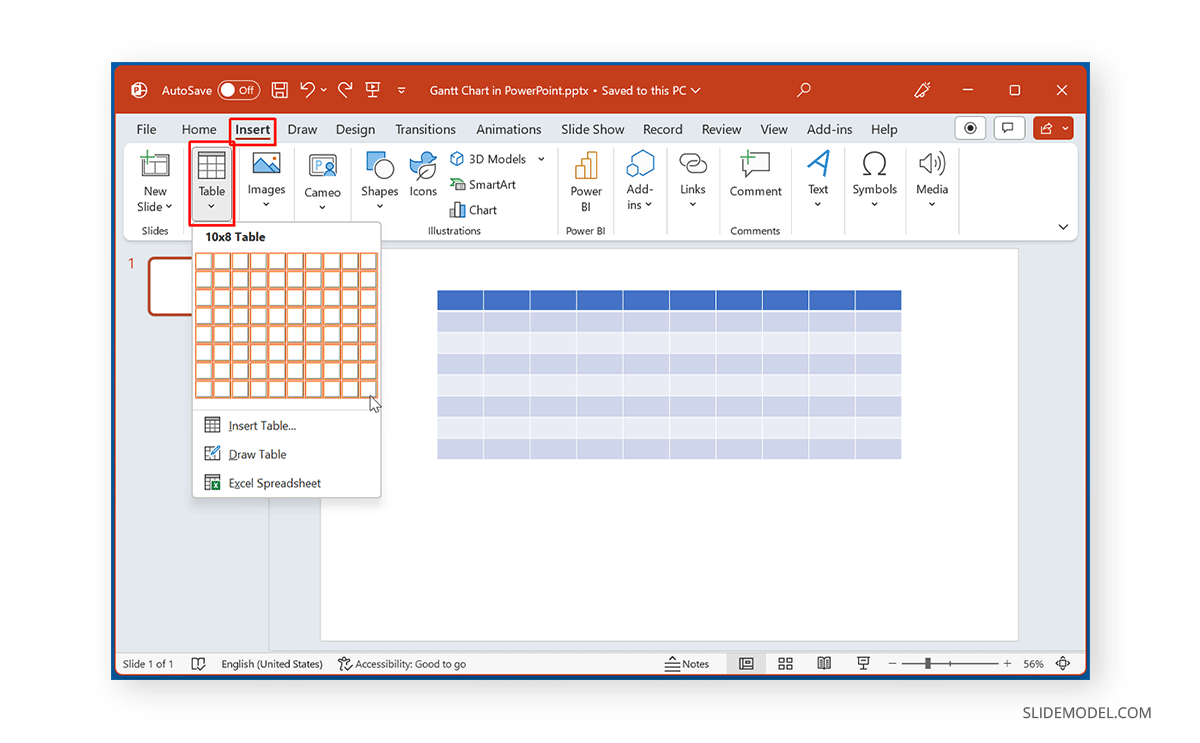
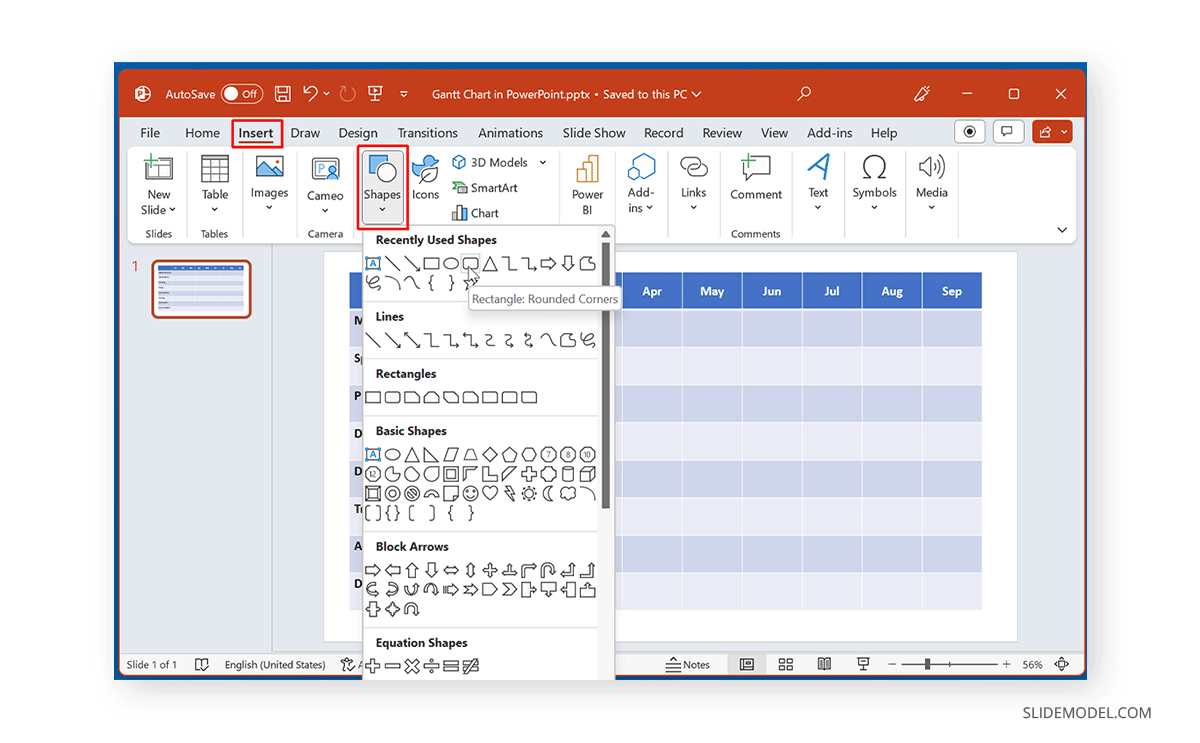
Step 1: To create a Gantt chart using a table and PowerPoint Shapes, insert a table in a PowerPoint slide via Insert -> Table.
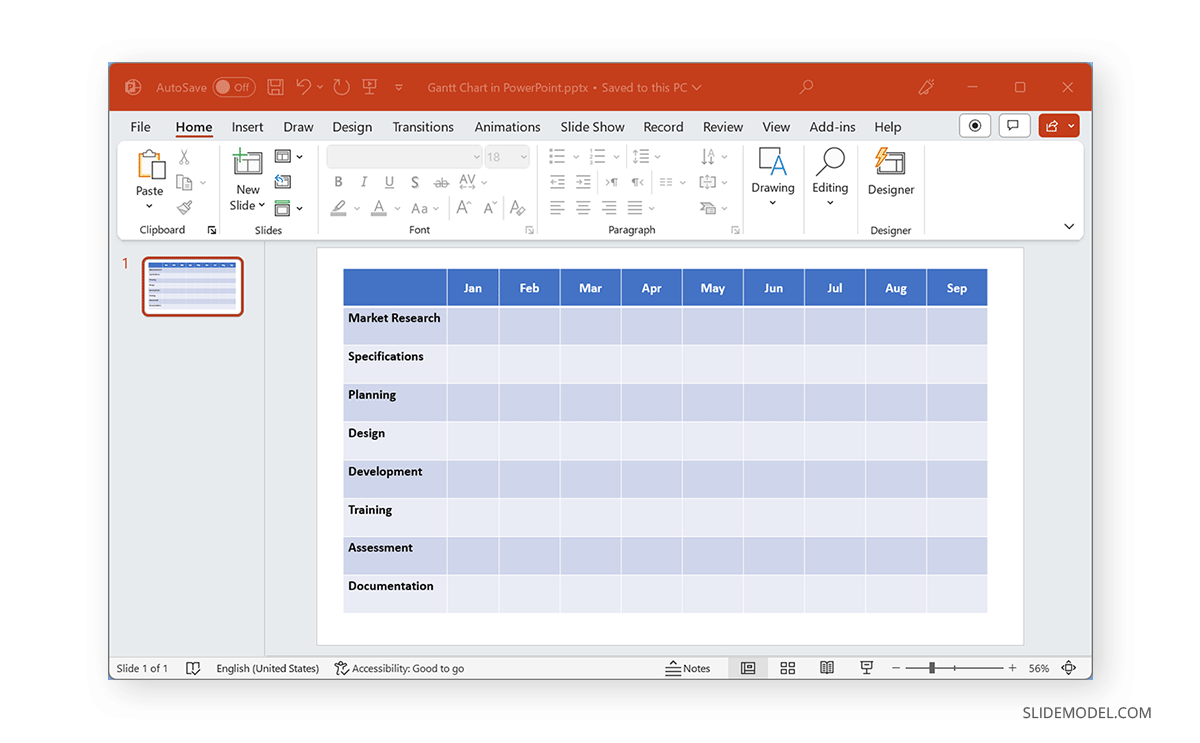
Step 2: Depending on the requirements for your Gantt chart, label the table, such as by adding activities and a timeline.
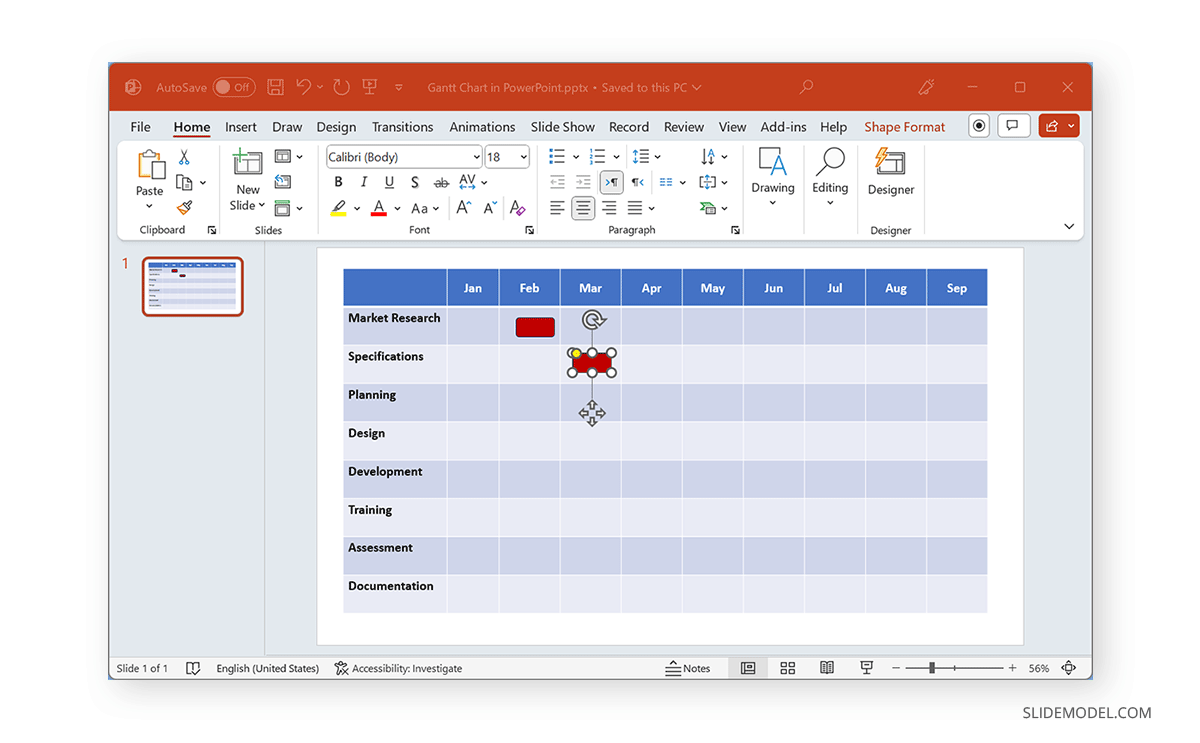
Step 3: Select a shape to mark your timeline on the Gantt chart. You can use shapes based on activities or workflow or pick a desired shape to highlight activities across dates, months, weeks, etc.
Step 4: Mark the Gantt chart with the selected shape to create a timeline for your activities.
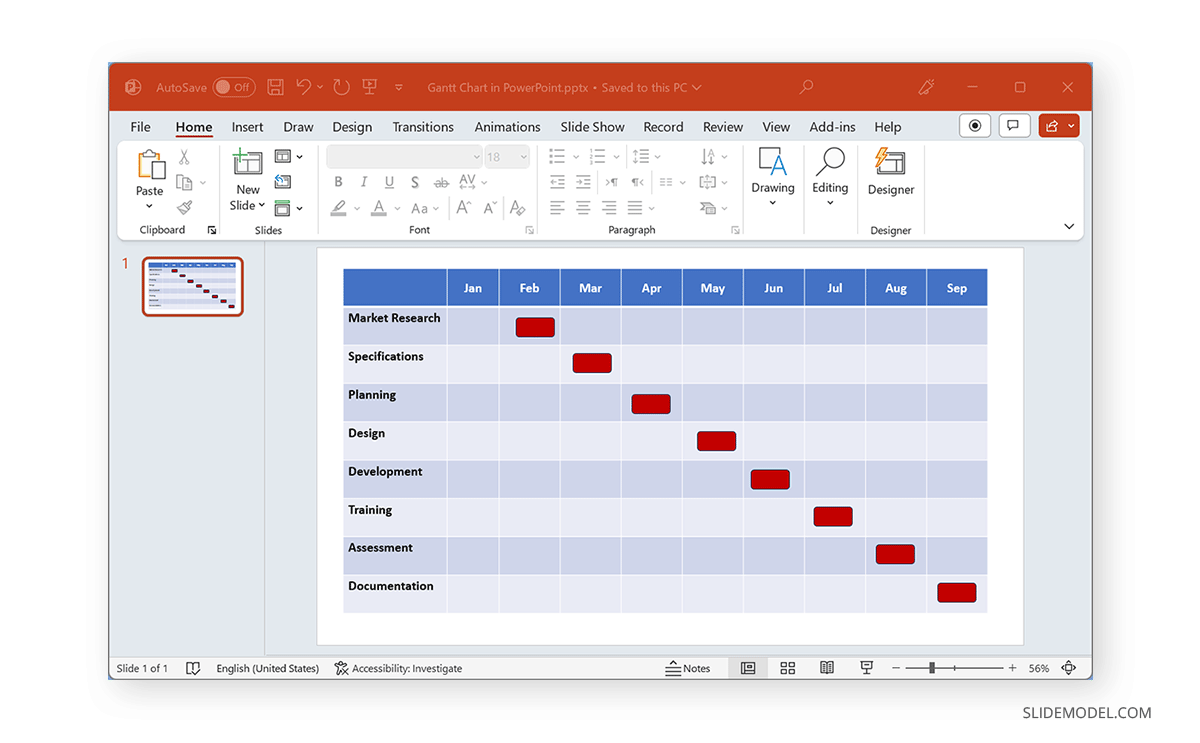
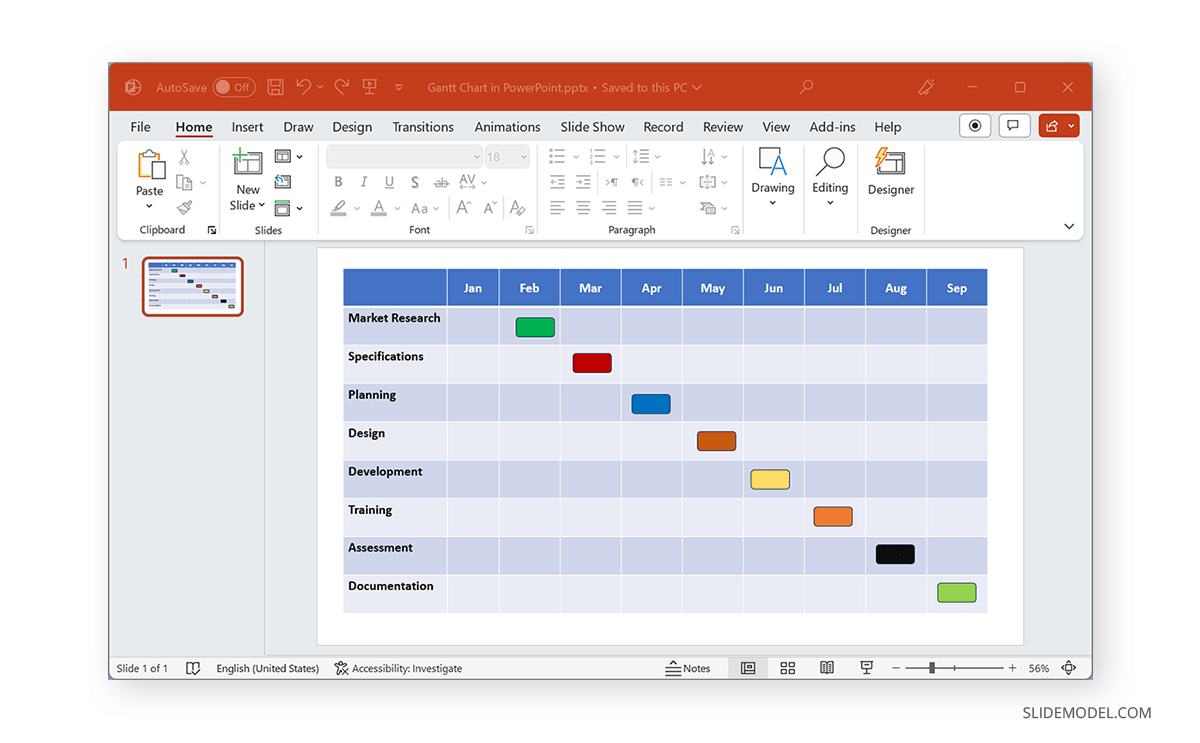
Below is an example of a Gantt chart created using a table and rectangle shapes.
Using the Shape Format tab, you can also format the added shapes on your Gantt chart. From here, you can change the color of the shapes, shape styles, and alignment of the added shapes.
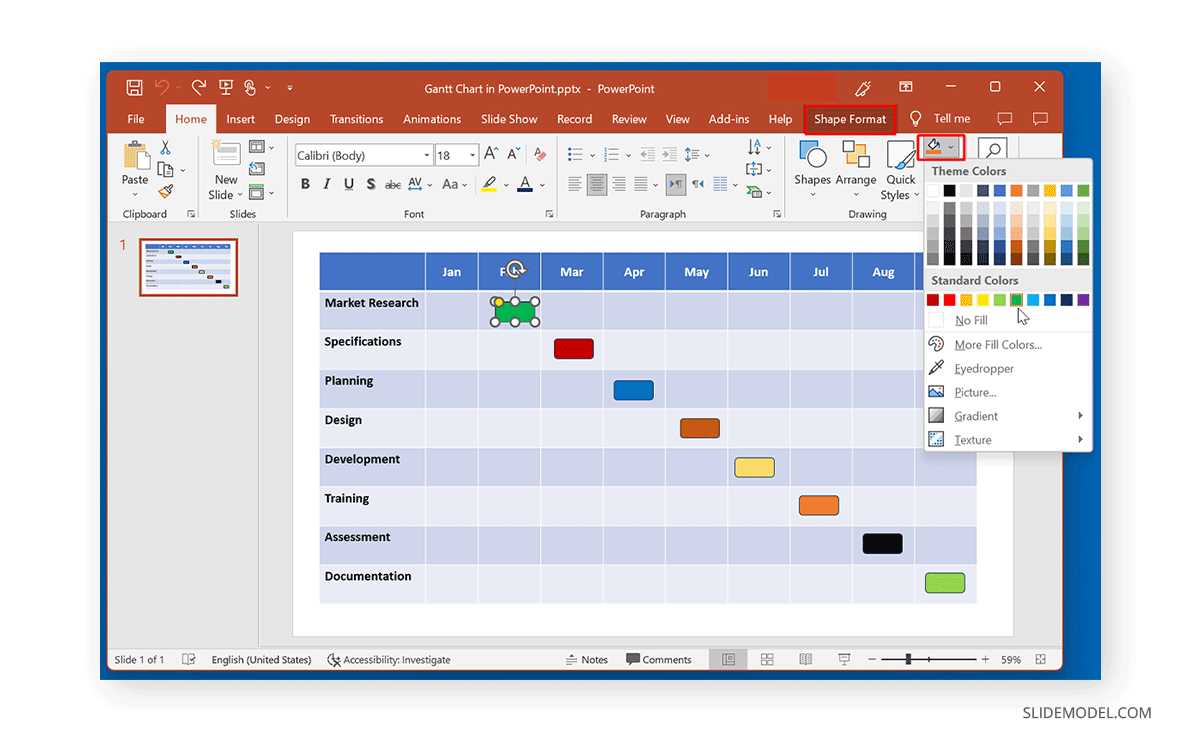
With the help of a simple table and PowerPoint Shapes, you can create customizable Gantt charts that can be easily edited and adjusted according to need.
Create a Gantt Chart using PowerPoint Templates
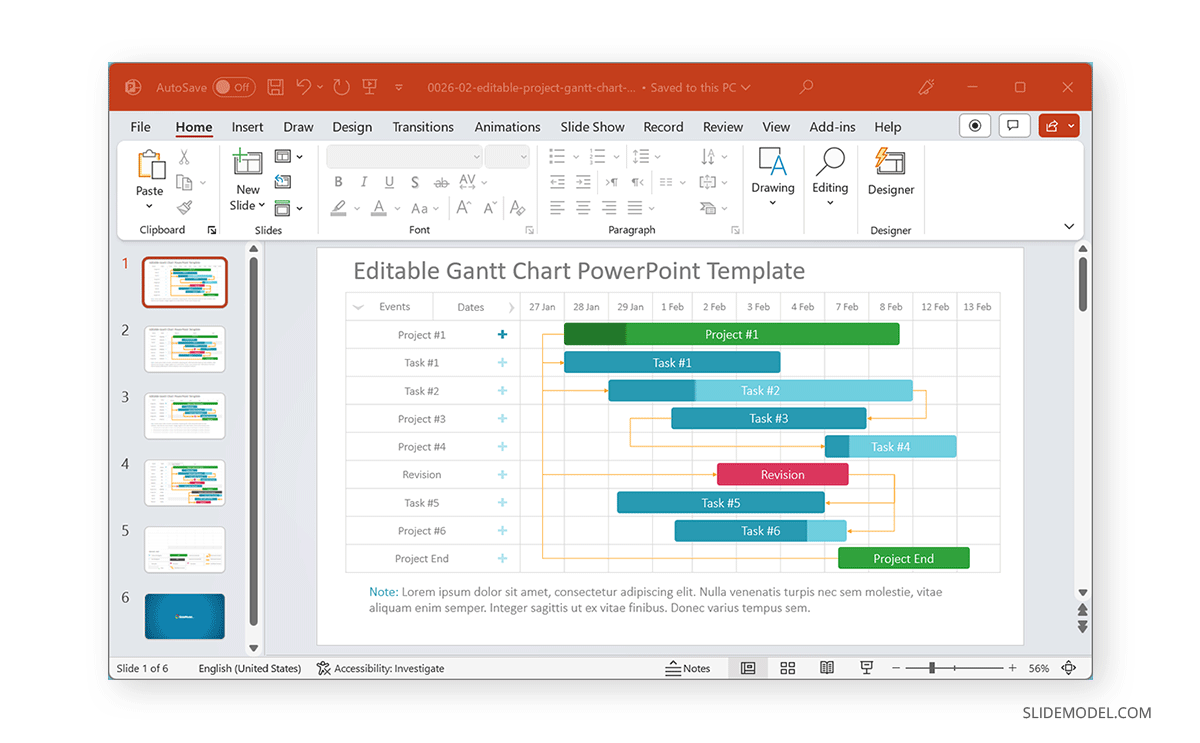
You can use PowerPoint templates to create Gantt charts to save time and effort. SlideModel provides a variety of Gantt Chart Templates that can help you easily design your charts by adding text to placeholders and adjusting the given timeline markers.
FAQs
Can I create Gantt Charts in PowerPoint?
Yes, Gantt charts can be created in PowerPoint using templates, charts, tables, and shapes. Alternatively, you can use specialized PowerPoint add-ins for Gantt charts.
Can I add task dependencies in a Gantt chart in PowerPoint?
Yes, you can easily add tasks and dependencies in PowerPoint Gantt charts, as each section is editable.
Is it possible to customize the appearance of the Gantt chart in PowerPoint?
Yes, depending on how your Gantt chart is made, you can customize it using formatting features such as Shape Format, Table Design, and Chart Design options.
Can I add more tasks to the Gantt chart after creating it in PowerPoint?
Yes, most Gantt charts and templates are editable and can be modified to add more tasks.
How do I create a Gantt chart using a bar chart in PowerPoint?
To create a Gantt chart using a bar chart, insert a Stacked Bar Chart via Insert -> Chart, edit the data to reflect your timeline, and format the chart using the Chart Design and Format Data Series options.
How do I create a Gantt chart using a table and shapes in PowerPoint?
Insert a table via Insert -> Table, label it according to your requirements, and use shapes to mark your timeline. Adjust the shapes and table as needed to complete your Gantt chart.
Can I use PowerPoint templates to create Gantt charts?
Using PowerPoint templates, such as those provided by SlideModel, can save time and effort. These templates come with placeholders and timeline markers that can be easily adjusted.
What are the benefits of using Gantt charts in PowerPoint?
Gantt charts help visualize project timelines, plan and schedule projects, and provide a visual footprint to assess a project’s progress.
How can I format the shapes in my Gantt chart in PowerPoint?
You can format shapes using the Shape Format tab, where you can change the added shapes’ color, style, and alignment.
Why should I use third-party slide templates for Gantt charts in PowerPoint?
Third-party templates, such as those from SlideModel, offer more comprehensive customization features and editable designs that are easier to customize than default templates.
Final Words
You can create Gantt charts in PowerPoint using bar charts or tables and shapes in PowerPoint. However, using readymade templates can help reduce your time and effort in creating and designing such charts. While you can use default Gantt Chart PowerPoint templates by Microsoft 365, third-party slide templates like the ones provided by SlideModel come with more comprehensive customization features with editable Gantt chart designs that are easier to customize.
Additionally, you can use a similar approach to make the Gantt charts for Google Slides, or use one of the free Gantt Chart templates for Google Slides that we published here.