Identifying the relationship between events and things is required when solving a problem, where possible causes are inspected to know their effect in an effort to generate the possible causes of a problem and minimize them.
For this purpose, a visualization tool called the fishbone diagram is used to list all of the possible causes and effects of the problem at hand, sorting them into categories, identifying root causes, and finding their solutions.
In this article, we will explain what is a fishbone diagram for problem-solving, when to use it, the elements of a fishbone analysis, how to make a fishbone diagram, and a fishbone diagram examples.
Lastly, we will also discuss how a fishbone diagram, specifically a cause and effect fishbone diagram, can be presented, with bonus templates that can be used to construct a fishbone diagram to determine causes and effects and come up with a solution to the problem.
Table of Contents
- What is a Fishbone Diagram?
- When to Use a Fishbone Diagram?
- Elements of the Fishbone Diagram
- How to Construct a Fishbone Diagram for Cause and Effect Analysis?
- Alternative to Fishbone Diagram
- Examples of Fishbone Diagram
- Pros and Cons of Fishbone Diagrams
- How to Present a Fishbone Analysis?
- Templates for Presenting a Fishbone Diagram
- Conclusion
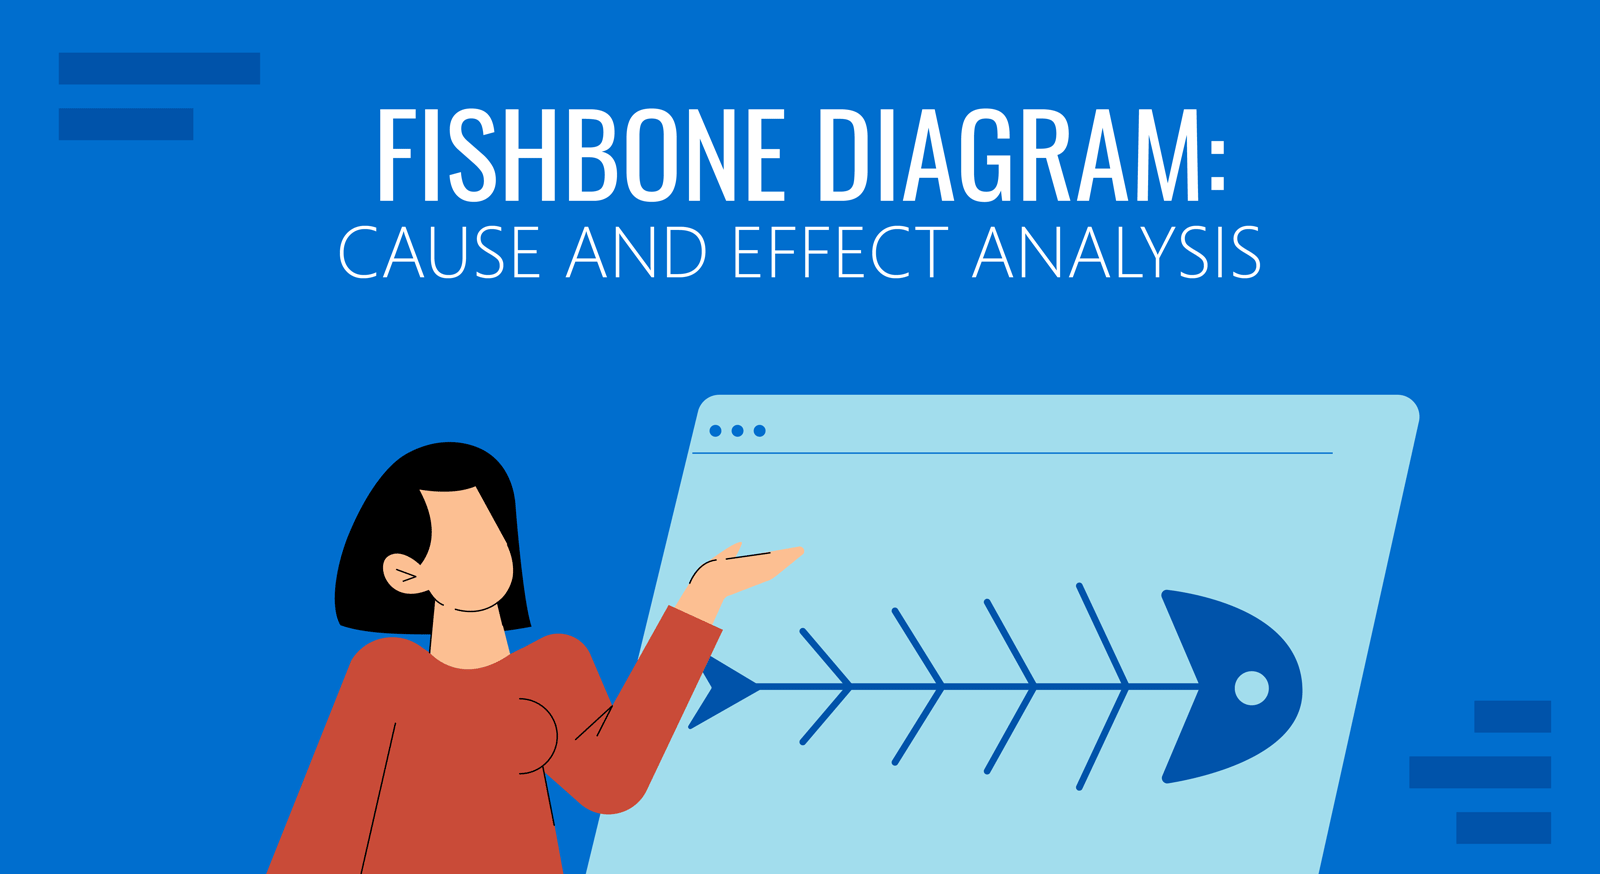
What is a Fishbone Diagram?
A fishbone diagram is a visualization tool, developed by Dr. Kaoru Ishikawa, a quality control specialist, for identifying the root causes of a problem, categorizing them, and generating solutions.
Also called the Ishikawa diagram, or cause and effect diagram, the fishbone analysis is often used in troubleshooting and product development processes where teams need to focus on a problem statement.
The fishbone diagram has categories with branches that detail the causes of the problem; it looks like the skeleton of a fish, hence the name “Fishbone.” Each bone of the fish branches out into smaller bones to address the root causes of a large problem.
When to Use a Fishbone Diagram?
A fishbone diagram is used to conduct a cause-and-effect analysis. It enables teams to identify potential and real causes that are further investigated to determine the root cause. It can be used when,
- Managers need to identify the root cause of a problem
- Supervisors try to understand the contributing factors of any system or process failure
- Collaborative team brainstorming is required for problem-solving
- Streamlining an existing workflow by uncovering bottlenecks
- Improve output quality and efficiency
Elements of the Fishbone Diagram
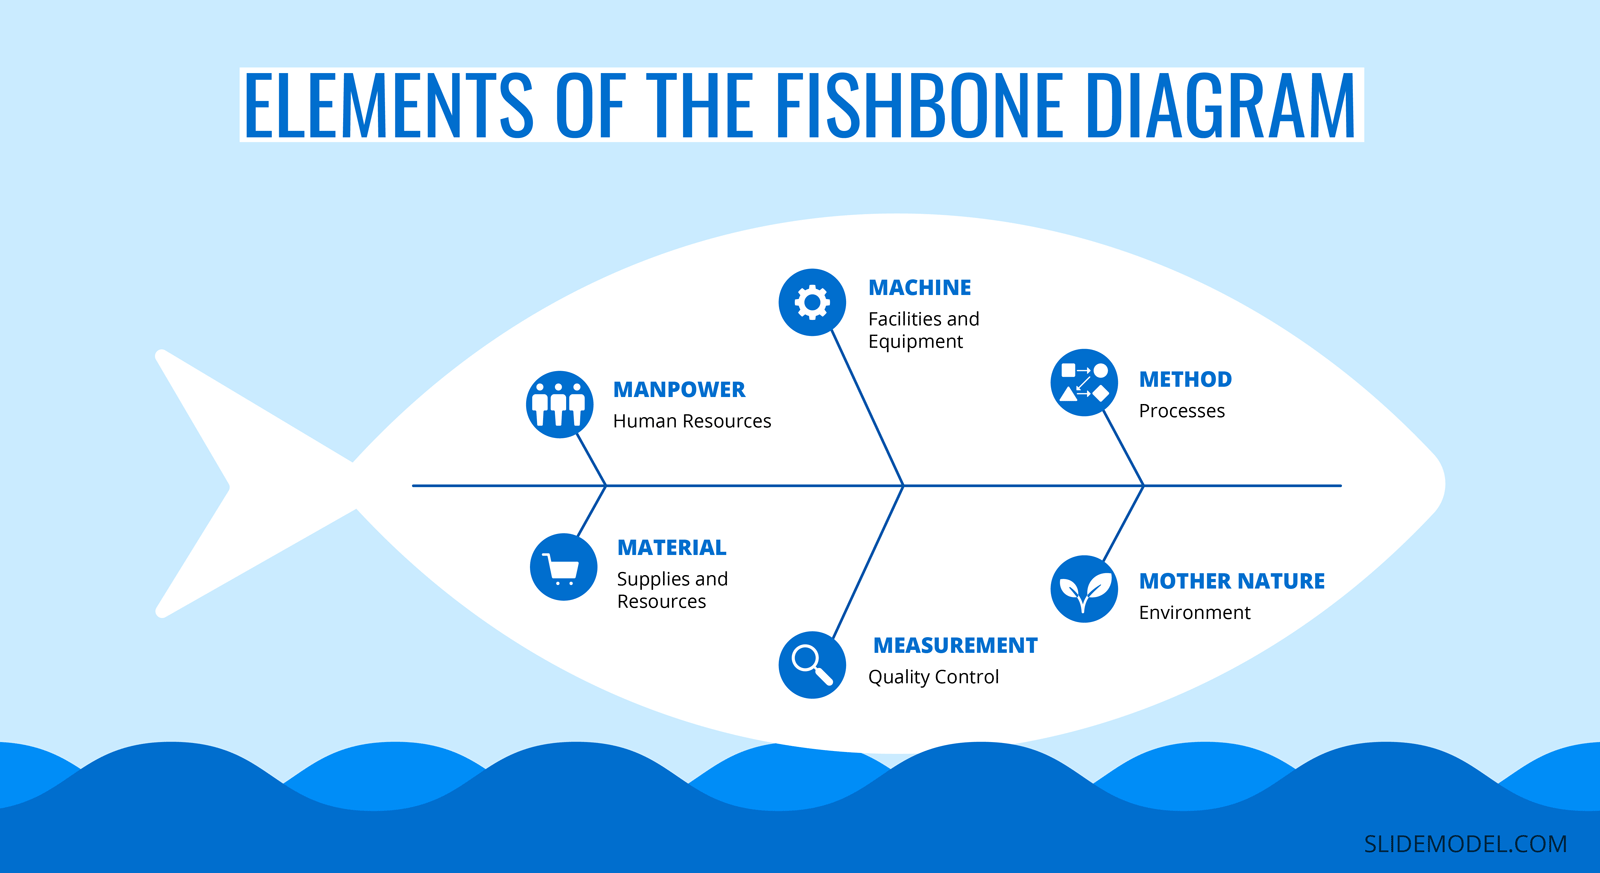
Manpower: Human Resources
Anything related to people that are involved with the process relevant to the problem statement. Manpower commonly includes operators, employees, maintenance teams, supervisors, and quality control specialists.
Machine: Facilities and Equipment
This includes machines used in the process, including all facilities and equipment that may be causing the problem. The causes can be associated with maintenance, usage, and assembly of equipment that could result in bottlenecks.
Method: Processes
Any standardized methods set by supervisors might not be followed by operators accurately. The instructions need to be evaluated to ensure all processes are clear to the team and all areas of operation are described in detail.
Material: Supplies and Resources
All supplies and resources used in the production or process are reviewed to determine their effect. Material defects, mishandling, low quality, and lack of proper inspection can result in problems further along the process.
Measurement: Quality Control
Techniques and tools used to measure quality standards are also a part of the fishbone analysis. Parts and processes need to be analyzed to determine whether they meet the quality control standards set in place, and all problems need to be reviewed to determine the root cause of the problem.
Mother Nature: Environment
When searching for a root cause, the environment plays a crucial role in production processes, whether it is the external factors of the production area or the environmental conditions such as temperature, humidity, pressure, etc. The production facilities must be able to handle the environment without having any negative impact on the production or process for a streamlined workflow.
How to Construct a Fishbone Diagram for Cause and Effect Analysis?
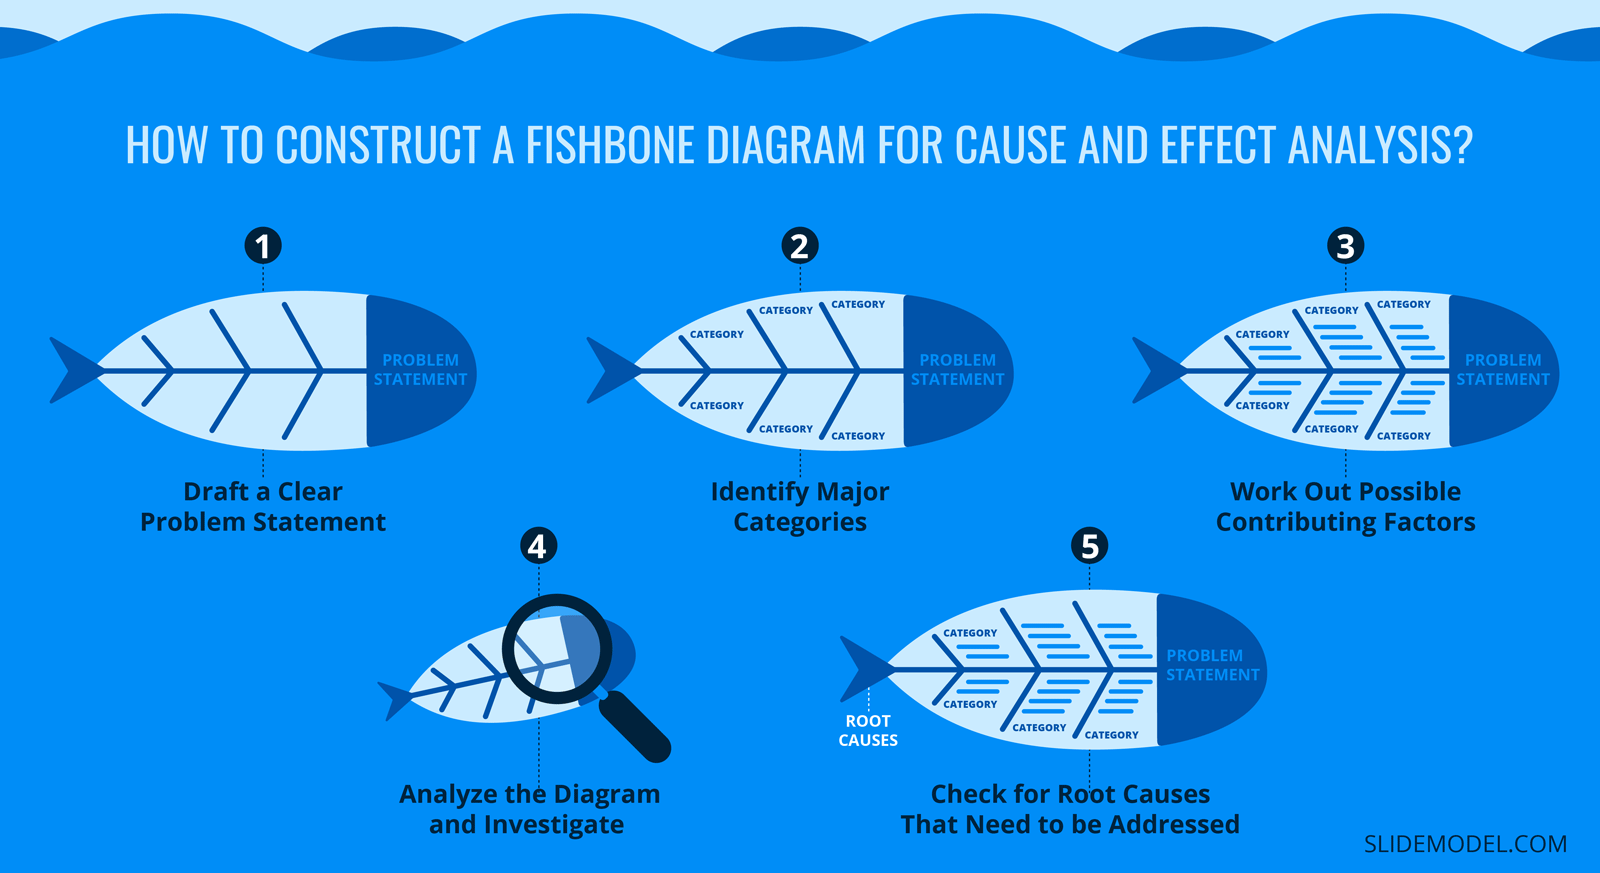
Draft a Clear Problem Statement
For constructing a fishbone diagram, a clear problem statement needs to be drafted to test causes in order to determine what’s causing the problem and present a solution.
During analysis, the problem statement is written at the right side of the fishbone, at the head of the fish. The problem is the effect, and the causes need to be categorized in the next step.
Identify Major Categories
Major categories that are involved in the process or procedure relevant to the problem need to be identified. The categories are connected to the backbone of the fish diagram.
Commonly, the 6M’s, as stated above, are used for the categorization of the causes, while the number of categories is not limited, and it can include different categories relevant to the problem.
Work Out Possible Contributing Factors
After categorization, possible contributing factors need to be brainstormed and attached to the appropriate category or the “rib.” Managers can create a list of causes and then attach them to the relevant rib, or some may find it easier to place ideas on the respective category as they are generated.
Some causes could also fit into multiple categories, which helps analyze the factor from different perspectives. Keep asking what’s causing the problem and evaluate each factor. The fishbone branches out into multiple ribs as more causes come to light.
Analyze the Diagram and Investigate
When the fishbone diagram is constructed with the problem, categories, and causes, the analysis of the diagram is required to understand why that factor is occurring. This can be done by asking the team why questions, typically known as the five whys and is usually represented in a root cause analysis presentation.
Asking five questions is usually enough to reach a root cause, while in some factors, more than five questions may be needed.
Check for Root Causes That Need to be Addressed
Lastly, as the root causes come to light after analyzing the fishbone diagram, they need to be addressed to minimize or eliminate the problem. What’s next is generating workable solutions that need to be implemented as a top priority.
Alternative to Fishbone Diagram
A popular alternative to the fishbone diagram is the 5 whys method that is used for conducting a root cause analysis. The quality control tool can be used individually and even in combination with the fishbone diagram to determine the problem, its origin, why it happened, and most importantly, figure out how the chances of the problem recurring can be reduced.
The 5 whys fishbone analysis helps determine the causes of the problem and finds out the root causes. A set of 5 why questions lead the team to dig deeper into the problem, speed up the problem-solving process, and enable them to take action to prevent it from happening in the future.
Examples of Fishbone Diagram
Problem Statement:
In the first quarter of 2022, reported defects in production increased to 20%.
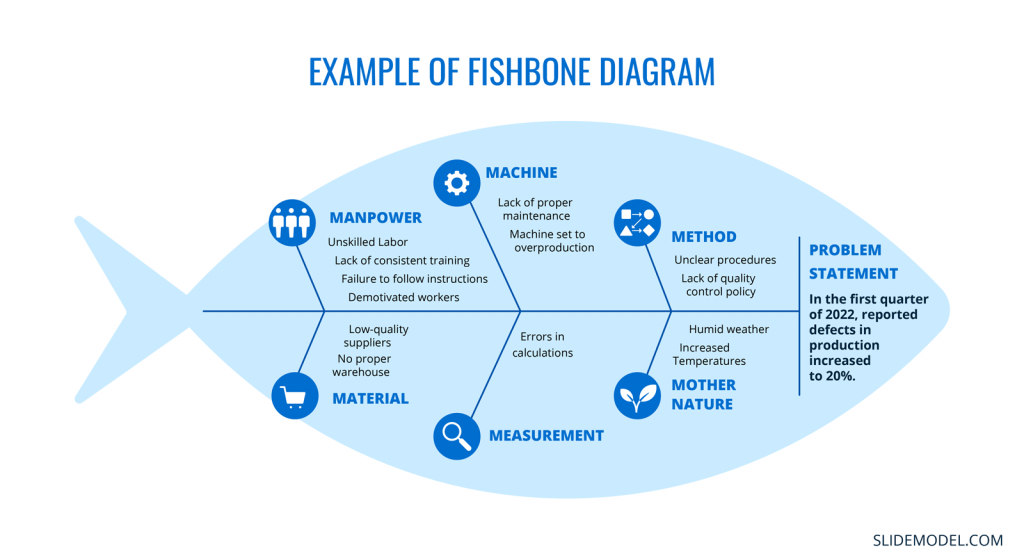
Manpower:
- Unskilled Labor
- Lack of consistent training
- Failure to follow instructions
- Demotivated workers
Method:
- Unclear procedures
- Lack of quality control policy
Measurement:
- Errors in calculations
Machine:
- Lack of proper maintenance
- Machine set to overproduction
Materials:
- Low-quality suppliers
- No proper warehouse
Mother Nature:
- Humid weather
- Increased Temperatures
Problem Statement:
Increase in customer complaints about product quality.
People:
- Lack of training for employees
- Inadequate customer service skills
- Employee turnover affecting quality
Process:
- Inefficient quality control procedures
- Lack of clear product assembly guidelines
- Inadequate testing at different production stages
Product Design:
- Design flaws leading to defects
Equipment:
- Outdated machinery causing defects
- Lack of preventive maintenance leading to quality issues
Problem Statement:
Delays in project completion.
People:
- Insufficient skilled project team
- Poor communication among team members
- Inadequate project management experience
Process:
- Unclear project scope and objectives
- Inadequate project planning and scheduling
- Lack of risk assessment and mitigation
Resources:
- Inadequate budget allocation for project
- Limited availability of necessary resource
- Unreliable suppliers causing delays
External Factors:
- Regulatory changes impacting project
- Delays caused by adverse weather
Problem Statement:
Decrease in website traffic.
People/Skills:
- Lack of SEO knowledge among content creators and editors
- Inadequate social media marketing skills
Content Quality:
- Outdated and irrelevant website content
- Inadequate use of keywords for SEO
- Poorly written and unengaging content
Technical Issues:
- low website loading due to large images
- Broken links and frequent errors
- Ineffective mobile responsiveness
Marketing Strategies:
- Inconsistent promotion across platforms
- Lack of engagement with the target audience
- Ineffective use of online advertising
Problem Statement:
High employee turnover rate.
Work Environment:
- Poor workplace culture and lack of employee engagement
- Inadequate work-life balance
Management Practices:
- Ineffective leadership and communication
- Lack of recognition and rewards
- Inadequate opportunities for growth
Compensation:
- Below-market salaries and benefits
- Inadequate performance-based incentives
Recruitment and Hiring:
- Inaccurate job descriptions and expectations
- Insufficient screening of candidates
- Lengthy and inefficient hiring process
Pros and Cons of Fishbone Diagrams
Fishbone diagrams, also known as Ishikawa diagrams or cause-and-effect diagrams, are powerful tools for analyzing and solving complex problems. However, like any methodology, fishbone diagrams come with their own set of advantages and disadvantages. Let’s explore the pros and cons of using fishbone diagrams in problem-solving and decision-making processes.
Pros of Fishbone Diagrams
- Visual Clarity: Fishbone diagrams provide a visual representation of the causes and effects of a problem, making it easier to understand the relationships between different factors.
- Holistic Analysis: They encourage comprehensive analysis by considering multiple categories of potential causes, ensuring a more thorough exploration of the problem.
- Structured Approach: Fishbone diagrams offer a structured framework for organizing thoughts and ideas, facilitating more organized problem-solving sessions.
- Collaborative Tool: They promote collaboration among team members by facilitating brainstorming sessions and encouraging diverse perspectives.
- Identification of Root Causes: Fishbone diagrams help in identifying the root causes of a problem, rather than just addressing its symptoms.
- Problem Prioritization: By categorizing causes and effects, teams can prioritize which issues to tackle first, leading to efficient problem-solving.
- Easy Communication: Fishbone diagrams provide a clear visual representation that can be easily shared with team members and stakeholders, enhancing communication.
- Data-Driven Analysis: They encourage data collection and analysis, enabling teams to make informed decisions based on evidence.
Cons of Fishbone Diagrams
- Simplicity vs. Complexity: While fishbone diagrams work well for relatively simple problems, they might not be suitable for extremely complex issues with numerous interrelated causes.
- Subjective Interpretation: The process of categorizing causes and effects might involve subjective judgment, potentially leading to biased analysis.
- Overemphasis on Quantity: Focusing on listing numerous causes might divert attention from the most critical factors that require immediate attention.
- Time-Consuming: Constructing a fishbone diagram requires time, particularly when involving a large team. In time-sensitive situations, this can be a drawback.
- Limited to Known Causes: Fishbone diagrams rely on existing knowledge and may miss out on new or unexpected causes that were not previously considered.
- Complex Presentation: As the diagram becomes more intricate with more causes and categories, it might become difficult to interpret, defeating its purpose.
- Lack of Concrete Solutions: While fishbone diagrams identify causes, they don’t necessarily provide solutions. Further analysis is often required to determine the best course of action.
- Not a Standalone Solution: Fishbone diagrams are best used in conjunction with other problem-solving tools and methodologies for a well-rounded approach.
How to Present a Fishbone Analysis?
The purpose of a Fishbone Diagram Template is to inform the audience about the various problems affecting the company in a specific industry, and in turn, persuade them to present a plan of action to solve those problems.
A fishbone diagram can be visualized on paper, whiteboards, and even digitally with the help of digital whiteboards and presentations.
We recommend using Slide Model’s professionally designed 100% editable templates for PowerPoint and Google Slides to conduct a fishbone analysis.
From flat modern elements to a 3D perspective fishbone diagram, several different templates, including root cause analysis fishbone diagrams, can be used for conducting a root cause analysis, addressing problems, and presenting a solution to the team.
Templates for Presenting a Fishbone Diagram
Here we have compiled a list of 100% editable fishbone diagram presentation templates that you can use for preparing presentations for cause & effect analysis.
1. Fishbone Infographic PowerPoint Diagram
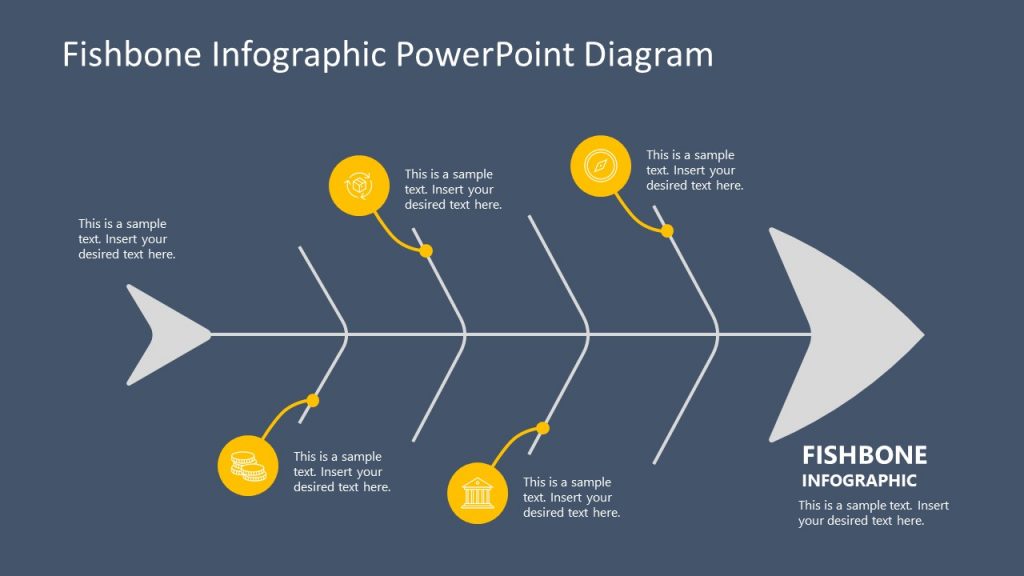
A fishbone infographic PowerPoint template is a creative depiction of the Ishikawa diagram. The bone structure is made for presenting 4 categories, identifying causes, and analyzing their effects to get to the root of any problem.
2. Fishbone Diagram Template 3D Perspective
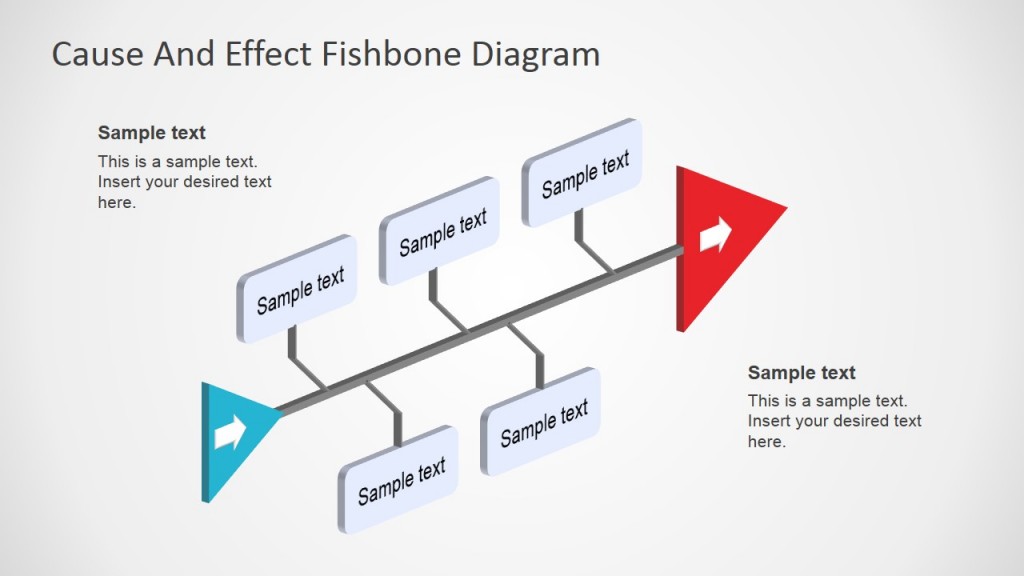
3D perspective fishbone template for PowerPoint and Google Slides is for conducting a cause and effect analysis in an appealing way and determining the root cause of the problem. Most likely factors can be presented with a proper analysis, while less impactful causes can be trimmed to reach the conclusion.
3. Animated 3D Fishbone PowerPoint Template
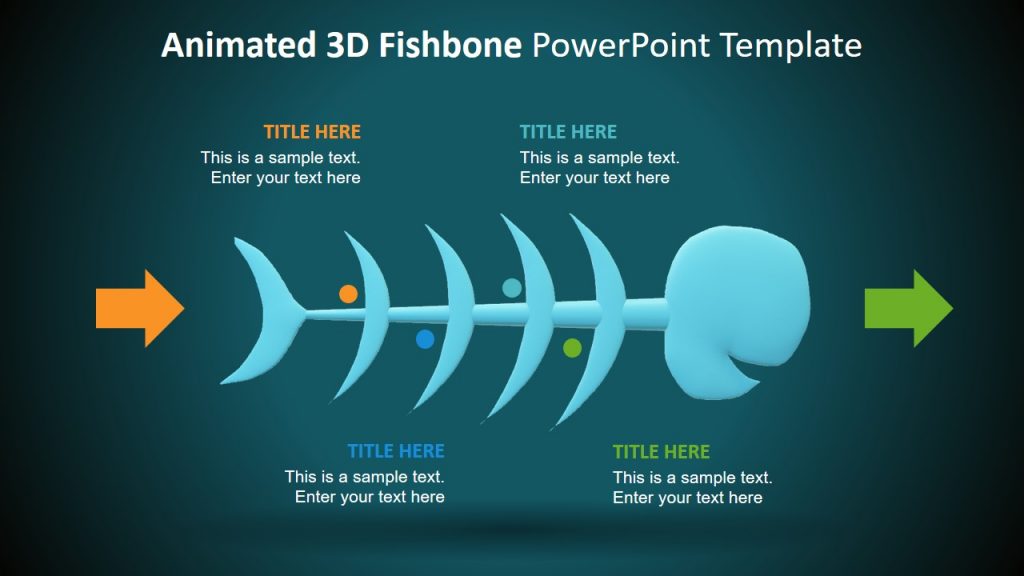
Another 3D template for the fishbone analysis that is fully compatible with PowerPoint and Google Slides can help managers present the root cause in any professional setting. The fishbone diagram is combined with 3D animations to create a realistic perspective making the RCA analysis interesting for the team.
4. Flat Fishbone Diagram for PowerPoint
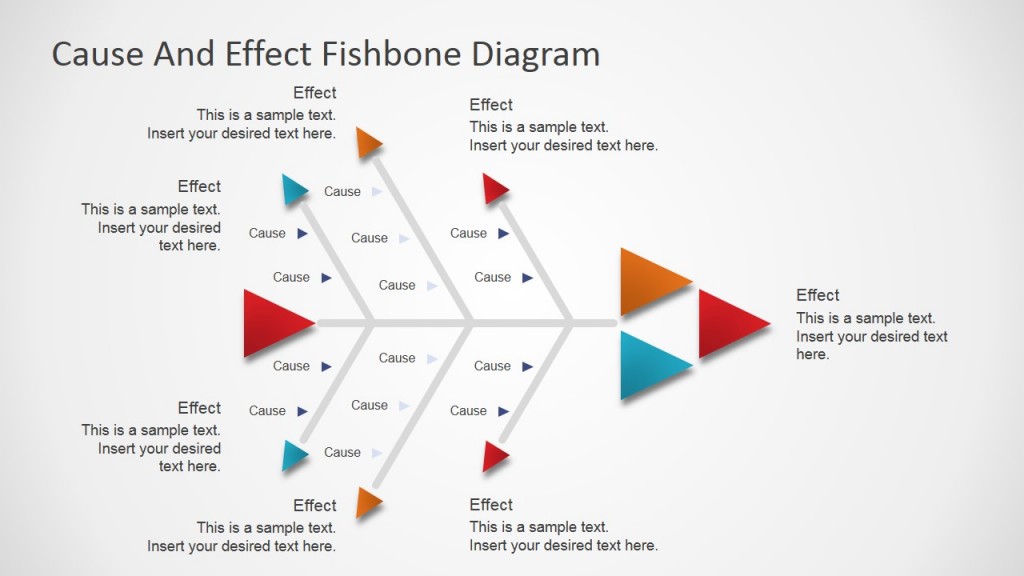
This flat fishbone template is a professional presentation diagram for determining factors that are contributing to the problem. The analysis can be presented and summarized easily, while the template can also be used during real-time brainstorming sessions to create the fishbone diagram.
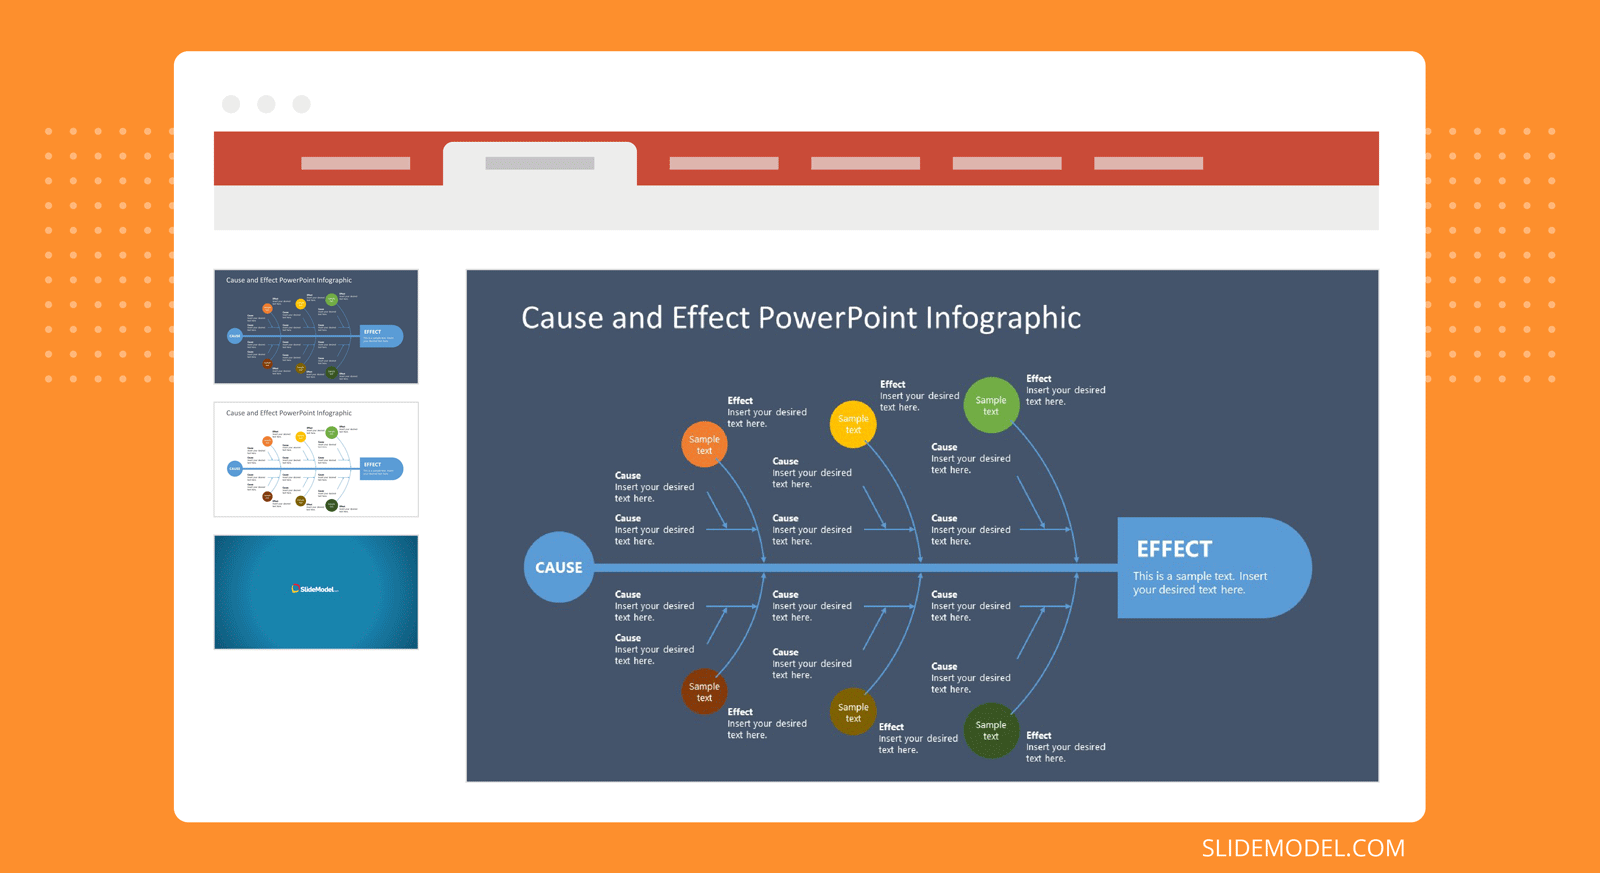
5. Cause and Effects PowerPoint Infographic Template
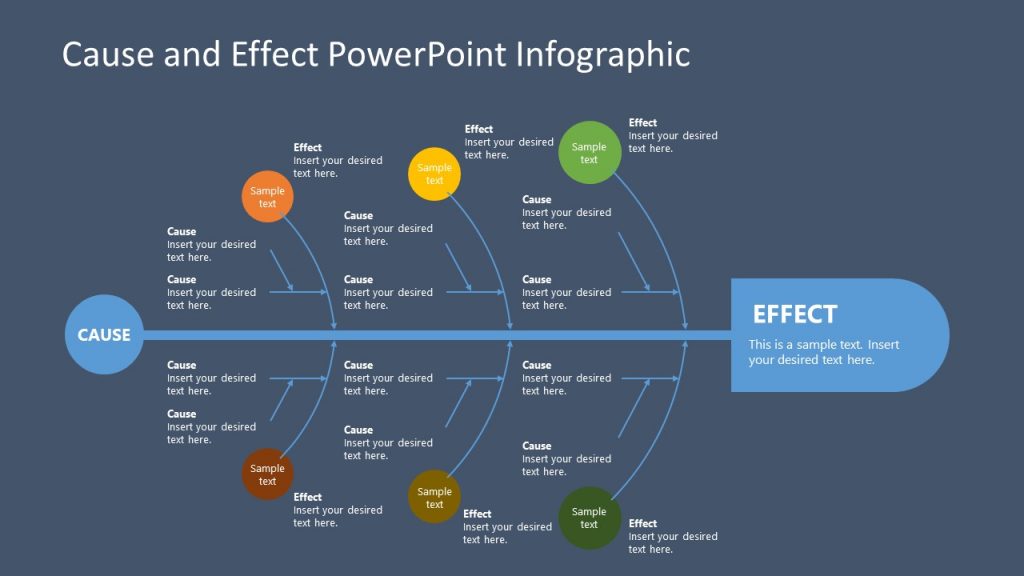
This cause and effect analysis template is for presenting a comprehensive look at the categories and their causes to determine the root cause of the problem. Fully customizable and compatible with PowerPoint and Google Slides, the template is a flat-vector-based Ishikawa diagram that enables teams to discuss project issues and drill down to the root cause of the problem.
6. Realistic Fishbone Diagram Template for PowerPoint
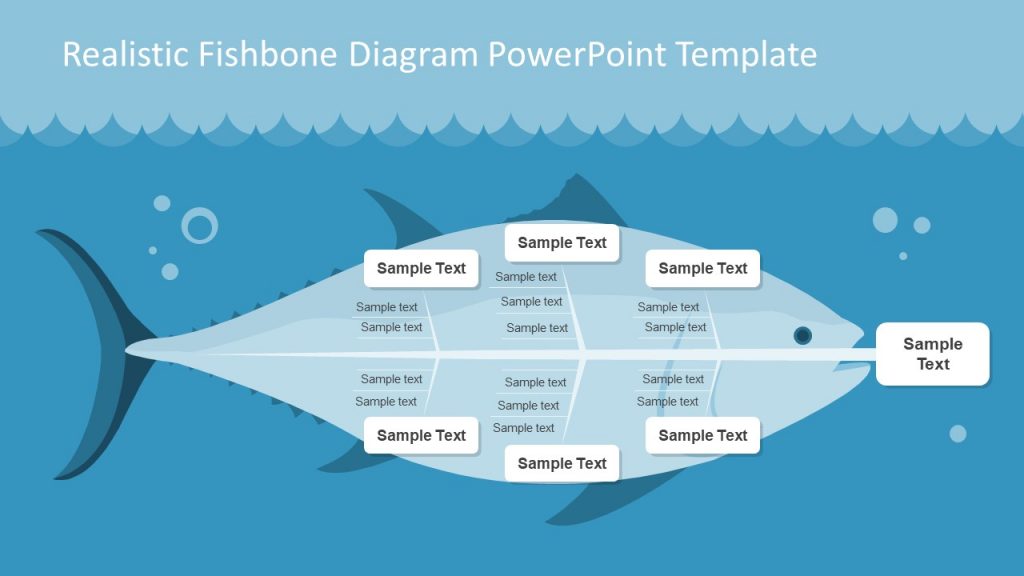
The realistic fish illustration in this fishbone template for PowerPoint and Google Slides can be used for analyzing problems, identifying root causes, and presenting solutions. Complex problems can be broken down to assist users in brainstorming and coming up with creative solutions for solving the problem.
7. Fishbone Template for PowerPoint
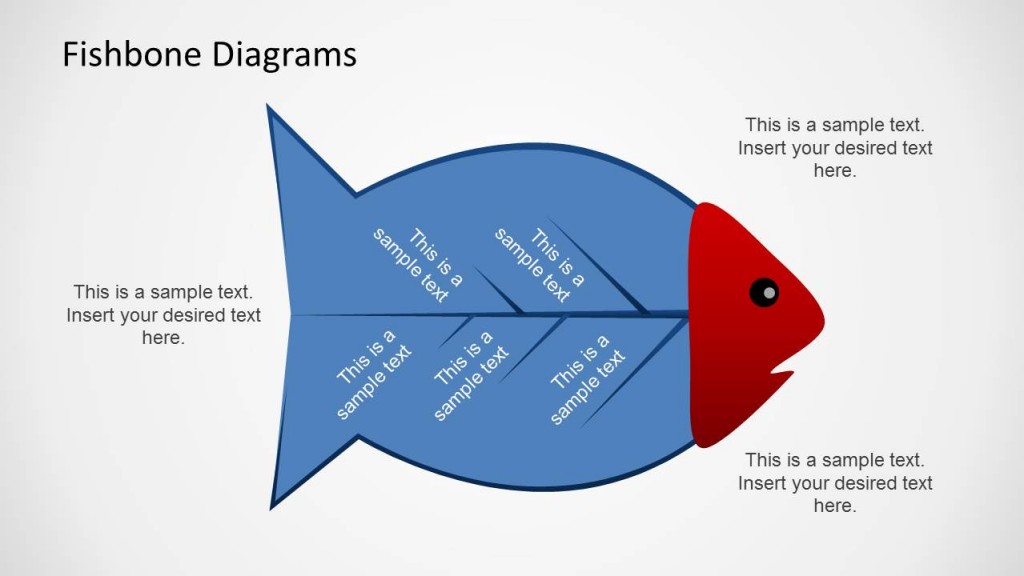
Another creative presentation template for the fishbone diagram that is helpful for conducting a root cause analysis (RCA) and presenting the cause and effect analysis results. The simple fish design makes the presentation engaging and memorable for the audience.
Conclusion
The fishbone analysis is a powerful tool for brainstorming potential causes of any problem and drilling down to the root cause for presenting a solution. It gives managers and teams a holistic look at the process categories and their issues and enables them to focus on areas that need to be fixed in order to minimize or eliminate the problem.
Our 100% editable fishbone diagram templates and root cause analysis templates made for PowerPoint and Google Slides are helpful for making professional presentations that can be used during brainstorming sessions, and also when presenting the solution after conducting the root cause analysis.
The simple-to-use, visual problem-solving tool is made to take corrective action with accurate analysis that can only be done while looking at the whole picture and improving processes by providing a framework for solving complex problems. Alternatively, check our article about how to make a fishbone diagram in PowerPoint.