Database management is a crucial asset for digital platform development, and even if some can consider that a simple task, the reality is that a complex structure is required for proper functionality. Part of the planning process in database management is creating Entity Relationship Model Diagrams, as it gives the necessary information to teams on which actions should be taken.
In this article, we will explain in detail what an Entity Relationship Model is and how to understand the different components that make it. Without further ado, let’s get started.
Table of Contents
- What is the Entity-Relationship Model (ER) Model?
- Uses of ER Diagrams
- Main Components of the ER Diagram
- Symbols of ER Diagram
- What is the difference between an ER Diagram, a Flow Diagram, and a UML Diagram?
- How to Create an Entity Relationship Model Diagram
- Final Words
What is the Entity-Relationship Model (ER) Model?
An Entity-relationship diagram (ERD) or ER diagram is created to visualize data and relationships in a system. In simple terms, an ER diagram is a visual representation of the flow of information and logical structure in a data model. The ER model uses entities, attributes, and relationships using specific symbols to represent such an architecture.
ER diagrams are used to visualize database structures, as well as to understand the flow of data and system requirements. ER diagrams also serve as a reference to help improve and redesign systems, as well as for troubleshooting and debugging.
History of ER Models & Diagrams
While there have been many contributors to the ER model, Taiwanese American computer scientist Peter Pin-Shan Chen is mainly credited with developing the entity-relationship model in 1976. The original paper by Chen is cited as a reference for the model itself. He is deemed one of the pioneers of using the ER model in the modeling and designing of software and information systems. Before Chen’s paper, the basic idea of entity-relationship was not well known. Chen’s initial work became the basis for formalizing the ER model and introducing it in academic literature.
During the 60s and 70s, various other individuals also worked on an approach similar to Chen’s. This resulted in Charles Bachman developing a data structure diagram named after him. In contrast, A.P.G. Brown and James Martin contributed to the Unified Modeling Language (UML) commonly used in software design. ER diagrams also have different notation styles named after Chen, Bachman, and Martin (among others).
Uses of ER Diagrams
ER Model diagrams are a great way to visualize the relationships between entities. What are the uses of ER diagrams? Here are some other possible uses.
Database Design
Entity-relationship diagrams are used in database design. Software engineers often use ER diagrams as a starting point for determining the system requirements for an information system. It is also used for modeling databases.
Database Troubleshooting
ER models are also used for analyzing databases to troubleshoot problems. It is used as a reference point to understand what might be the cause of a problem and to find a solution to the issue.
Business Information Systems
Business processes using fielded data benefit from relational databases. Hence, ER diagrams are used for analyzing and designing business information systems. Business processes can be streamlined using ER models.
Business Process Re-engineering (BPR)
ER models also help improve results and uncover information with ease. Entity-relationship models can also help in Business process re-engineering and modeling new databases.
Research
Since research often requires structured data, ER models can be pretty helpful in creating databases that can aid data analysis.
Education
The use of databases for educational purposes has been increasing over the past few years. Databases are used for storing educational data, which can be easily retrieved, making ER models quite helpful in structuring such a database.
Main Components of the ER Diagram
Entity-relationship diagrams consist of entities, the relationship between entities, and the characteristics of entities (attributes).
Entity
An ‘entity’ in an ER diagram is something that can be defined. The easiest way to understand entities is to consider them as nouns. This can include a person, concept, event, or even an object. These are entities for which data can be stored. For example, a customer or product (e.g., a watch) can have data stored related to it.
Relationship
Entities act upon each other, forming relationships. For example, a customer might order a watch. The act of making a purchase is the relationship between these two entities.
Attribute
An attribute is associated with an entity. Attributes can be a single value or multi-value. For example, a single-value attribute might include a phone number, and a client entering multiple phone numbers would be a multi-value attribute.
Cardinality
The ER model depicts cardinality. This refers to the highest number of times an entity can relate to another entity’s instances. The cardinality ratio describes a connecting relationship for two entity sets. The cardinalities can be many-to-many, one-to-one, or one-to-many.
One-to-one: Person — Social security number (a person must have a social security number).
One-to-one (optional on one side): — Driving license (a person might have a driving license).
Many-to-one: Person — City (many people might live in the same city).
Many-to-many (optional on both sides): Person — Watch (a person may own a watch).
One-to-many: Order — Item (an order contains at least one item).
Many-to-many: Course — Subscriber (subscribers subscribe to various online courses).
Symbols of ER Diagram
Entity-relationship diagram symbols are represented across various notation styles. Different notation styles include Chen’s notation style, Bachman style, Barker style, IDEF1X style, and Crow’s Foot style.
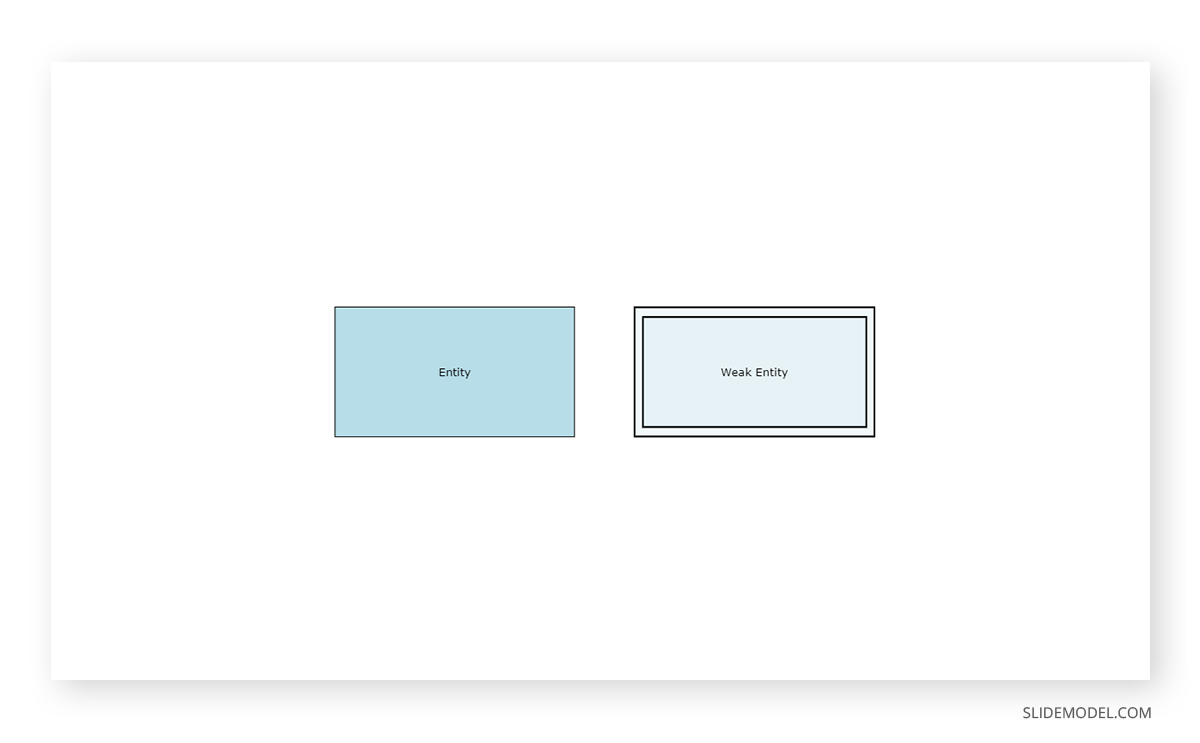
Rectangles: In ER diagrams, rectangles are used for entities. Depending on the notation style, an entity independent from other entities may be defined as a rectangle. A weak entity, dependent on some other entity type, might be depicted with a rectangle inside a rectangle. Similarly, an associative entity might be represented as a diamond shape within a rectangle. Associative entities contain attributes and relate instances of different entity types.
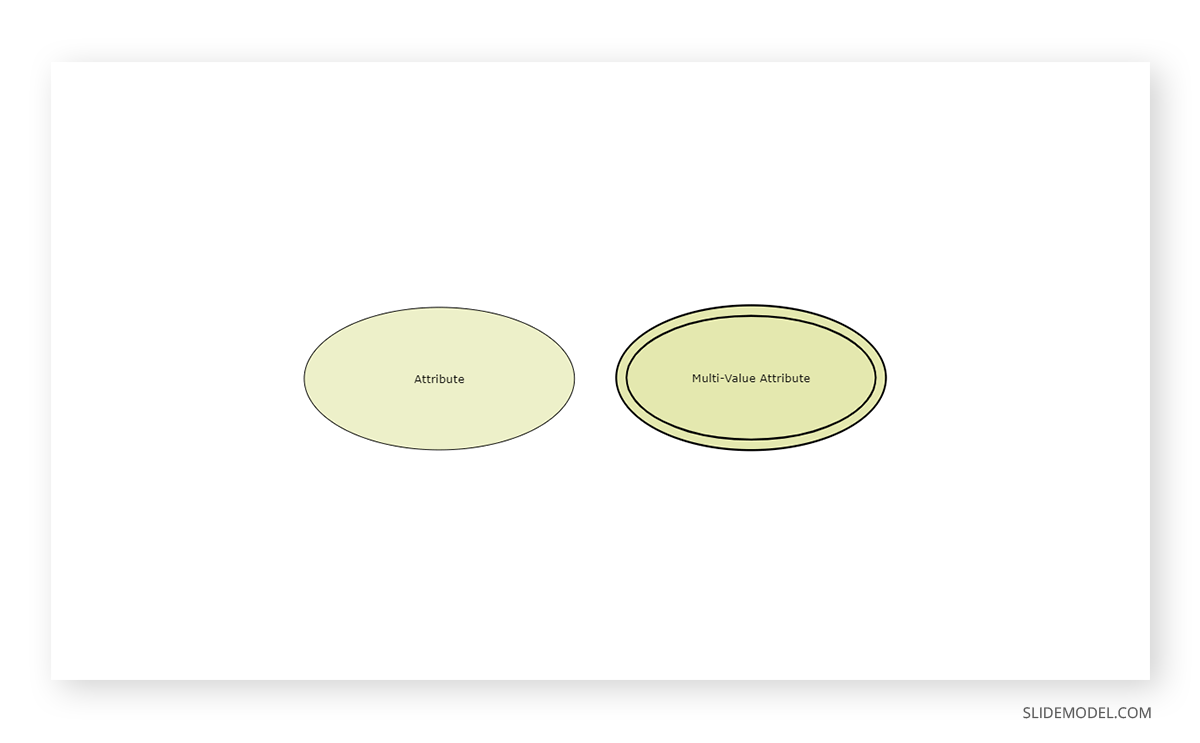
Ellipses: Elipses in an Entity-relationship model represent attributes.
Double Ellipses: These represent multi-valued attributes.
Dashed Ellipses: Dashed-line ellipses express derivate attributes.
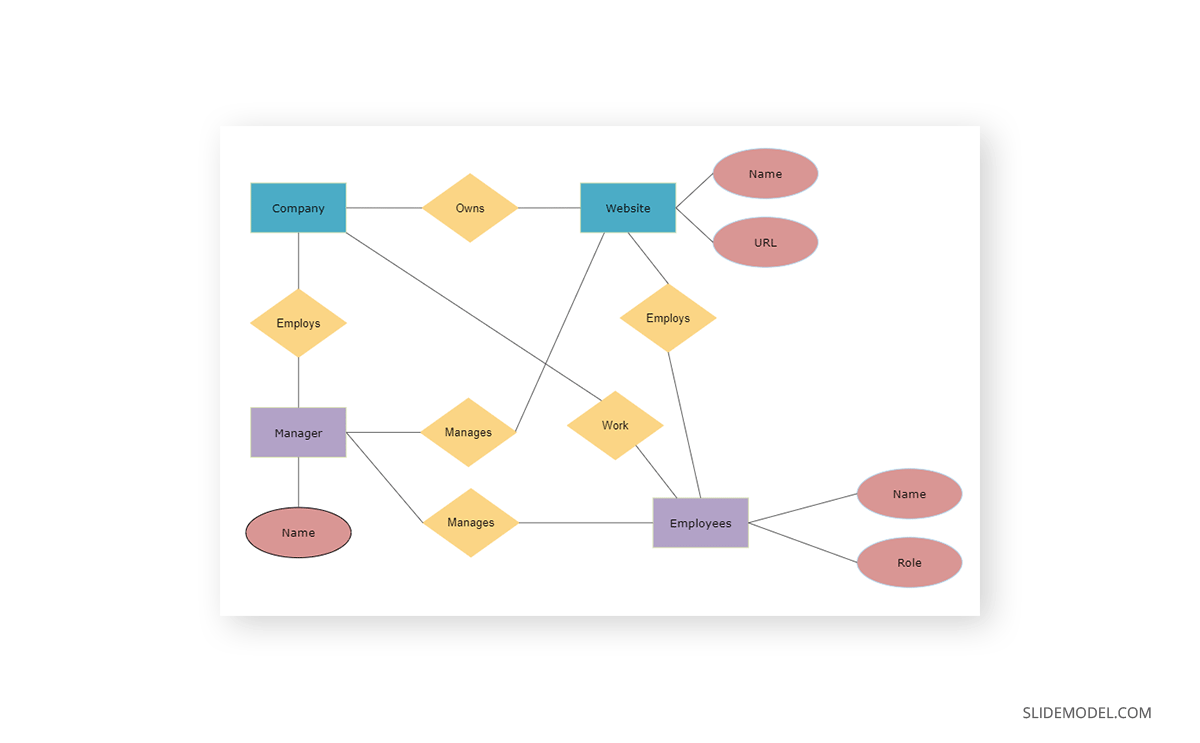
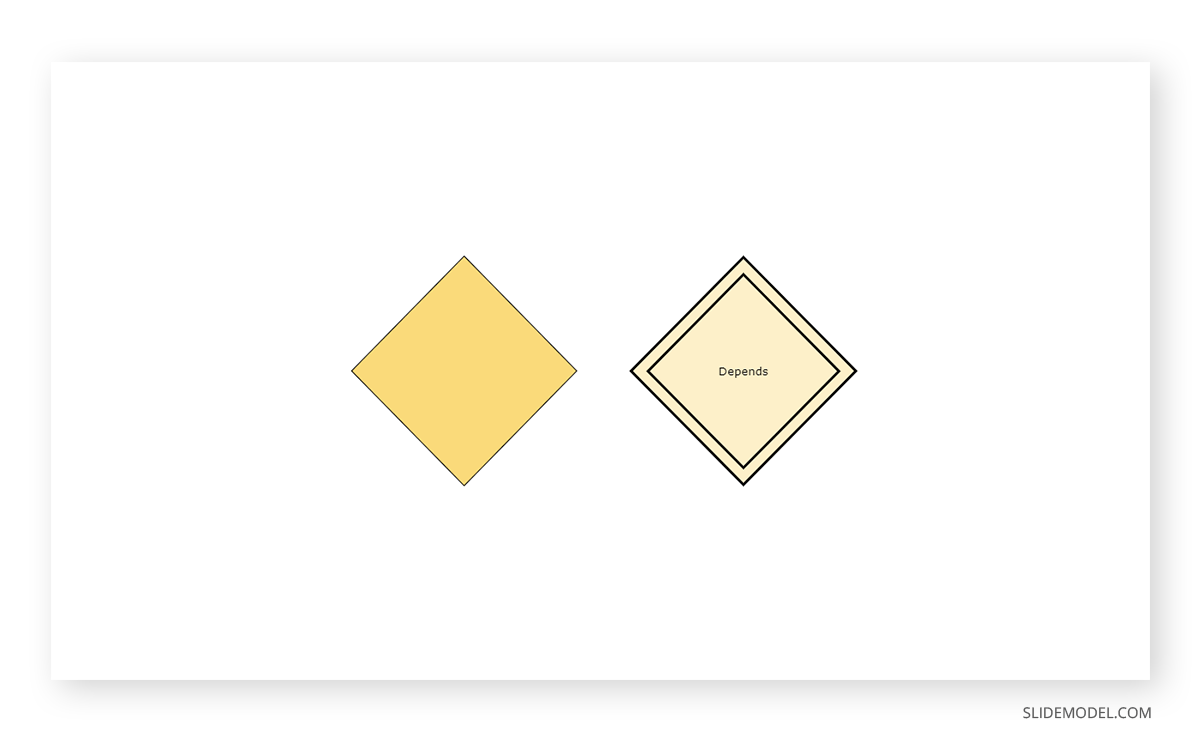
Diamonds: Relationship types are represented in ER diagrams using diamonds. Simple diamonds express a strong relationship, whereas double diamonds are used for weak relationships. Using a diamond inscribed in a rectangle speaks of an associative entry.
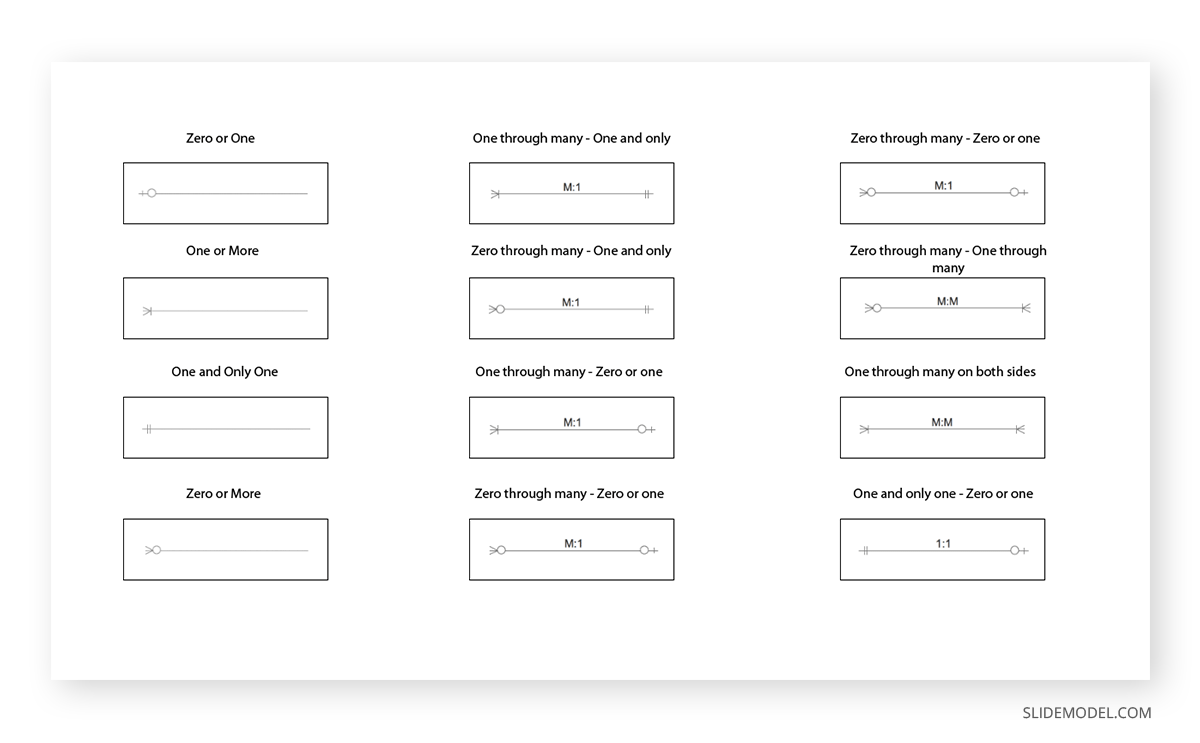
Lines: ER models depict links between attributes to entity types and between entity types and other relationship types. Below is an image of the Crow’s Foot notation for ER Model Diagram.
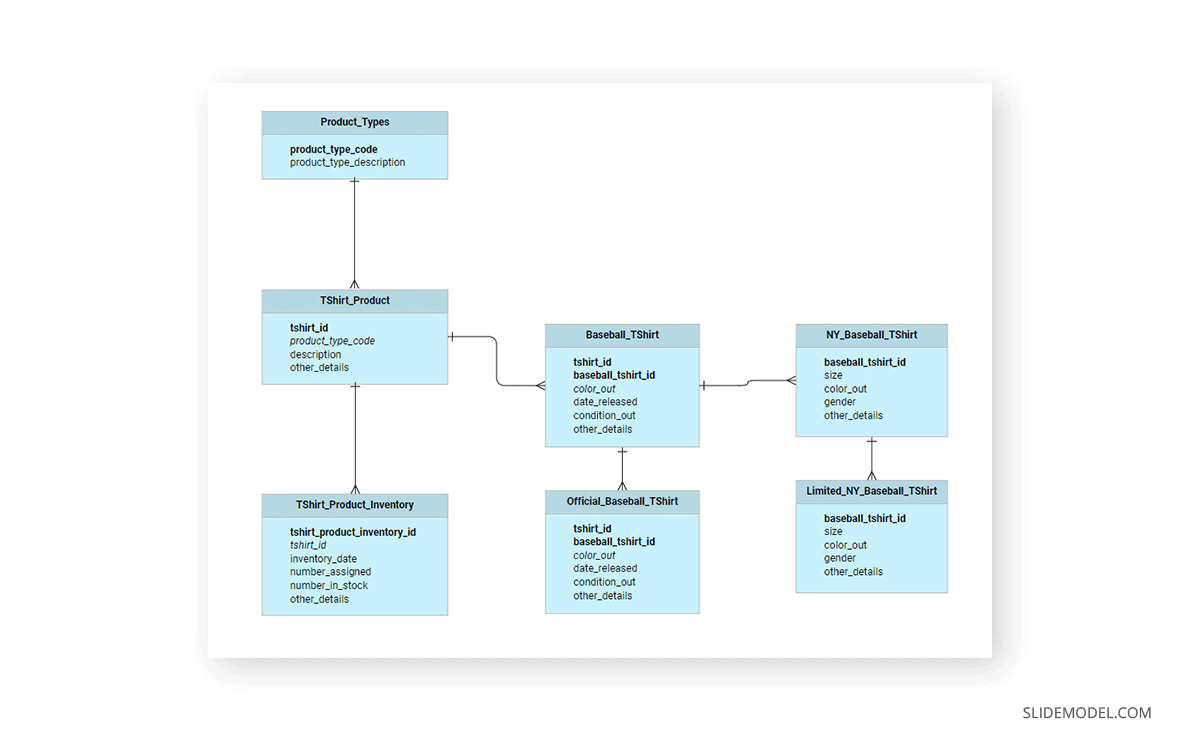
Keys: These are used for underlining attributes. Keys in ER diagrams are a way to categorize attributes. These keys also link tables in a database in an efficient manner. A Primary Key is linked to only one instance of an entity, whereas Foreign Keys are created when an attribute is associated with another entity. This might include relationships like one-to-one or one-to-many.
What is the difference between an ER Diagram, a Flow Diagram, and a UML Diagram?
An ER diagram, or Entity Relationship diagram, is a graphical representation of the relationship between entities in a database. Flow diagrams, on the other hand, are used to visualize data flow through a system. And finally, UML diagrams are used to model the structure of a system. So what’s the difference between these three types of diagrams? First, let’s take a closer look at ER diagrams.
As we mentioned before, ER diagrams are used to visualize the relationship between entities in a database. In an ER diagram, each entity is represented by a rectangular box, and the relationships between entities are represented by lines that connect them. Flow diagrams, on the other hand, are used to visualize the flow of data through a system. In a flow diagram, each process is represented by a rectangular box, and the data flowing between processes is represented by arrows. Finally, UML diagrams are used to model the structure of a system. In a UML diagram, each component of the system is represented by a rectangular box, and the relationships between components are represented by lines that connect them.
As you can see, there are some similarities between these three types of diagrams. However, each type of diagram has its own specific purpose and use case. When choosing which type of diagram to use, it’s essential to consider what information you want to visualize and what your specific goals are.
How to Create an Entity Relationship Model Diagram
If you would like to learn how to create Entity-relationship diagrams in a database or present them in your presentation, refer to the tutorials below.
How to Create an ER Diagram in MySQL Workbench
In MySQL Workbench, ER diagrams are also called Enhanced Entity-Relationship (EER) diagrams. This is because you can also interact and make design modifications to diagrams. Check this video to guide you through the process.
How to Create an ER Diagram in DBeaver
You can create an ERD in DBeaver to design a database. DBeaver allows users to create and view diagrams for tables and entire database schemas. This video here shows the process for making an ERD in DBeaver.
How to Create an ER Diagram Using PowerPoint and Google Slides
If you need to present an ER diagram to showcase a database model in the form of a PowerPoint presentation, you can use PowerPoint shapes to depict the various notations for the model.
The process can be quickly resumed here:
- To create an ER diagram using PowerPoint, first, open a blank PowerPoint slide.
- Next, click on the “Insert” tab and then select “Shapes.”
- After that, choose the shape that you want to use for your ER diagram.
- Finally, add the appropriate text to each shape and connect them accordingly.
You can also use a similar process to design an Entity-Relationship diagram in Google Slides.
Presentation templates that have similar icons that can serve as a base model are as follows:
Final Words
Entity-relationship diagrams help in the design of databases that now make up apps and services that regularly affect the way we buy products, do business, and perform daily tasks. Be it banking, social media, mobile apps, or even the way your school or employer enrolls you as a student or employee.
ER models can be essential not only for designing databases but also as a reference point to debug and redesign the database. Understanding Entity-relationship diagrams requires focusing on entities, relationships, and attributes in order to understand the workings of a database at the very basic level.
Entity-relationship models are a great way for beginners, as well as advanced database modeling experts as a starting and reference point. Furthermore, if you are someone engaged in research or deal with learning management systems, mobile apps, web services, and other database-driven platforms, understanding ER models can be of immense help to enhance your understanding of how data is stored and managed.