Designing and documentation is a process that entails mapping out the different steps from start to the very end. A single mistake in such a case can result in the entire system breaking down, resulting in a major loss of time, money, capital equipment, and might even threaten the safety of the manpower employed to carry out the process. Therefore, flowcharts are constructed to design and document such procedures. Let us show you the best ways to construct a flowchart, with FAQs, examples, design tips, and suggested PowerPoint flowchart templates.
Try our free flowchart maker to evaluate our templates and products.
What is a Flowchart?
A flowchart is a diagram used for representing workflow, programs, processes, and for representing algorithms. To make a flowchart, you have to go through various steps and ensure strict adherence to how each step is presented visually.
Typically, flowcharts follow a strict rule regarding the type of symbols used for representing each step. These symbols have specific meanings, representing the start, process, connectors, input, output, end, etc. These symbols are represented using different shapes such as a circle, diamond, oval, arrow, and the like.
Is it Flow Chart or Flowchart?
The term flowchart or flow chart are both used for diagrams that depict processes, workflow, programs, and computer algorithms using a set of symbols that have pre-defined functions. This diagrammatic representation is also known by other terms such as a flow sheet, flow diagram, workflow diagram, and business flow diagram.
Brief History of Flowcharts
The use of flowcharts to document processes can be traced back to the early 1920s. Flowcharts were the brainchild of American engineers Frank and Lillian Gilbreth. During 1921, both Frank and Lillian introduced the concept to the American Society of Mechanical Engineers (ASME), as flow process chart. These tools soon found their way to the curricula of industrial engineering and was used by other engineers. One such individual was Allan H. Mogensen, who during the 1930s, began training business people using the same tools. Similarly, Mogensen’s student, Art Spinanger, used the concept at Procter and Gamble to develop the ‘Deliberate Methods Change Program’.
What caught the attention of people from across different industries was the simplicity of using a flowchart. Even today, flowcharts are deemed as diagrams used for documenting and representing simple processes. In recent years, flowcharts have evolved into other forms including Unified Modeling Language (UML) activity and Event-driven Process Chain (EPC) diagrams.
What is the Purpose of a Flowchart?
Flowcharts are used for the documentation, design, and depiction of a process, program, or algorithm. Flowcharts help map the aforementioned, with a visual map of the flow, and control of resources. Flowcharts are used to communicate processes in various fields. A presentation flowchart can be used as a tool to break down information and clearly explain it to an audience, making it easy to understand and follow. The purpose and fields across which flowcharts are used are explained in detail below.
Different Types of Flowcharts
Different types of flowcharts can be divided into four broad categories. These include:
- Document flow charts
- Data flow
- System flow
- Program flow charts.
There are also other types of flow chart categories, such as swim lane, EPC, workflow, SDL, DFD diagram, etc.
While flowcharts have been defined differently by various authors, the four broad categories that define flowcharts according to Alan B. Sterneckert in his book ‘Critical Incident Management’ in 2003 include the following:
1. Document Flowchart:
A document flowchart shows controls over document flow through a system. Such a chart is constructed from left to right, showing the flow of documents across business units.
2. Data Flow Chart:
Such a flowchart is primarily used to show the channels through which data is transmitted rather than the flow of controls.
3. System Flowchart:
A system flowchart shows the physical or resource level controls. This type of chart displays the flow of data within a system and the decisions made to control events.
4. Program Flowchart:
As the name suggests, this type of flowchart shows the controls in a program used in a system.
Flowchart Symbols — Meaning of the Different Symbols in Flowcharts
Every flowchart symbol has a pre-defined meaning. Using these symbols in the right order at the correct part of the chart is essential to accurately depict the flowchart. Below is a list of common symbols used in a flowchart.
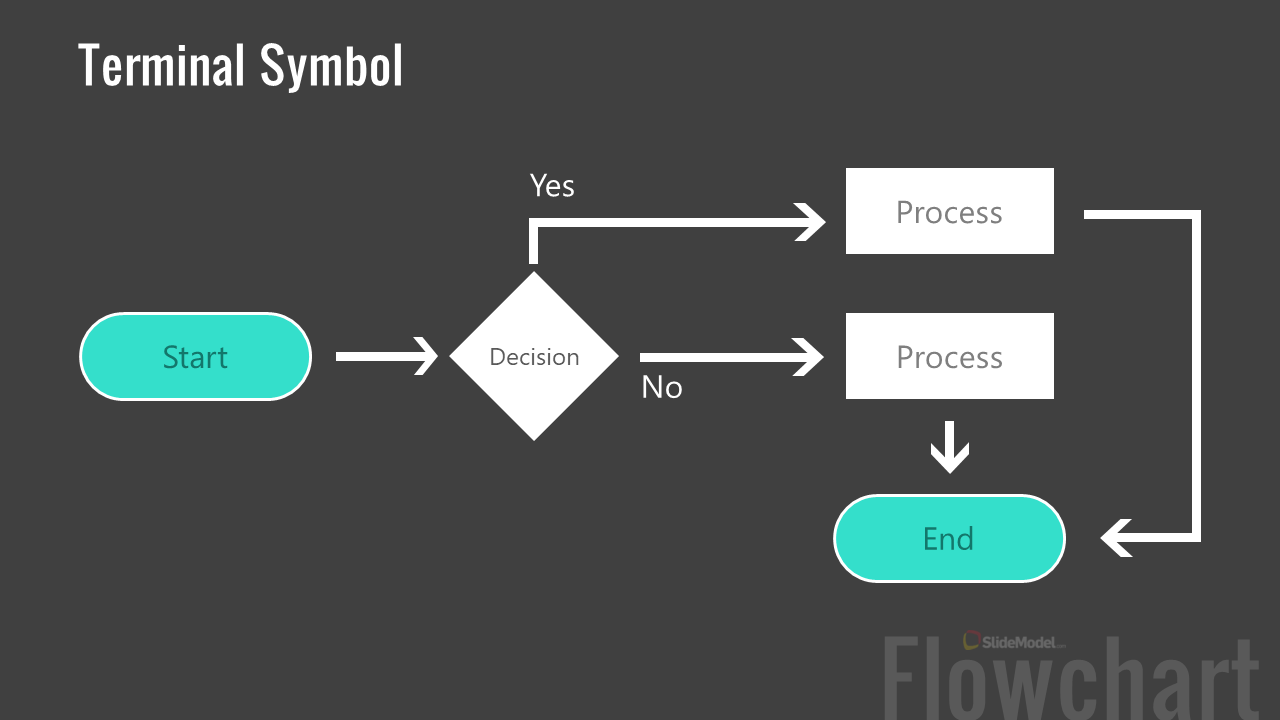
Terminal Symbol
A terminal is an oval or rounded rectangle shape used at the beginning and end of a flowchart. Terminals come with a word like ‘Start’ or ‘End’ to indicate the beginning or conclusion of a process. A terminal (a.k.a. Terminator symbol) might also come with a phrase, such as ‘Receive Product’ to explain the phase of the process. Sometimes it is also displayed as ‘Start’ or ‘Stop’.
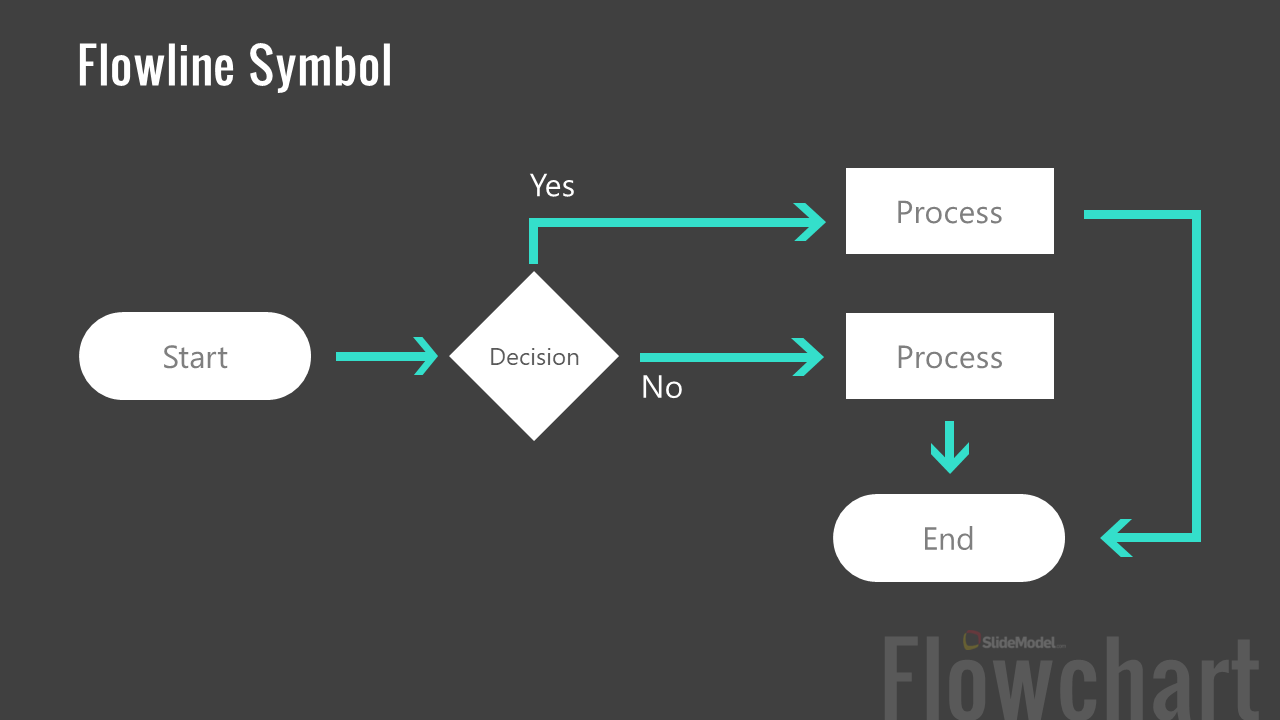
Flowline Symbol
A flowline shows the flow represented by various symbols by connecting one symbol to another via a line. If the process is not standard, arrowheads are added to flowlines. This might be the case when the flow is not in a standard format such as top to bottom or left to right.
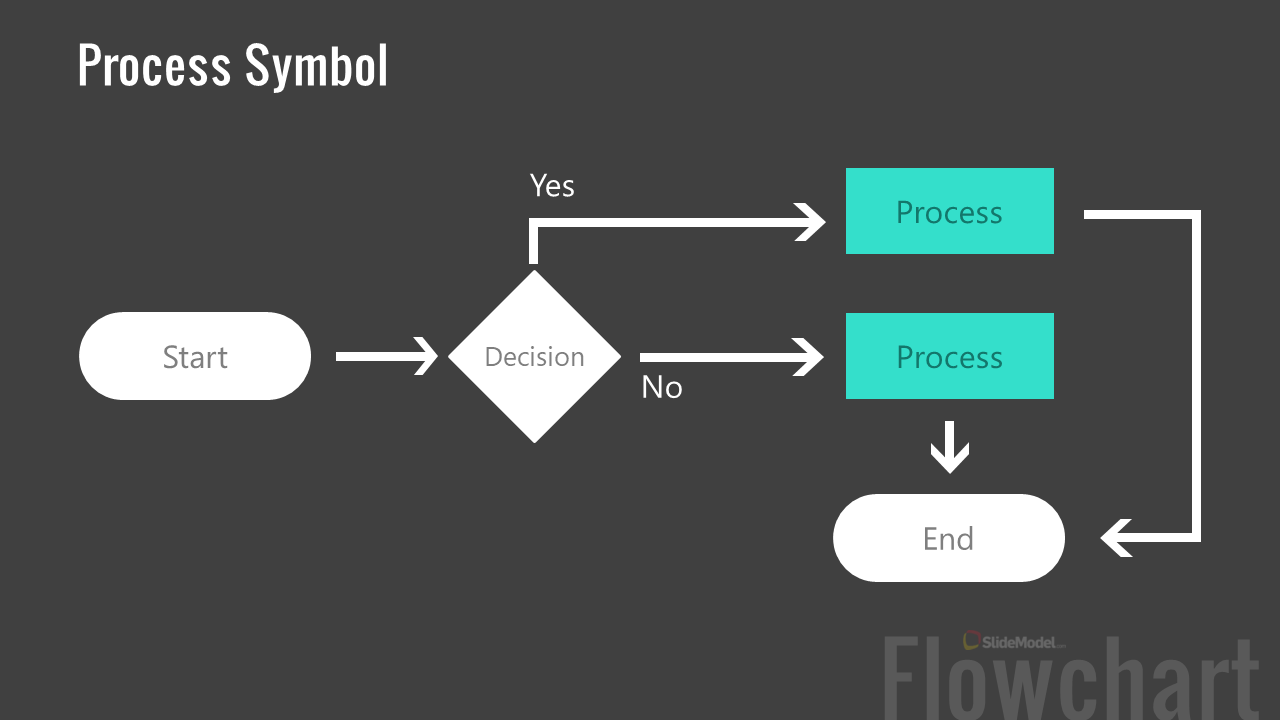
Process Symbol
This is a rectangle shape used for representing a set of operations with a change of form, location, data, value, etc. It is the action step or process represented in the flowchart.
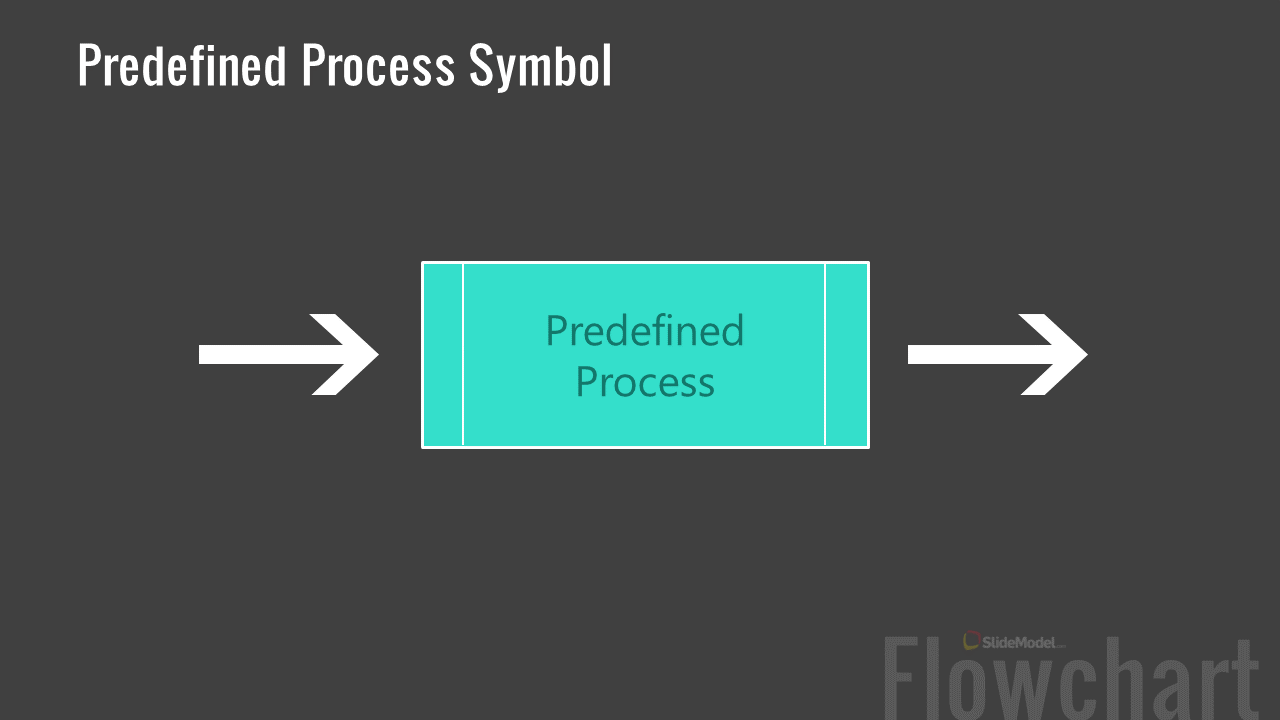
Predefined Process Symbol
This symbol has a rectangle shape with vertical edges on both sides and indicates a subroutine or predefined process in the chart.
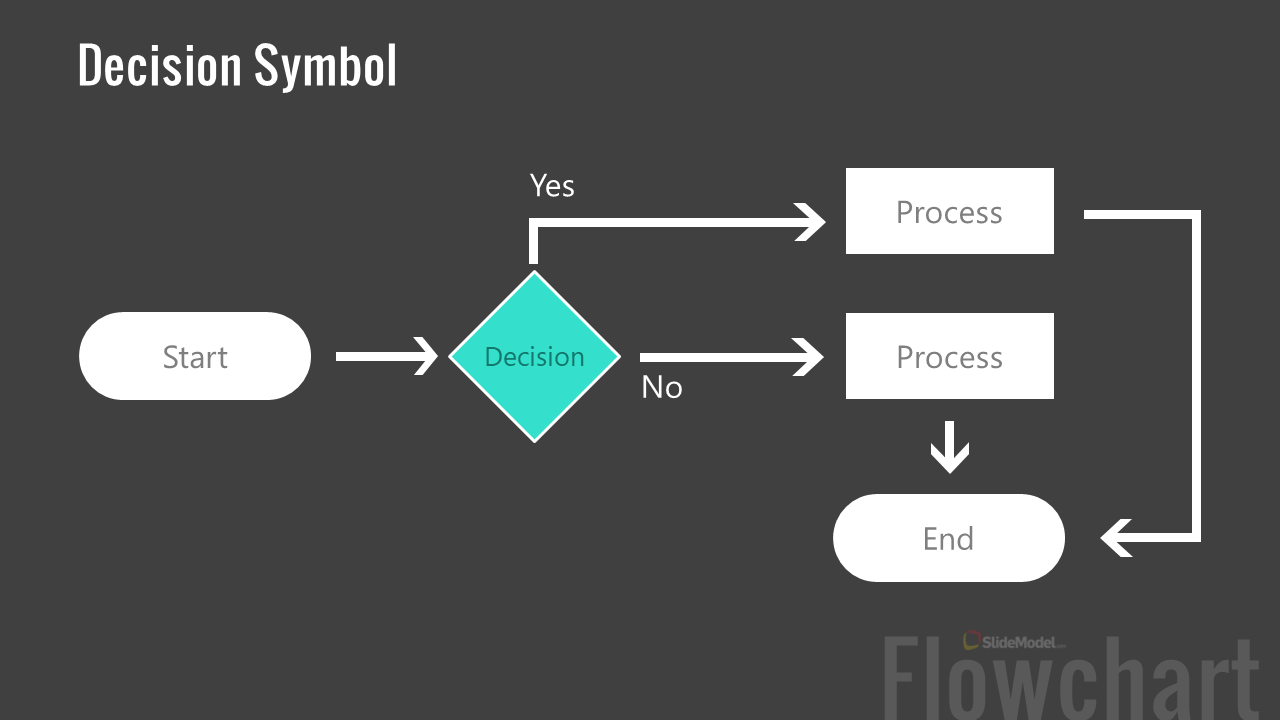
Decision Symbol
Represented with a diamond shape, the decision symbol in a flowchart comes with a yes or no or true or false question/test, determining the path of the program.
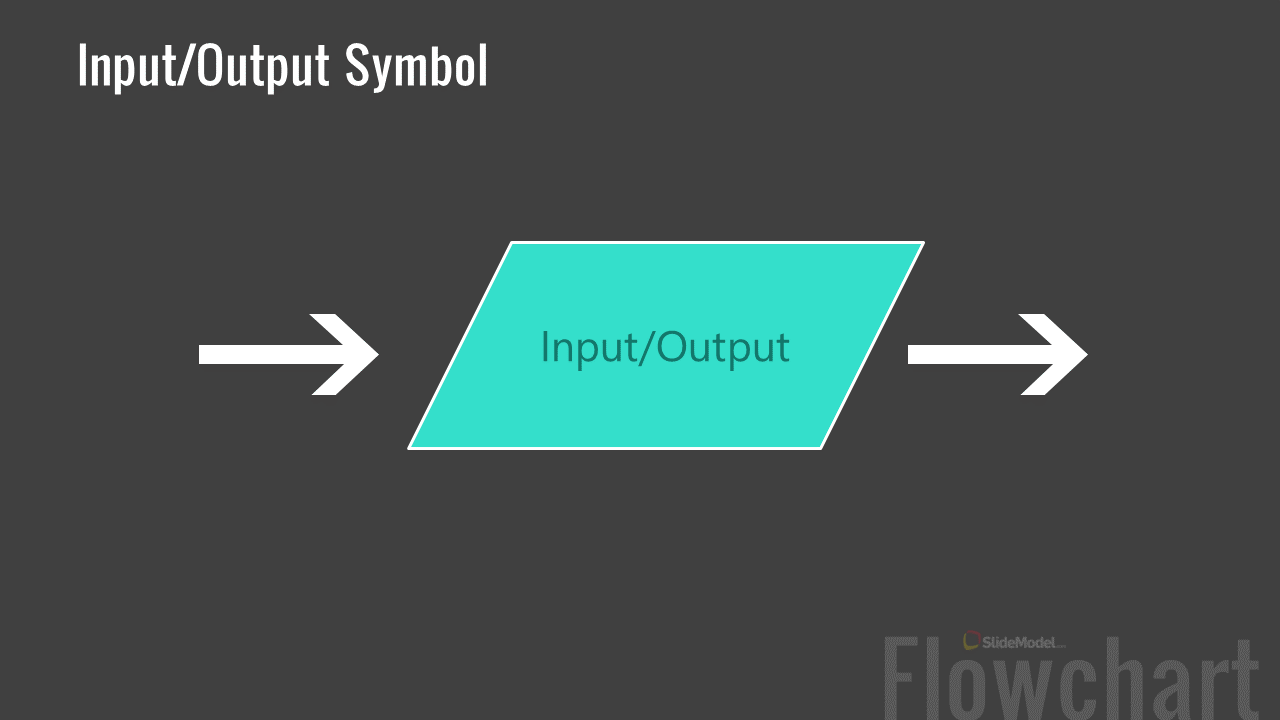
Input/Output Symbol
As the name implies, the rhomboid input/output symbols indicate inputting or outputting of data.
On-page Connector Symbol
Represented with a small circle, the on-page connector uses letters inside the shape to show where the adjoining connector is present.

Off-page Connector Symbol
Represented as a home plate like a pentagon, the off-page connector indicates that the target is on another page.
Annotation Symbol
This open rectangle shape indicates additional information about a step in the flowchart.

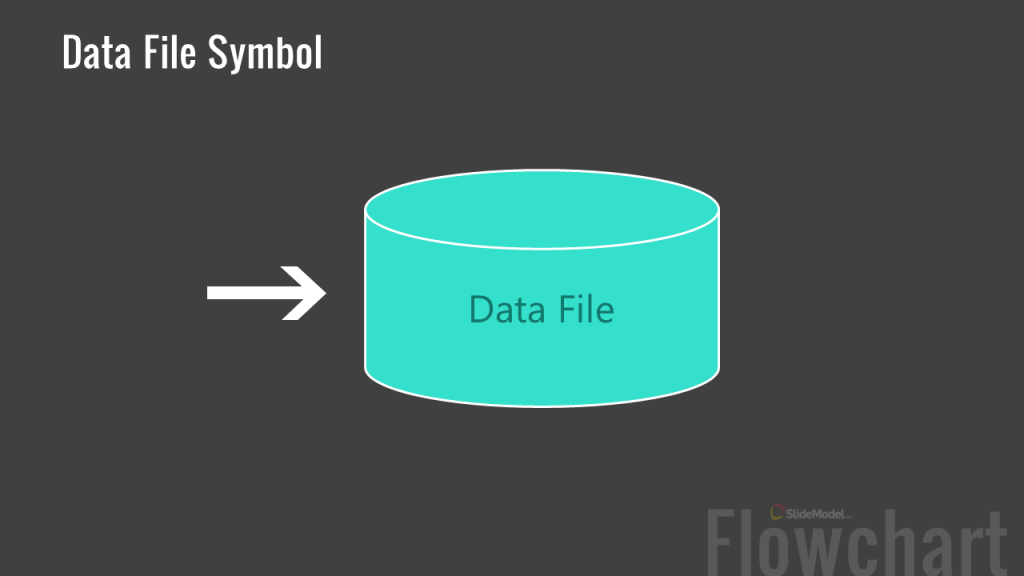
Data File or Database Symbol
This cylinder shape represents a disk drive.
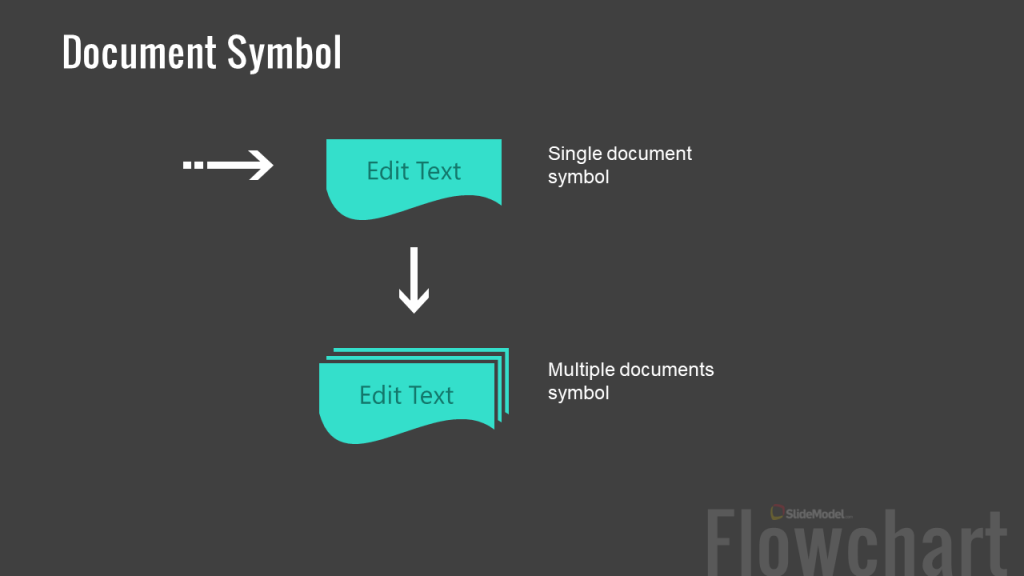
Document Symbol
The document symbol represents one or more documents. For single documents, a single wavy rectangle is used, whereas a stacked wavy rectangle shape represents multiple documents.
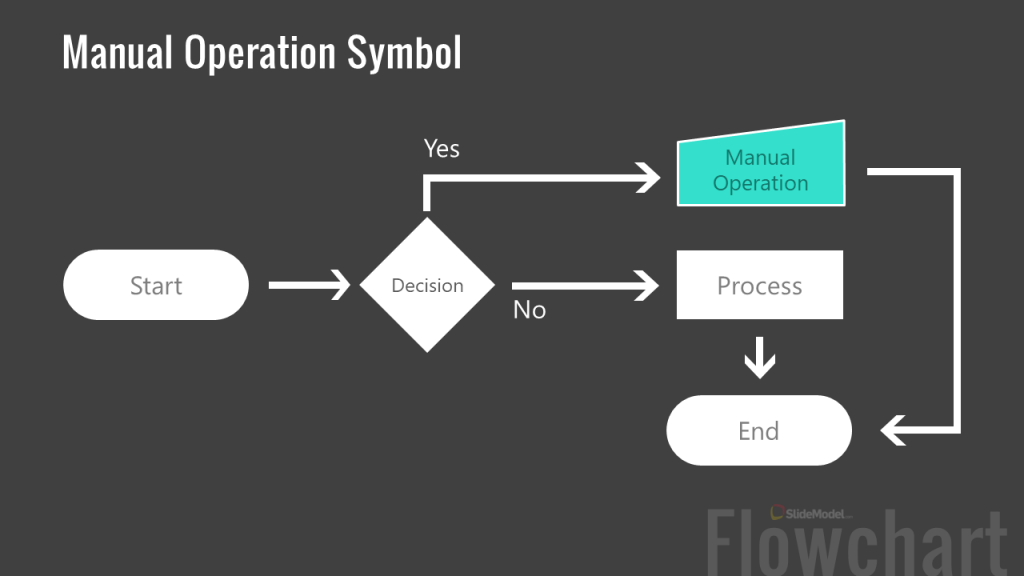
Manual Operation Symbol
The trapezoid symbol in a flowchart represents an operation or process adjustment that needs to be made manually.
Preparation or Initialization Symbol
This elongated hexagon symbol is used when initializing a routine or setting a switch.

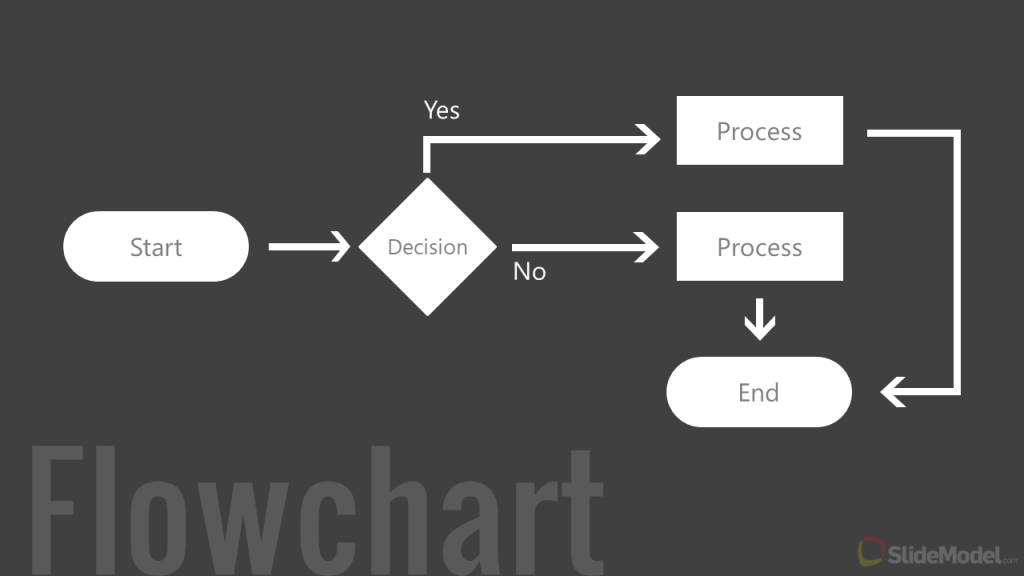
How to Make a Flowchart?
You can construct a professional-looking flowchart by following the five basic steps mentioned below.
Step 1. Determine the Purpose of the Flowchart
Before you start constructing your flowchart, you should have clarity regarding its purpose and gather information. Is the chart supposed to help employees understand or execute a process, determine the workflow, facilitate an operation or routine task or show the various steps for executing a program or algorithm?
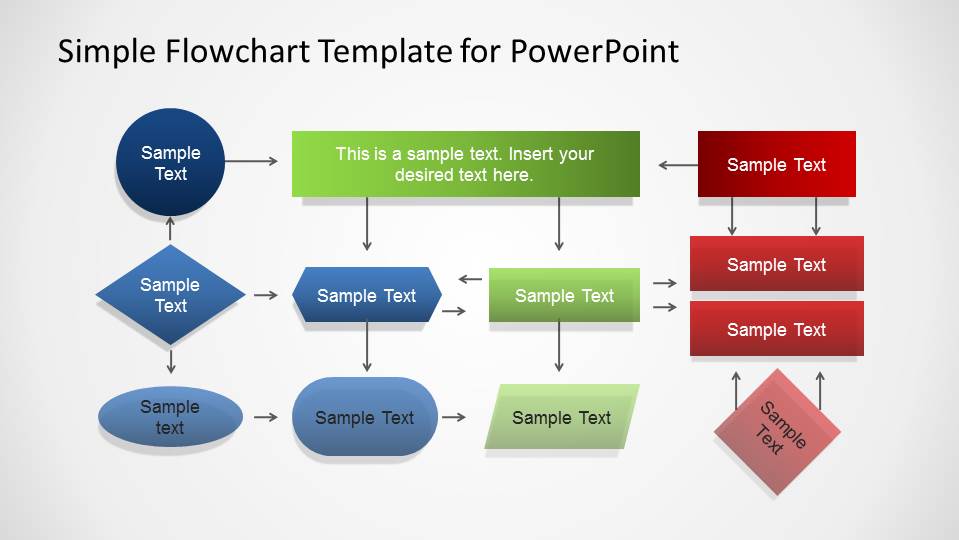
Step 2: Pick a Flowchart Design and Template
Depending upon your needs, you can pick different flow chart templates across various platforms. For example, to create a PowerPoint flowchart for a presentation, you can pick a template from our suggested PowerPoint templates mentioned in the section below.
The flow chart templates by SlideModel can be edited in Microsoft PowerPoint and Google Slides, but then you can reuse them in any other presentation or word processing tool such as Microsoft Word or Google Docs. By using copy & paste, you can insert the flow chart design into another document.
Step 3: Make a Flowchart According to the Correct Symbols
Sometimes, flow charts are also constructed using various images and icons that do not correspond to the standard flowchart format. For example, ‘how a bill becomes a law flowchart’ might contain icons and symbols related to the judiciary, the parliament, or other icons that might appear eye-catching for making a flowchart infographic. However, the standard format is to use the symbols in the correct order, such as using the standard symbols to show the start, process, decision, connectors, etc.
Step 4: Ensure Your Flowchart is Properly Labeled and Connected
Using the right symbols, with the required terms is necessary to ensure that the flowchart can be read and understood correctly. This is vital for processes to be executed and understood properly. Even a slight error in constructing a flowchart used for a process or program can at times have dire consequences. Resulting in the loss of time, money, equipment and affecting manpower. If you use a Flowchart maker, typically the flowchart tool provides text placeholders. It is essential to replace the default labels by the actual text to use.
Step 5. Stylize Your Flowchart
To make the flowchart easy to understand and eye-catching, you can add colors, text, and icons in a manner that it appears visually pleasing, without compromising on the standardization of the chart. You can use color coding for symbols, as well as different font styles and stylish versions of flowchart icons to make your chart easy on the eyes.
Flowchart Example: How a Bill becomes a Law Flowchart
How a bill becomes a law flowchart shown below maps the process from the draft bill to the stage when the law is enacted.
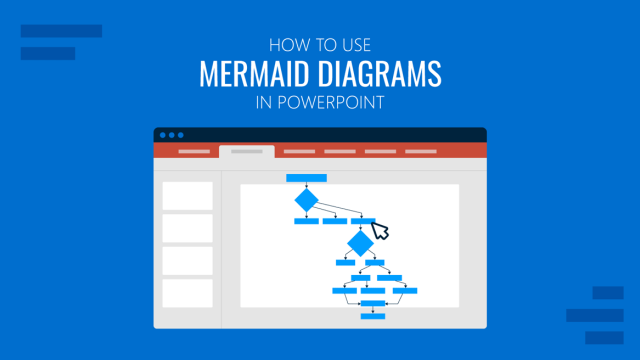
How to create a Flowchart in PowerPoint?
Microsoft PowerPoint is the go-to presentation software for many business professionals, educators, and students. Despite there are flowchart tools that are very specific to create “flowcharts”, PowerPoint can also be used to create beautiful eye-catching Flowcharts.
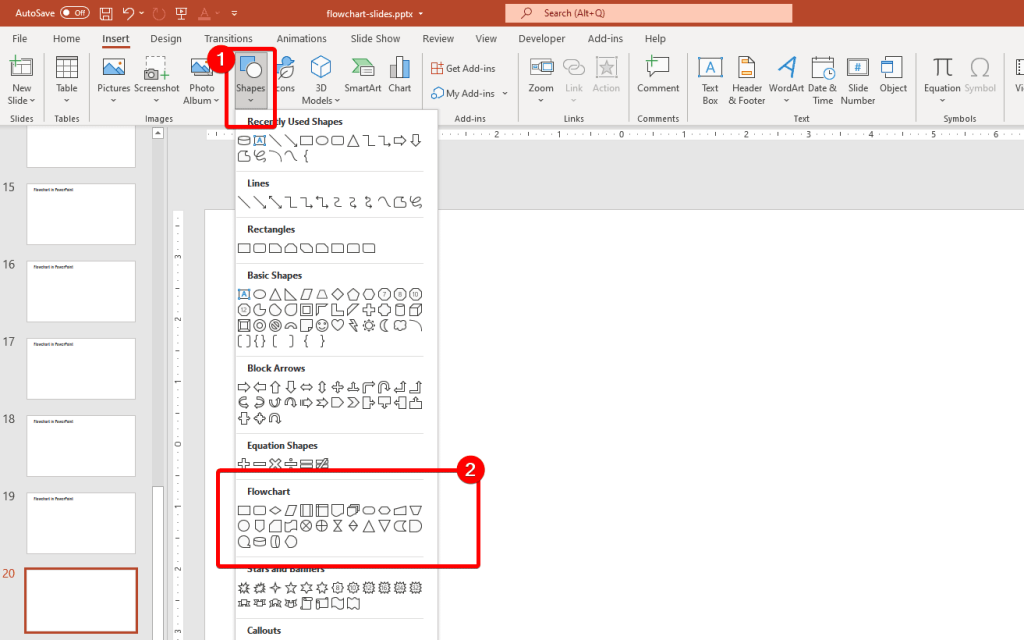
How to insert a flowchart into a PowerPoint slide? The built-in shapes catalog in PowerPoint includes several flowchart symbols and elements that you can use to insert a flowchart. Then, applying styles you can produce some high-quality flow charts to use in presentations.
To insert a flowchart symbol in PowerPoint, go to Insert -> Shape button and locate the symbol in the Flowchart section, as shown in the screenshot below.
How Does Flowchart Programming Work?
Flowcharts programming can be quite different from charts used for business, sales, and marketing, or a manufacturing process. The video below shows how a flowchart for computer programming or algorithms is constructed.
How Flowcharts are Used Across Different Fields?
Flowcharts are used across different fields and purposes, ranging from manufacturing, engineering, education, sales and marketing, to information technology, audit management planning, etc.
1. General Purpose Flowcharts
The general purpose of flowcharts across different fields can include the following:
- Documenting a process which can be later used for analysis and trainings.
- Analyzing a process to identify and eliminate redundant parts to make it more efficient.
- Standardization of a process for quality control purposes.
- Communicating a process during a training to orient the staff regarding how the process should be carried out.
Example: A process flowchart or data flowchart are a few examples of the type of flowchart uses mentioned above.
2. Flowcharts in Manufacturing and Engineering
In manufacturing and engineering, a flowchart can be used to document, analyze, standardize, or communicate a process. The flowchart can appear as an instructional diagram where set procedures need to be followed to ensure smooth manufacturing of products, quality, prevention of hazards, and to document the process itself.
Example: The most common types of flowcharts used in manufacturing and engineering include process flowcharts, workflow chart, data and swimlane flowchart.
3. Flowcharts in Computer Algorithms and Programming
Flowcharts are commonly used for computer algorithms and programming for the following purposes:
- To show how the code is organized.
- To Visually represent the way a code or program needs to be executed.
- To show the structure of a frontend, website or app.
- To show how the end user experience regarding a GUI for a website, operating system or program works.
Examples: A few examples of flowcharts used for the aforementioned purpose include Unified Modeling Language (UML), Nassi-Shneiderman Diagrams and DRAKON charts.
4. Flowcharts in Education
A flowchart might be used for educational purposes, such as to teach a process to students or during staff training. There are different ways how this can be done such as:
- For creating lessons for a presentation.
- When making infographics or other types of designs in order to show the flow of data or to teach a process.
- When showing a legal or civil process such as registration of identity documents or voters.
- When explaining a scientific process.
- When mapping out the outbreak of a disease or effects of a natural disaster.
- For Communicating theories and hypotheses.
- To teach a business process.
- To teach the use of a program, system or computer algorithm.
Examples: A data flowchart, Business Process Model and Notation (BPMN) model, data flow and Cross-Functional flowchart are a few of the many flowchart types that can be used for educational purposes.
5. Flowcharts in Sales and Marketing
Flowcharts used in sales and marketing are important for mapping out the target market, sales, flow of communication and to understand what impact such information might have on the broader marketing or sales strategy. Flowcharts used in sales and marketing might serve the following purposes:
- To view the flow of the sales process.
- To view the flow of customer feedback.
- To plan and execute a research or marketing strategy.
- To show the flow of information to reach the target audience.
Examples: A process, data or swimlane flowchart might be suitably used for sales and marketing purposes.
Flowchart Examples and PowerPoint Templates
Below is a list of flowchart examples and PowerPoint templates that you can use to create and showcase different types of flowcharts to present before an audience.
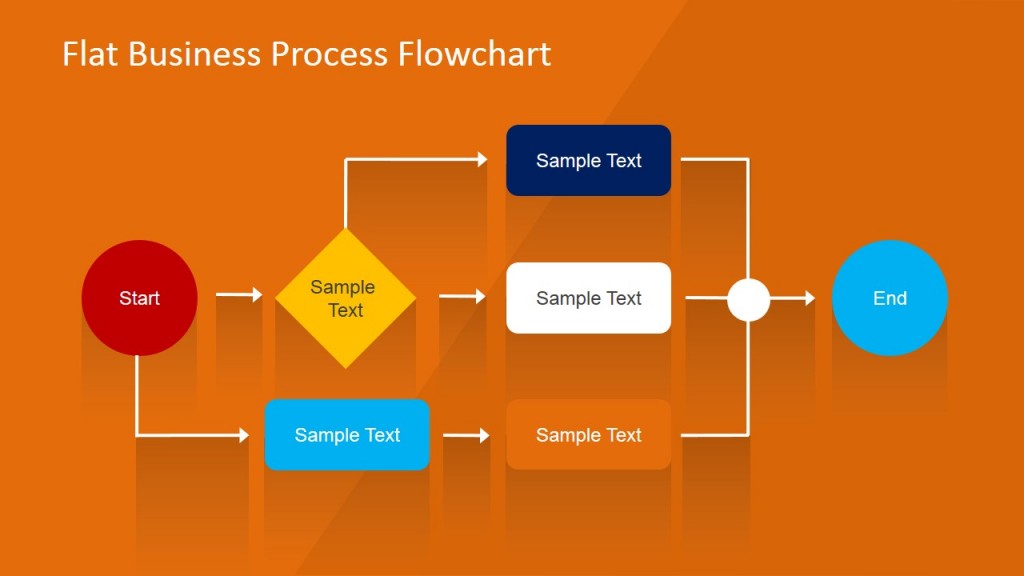
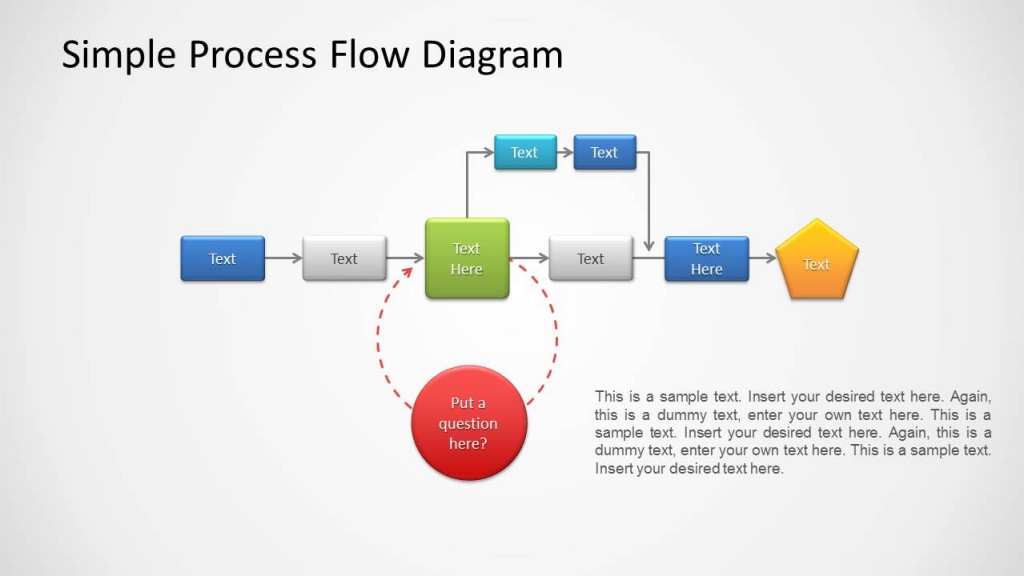
Business Process Flowchart
This Business Process Flowchart template is meant for making presentations where you need to construct a flowchart to explain how a business process works, such as by depicting a top-down illustration.
A few examples of business processes that can be created using this template includes a product development process, payroll process, procurement process, advertising process, sales and marketing process, etc.
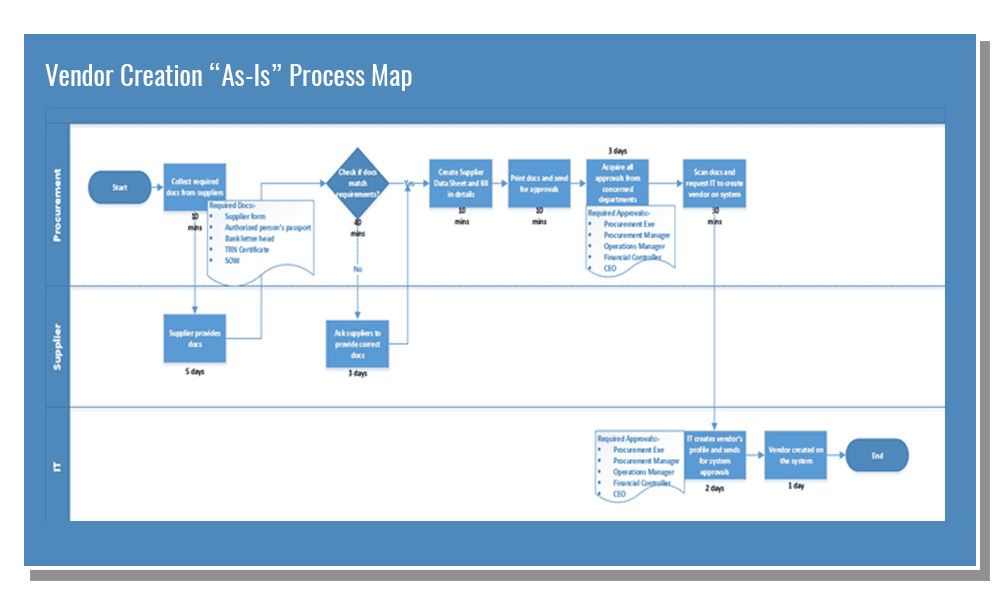
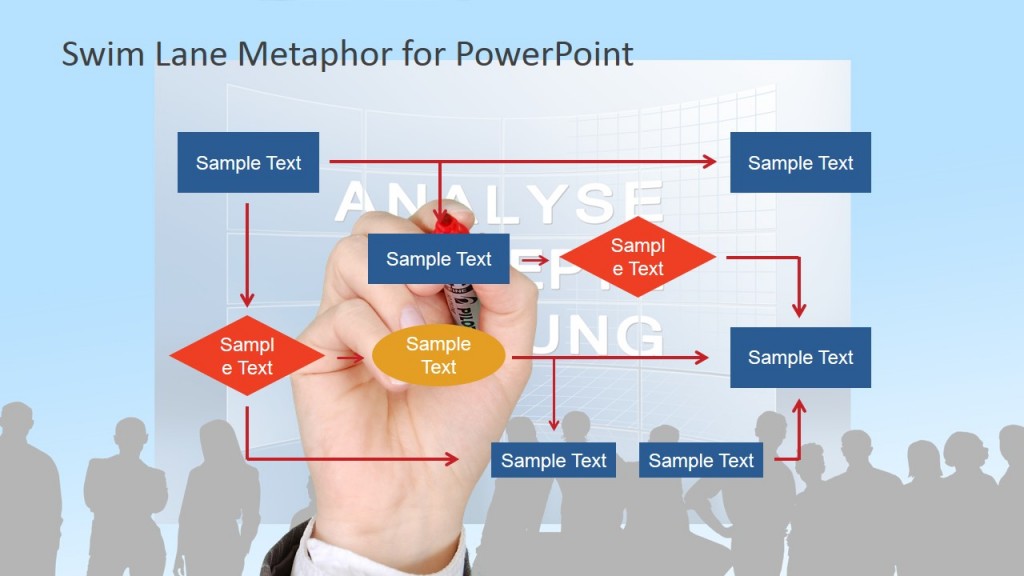
Swim Lane Flowchart
A Swim Lane flowchart distinguishes responsibilities and job sharing for sub-processes for a business process. This presentation template can be a good resource for making swim lane illustrations by using sample flow chart slides with editable symbols and flowlines.
Manufacturing Process Flowchart
In order to show a manufacturing process, you can use this template for creating an illustration that can help show the entire manufacturing mechanism in a step-by-step manner. The PowerPoint template provides terminal, process, decision and other useful symbols. You can also add or remove symbols by editing the original slide layouts.
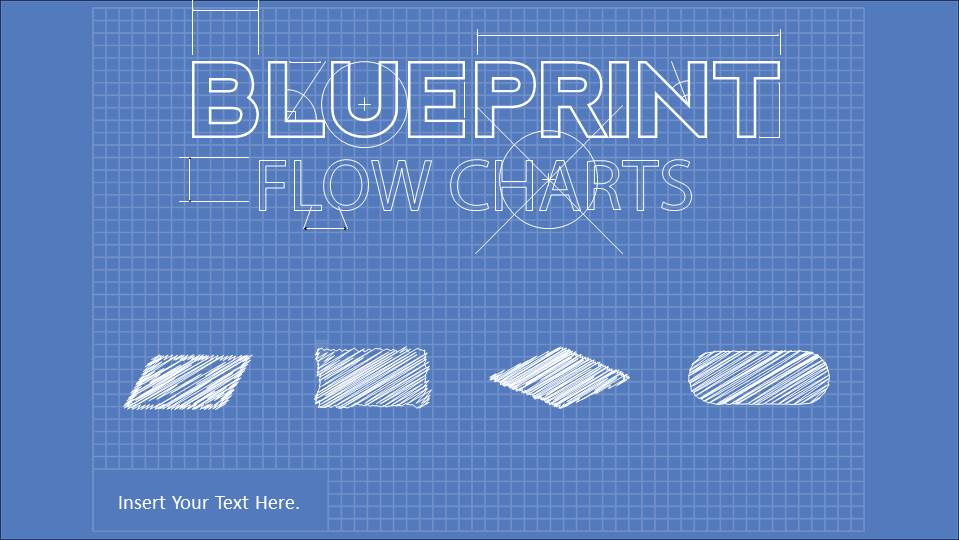
Construction Flowchart
With a blueprint like layout, this construction themed flowchart template for PowerPoint gives clipart for symbols and sample flowchart slides to help you create construction related illustrations.
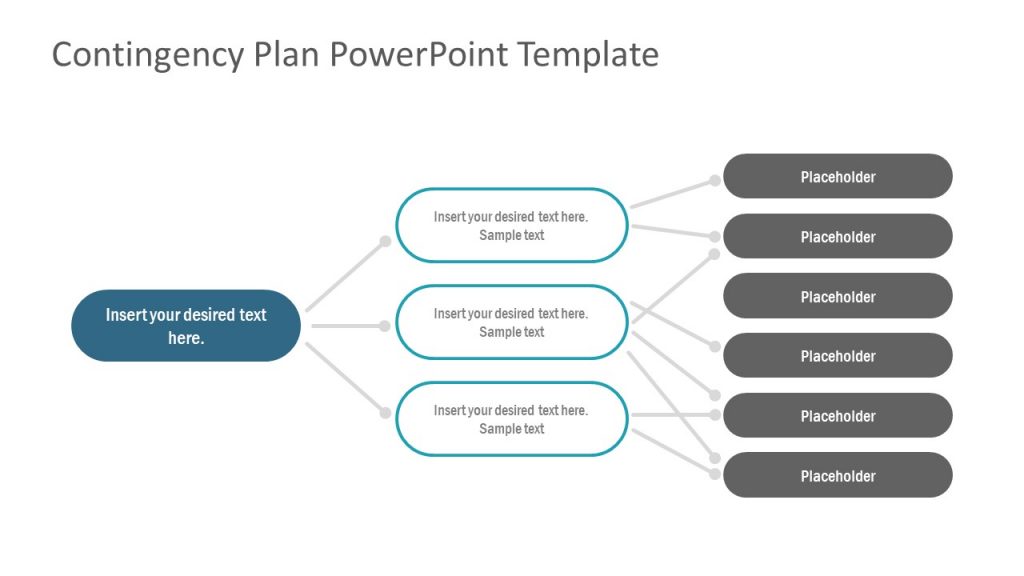
Contingency Plan Flowchart
Businesses require a backup plan in case things don’t go as planned or an unforeseen event hampers business continuity. This Contingency Plan Flowchart Template for PowerPoint is meant to design such plans in the form of flowcharts.
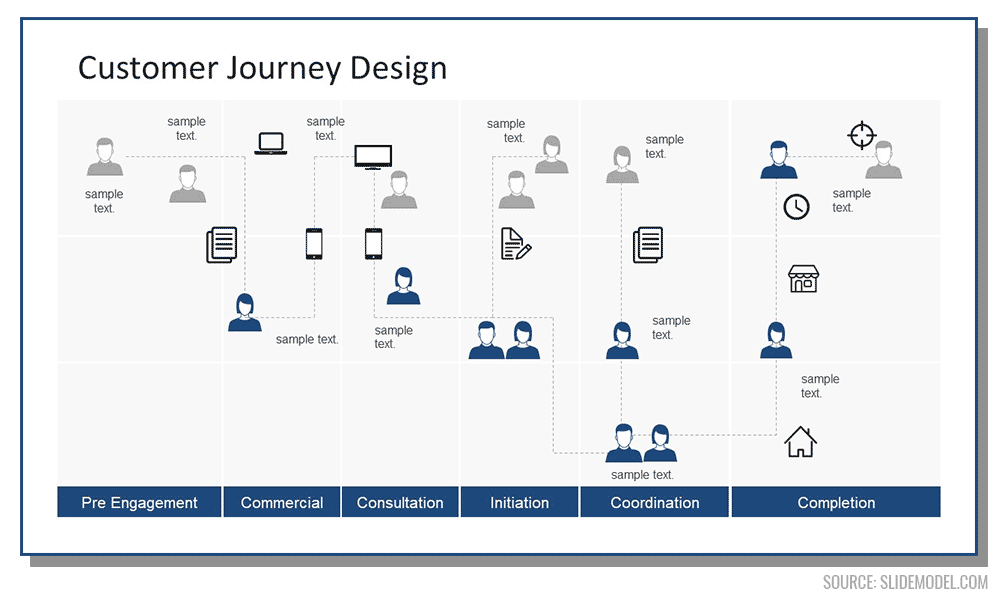
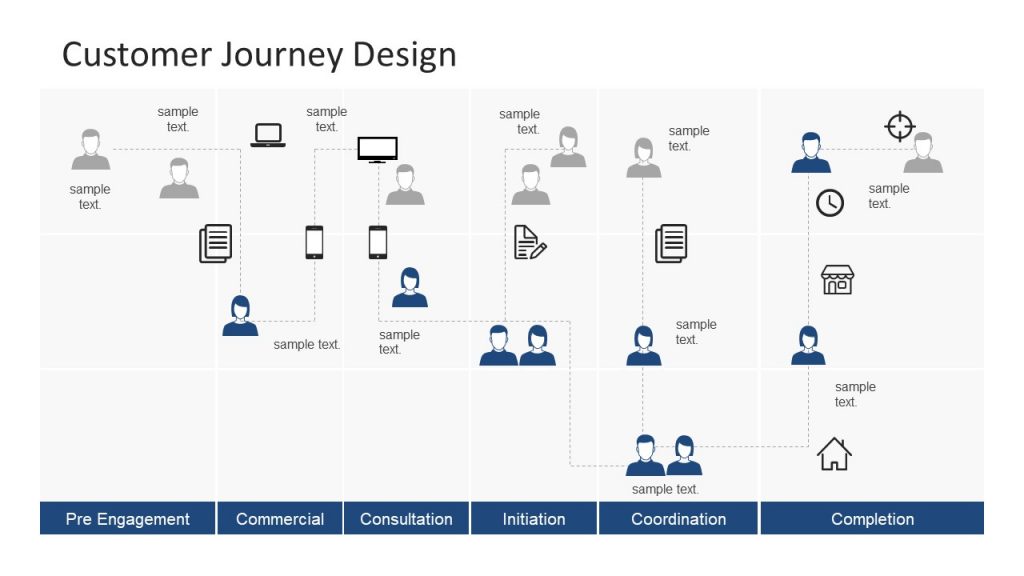
Customer Journey Flowchart
Mapping the customer journey is a common practice among businesses to identify how a customer ends up buying their product. To map this journey, you can use the help of flowcharts by mapping out the entire process using this simple template. The template is meant for showcasing the most basic factors leading up to the purchase of a product by a customer.
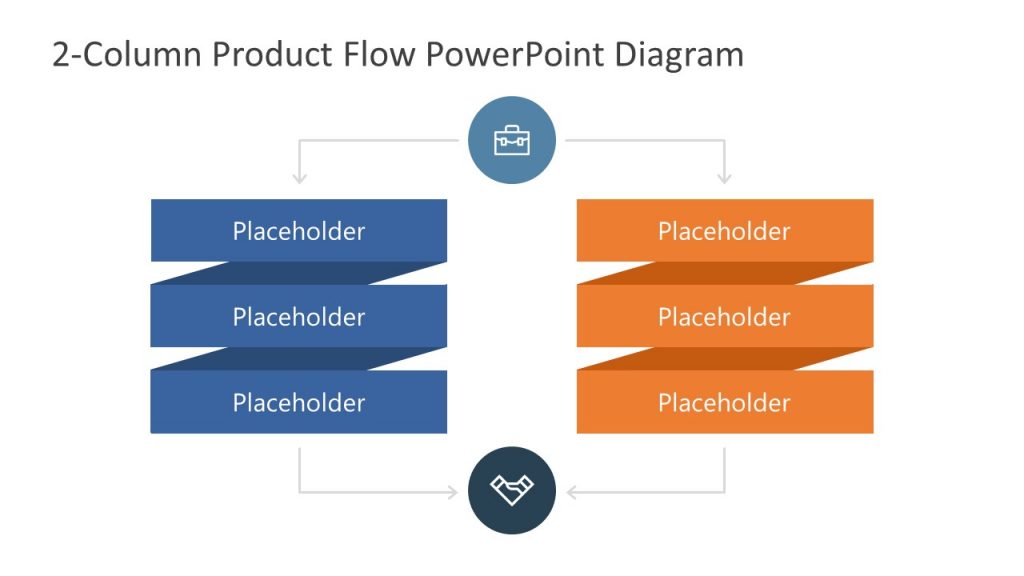
Product Flowchart
This is an unconventional flowchart template with a two column design that you can further edit to add symbols and flowlines to construct a product flow chart.

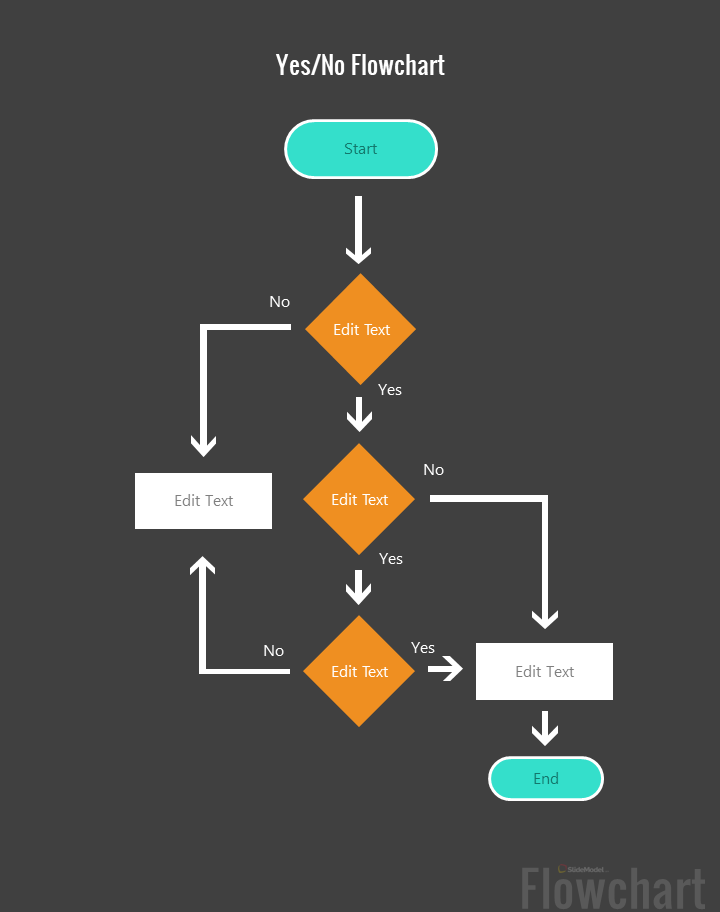
Yes/No Flowchart Template
Yes/No Flowchart designs can help to visualize different paths based on a Yes and No decision. Yes/No Flowcharts are sometimes known as dichotomous keys and are represented with a decision tree graphic.
FAQs
How do I animate a flowchart or workflow diagram in PowerPoint?
To animate a flowchart in PowerPoint, apply simple entrance animations to each shape following the logical order of the process. Use PowerPoint animations like Appear, Fade, or Fly In, and trigger them On Click or After Previous to guide the audience step by step. Avoid animating everything at once. Progressive reveals improve clarity and help explain complex workflows without overwhelming viewers.
What is the best layout direction for a flowchart?
Most flowcharts follow a top-to-bottom or left-to-right direction. Top-to-bottom works best for presentations and documents, while left-to-right is common in system and data flowcharts. Choose one direction and remain consistent throughout the diagram to avoid confusion.
What is the difference between a flowchart and a workflow diagram?
A flowchart focuses on the sequence of steps and decisions in a process. A workflow diagram emphasizes responsibilities, roles, and handoffs between people or departments. Swim lane flowcharts are often used to represent workflows clearly.
When should I use a decision symbol in a flowchart diagram?
Use a decision symbol whenever a process branches based on a condition, such as Yes or No, True or False. Each decision should lead to clearly labeled paths so the reader can easily follow the outcome.
Is it acceptable to use icons instead of standard flowchart symbols?
For infographics or high-level presentations, icons can be used to improve visual appeal. However, for technical documentation, training presentations, or compliance-related processes, it is best to stick to standard flowchart symbols to avoid ambiguity.
Final Words
A flowchart is of immense importance to document, explain, and execute process, programs, and workflow. The use of the flowchart has evolved over the years and is likely to continue changing in the wake of new processes and technology being introduced at an accelerated pace on a global scale. However, it is important to construct flow charts accurately, according to the need of the end users.
A minor mistake in the chart can result in a major issue due to the incorrect depiction of a step. At the same time, it is also important that such a chart is explained and properly understood for the correct implementation of the flow depicted in the chart. Alternatively, check our article about process improvement plan.
8. Multi-Level Segmentation Tree Diagram for PowerPoint

A decision tree presentation template design that can be used to represent a Yes/No flowchart.