Every organization eventually runs into the same question: do we have enough people, equipment, or budget to meet what is coming next? Answering that question well is the job of capacity planning, and answering it in front of the people who control the budget is the job of a capacity planning presentation. The two are not the same skill. A team can build a technically sound capacity model and still fail to get it approved if the presentation buries the conclusion, drowns the audience in spreadsheets, or never names the decision it’s asking for.
This guide walks through what a capacity planning presentation actually needs to contain, how to build the underlying plan before you open a slide editor, which charts communicate a capacity gap without a paragraph of explanation, and the mistakes that most often cost a plan its approval. It is written for the person who has to stand in front of leadership, a client, or a cross-functional team and make the case for staffing, equipment, or budget changes based on projected demand.
What Is a Capacity Planning Presentation?
A capacity planning presentation is a structured deck that compares an organization’s available capacity with its projected demand and recommends how to close the gap. It typically covers current capacity across people, equipment, or production lines; a demand forecast over a defined horizon; the size and timing of any shortfall or surplus; and a recommended course of action, with its cost and risk.
The presentation differs from an operational capacity report in one important way: it is built to drive a decision, not just to inform. A capacity report might live in a shared drive and get updated weekly. A capacity planning presentation gets fifteen minutes in front of a budget owner who needs to approve headcount, equipment purchases, or a shift in project timelines. That distinction should shape every slide. If a chart does not move the audience closer to a yes or no on the recommendation, it does not belong in the deck, even if it belongs in the underlying analysis.
The Three Types of Capacity Planning
Most capacity planning work falls into one of three categories, and naming which one you are presenting helps the audience calibrate the decision they are being asked to make. Workforce capacity planning looks at people: how many staff hours are available versus how many are required, broken down by skill or role so a shortage in one specialty doesn’t get masked by a surplus in another. A skills matrix is often the fastest way to show where those gaps sit, since it maps who can do what against who is actually needed.
Resource capacity planning takes a wider view, covering equipment, software licenses, facilities, and budget alongside people. It answers a broader question: given everything the organization has to work with, not just its staff, what can it realistically deliver in the period ahead? Production capacity planning is the most quantitative of the three, common in manufacturing and operations settings, where capacity is measured in units produced per hour, per shift, or per line rather than in headcount.
None of these types is inherently more important than the others, and many organizations need to present a blend, particularly when a staffing shortage and an equipment constraint are compounding each other. For the presentation, be explicit about which type of capacity you’re discussing on each slide, since mixing workforce and production metrics on the same chart without clear labels is one of the fastest ways to lose an audience.
Capacity Planning Strategies: Lead, Lag, Match, and Dynamic
Once you define the type of capacity, the next decision is which strategy the plan will recommend, and this often determines whether it gets approved. Lead capacity planning adds capacity ahead of anticipated demand, reducing the risk of missed deadlines but tying up budget in resources that may sit underused if the forecast runs high. Lag capacity planning does the opposite: it adds resources only after demand has already increased, protecting the budget but accepting a period of strain, backlog, or missed service levels while the organization catches up.
Match capacity planning sits between the two, adjusting resources in smaller increments as demand trends become clearer, which is a reasonable default when the forecast carries real uncertainty. Dynamic capacity planning goes further, using real-time data such as current utilization or a rolling pipeline to make ongoing adjustments rather than committing to a fixed plan for a quarter or a year. A presentation that recommends a strategy should say plainly why that strategy fits the situation. A lead strategy pitched to a cost-conscious audience without acknowledging the carrying cost of idle capacity will read as naive, and a lag strategy presented to a client-facing team without addressing the service risk during the catch-up period will invite hard questions the presenter should have anticipated.
Assessing Current Capacity and Forecasting Demand
The presentation is only as credible as the two numbers it compares, so it is worth spending a moment on how those numbers get built before turning to slide structure. Assessing current capacity starts with an honest count of available hours, units, or throughput, net of planned time off, maintenance windows, and the overhead that rarely makes it into a first draft. Teams that skip this step often present capacity figures that look strong on a slide but fall apart under a single follow-up question about vacation coverage or planned downtime. Requirements gathering at this stage should involve the people who actually do the work, not just the managers who schedule it, since frontline input tends to surface constraints that a top-down estimate misses.
Forecasting demand is the harder half of the equation, since it depends on signals from sales, product, or operations that are rarely as clean as a capacity count. A reasonable approach blends historical trend data with input from the teams closest to the pipeline, and it presents a range rather than a single number whenever the underlying uncertainty is real. Once both are established, the gap between capacity and demand is what the rest of the presentation exists to explain and address. A well-run project management life cycle treats this assessment phase as its own milestone rather than something rushed through on the way to the recommendation slide, because a shaky forecast undermines every conclusion built on top of it. Teams working within a formal methodology often align this step with the discipline described in the PMBOK guide, which treats resource estimation as a defined process with its own inputs and outputs rather than an afterthought squeezed in before the deck gets built.
Structuring the Presentation From Cover to Ask
A capacity planning presentation reads best when it follows a sequence the audience already expects: context, current state, forecast, gap, recommendation, and ask. The opening slides should state the planning horizon and the type of capacity in scope, since an audience unsure whether they are looking at a quarter or a year will misjudge the urgency of everything that follows. From there, the current capacity slide should show what is available today, ideally broken out by the same categories the forecast will use later so the two are directly comparable.
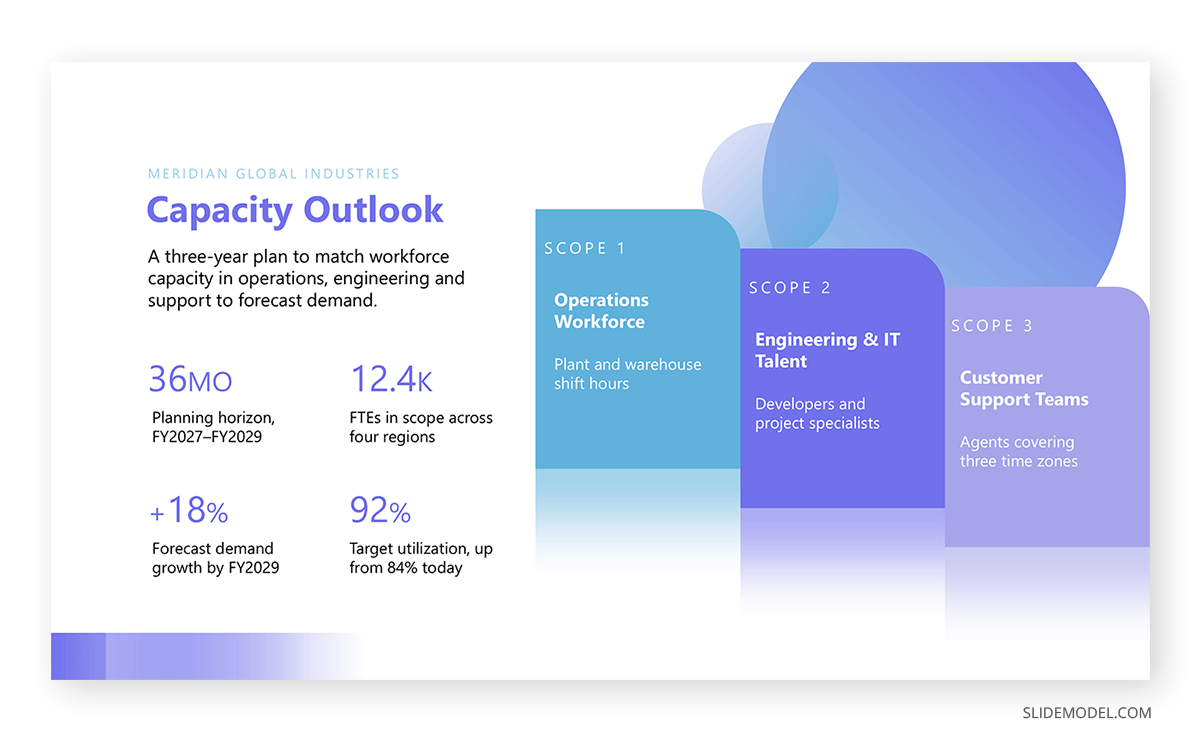
The demand forecast slide comes next, followed by the gap slide, which is usually when the audience leans in, since the shortfall or surplus becomes visible in concrete numbers. The recommendation should follow immediately, not several slides later, and it should name a specific strategy from the previous section along with its cost and timeline.
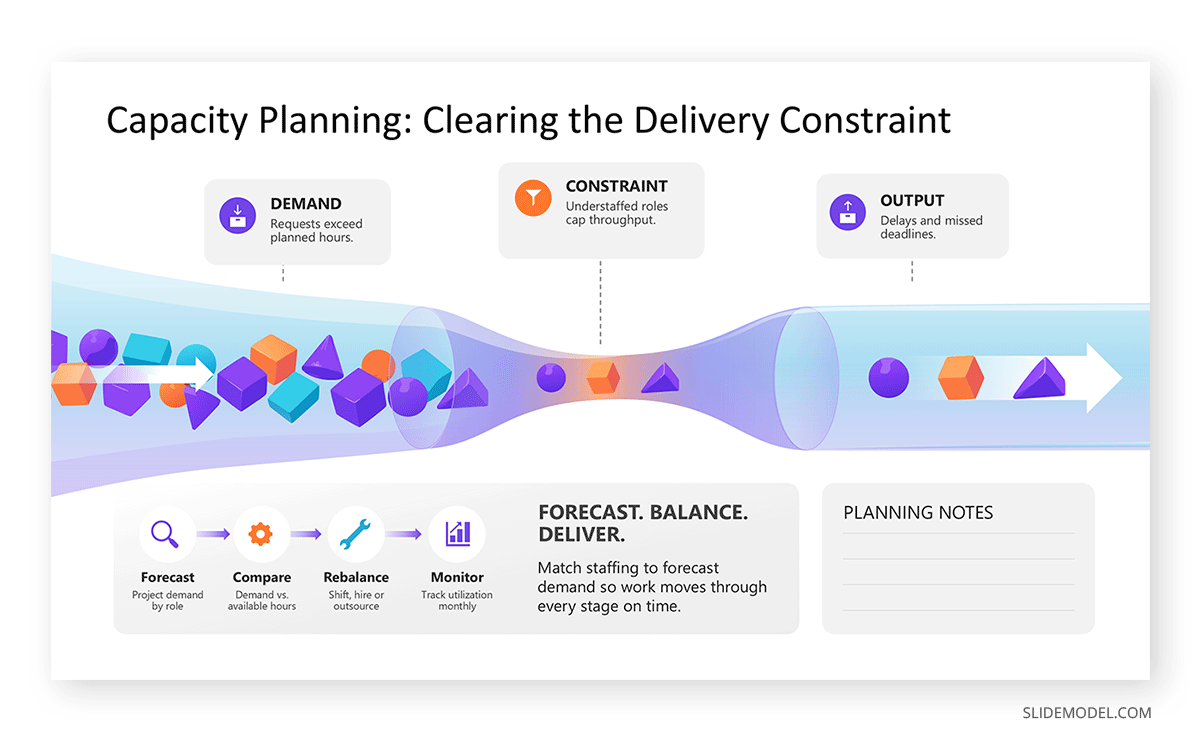
Closing the deck with a clear roadmap slide, showing when new capacity would come online and what happens if it does not, gives the audience something to approve rather than something to simply absorb. Presentations that borrow structure from a broader strategic planning process tend to land better with executive audiences, since the format is already familiar to them from other planning conversations.
Charts and Visuals That Make the Numbers Land
Capacity data is dense by nature, and the right chart does more to carry a capacity planning presentation than any amount of narration. A Gantt chart is the standard choice for showing how capacity additions, whether hiring, equipment delivery, or facility changes, line up against the demand timeline, and building one directly in PowerPoint keeps the visual editable when the forecast inevitably shifts before the next review. For the gap itself, a waterfall chart is often clearer than a bar chart, since it shows starting capacity, each addition or reduction, and the ending position in a single visual step-through that mirrors how the audience is already thinking about the problem.
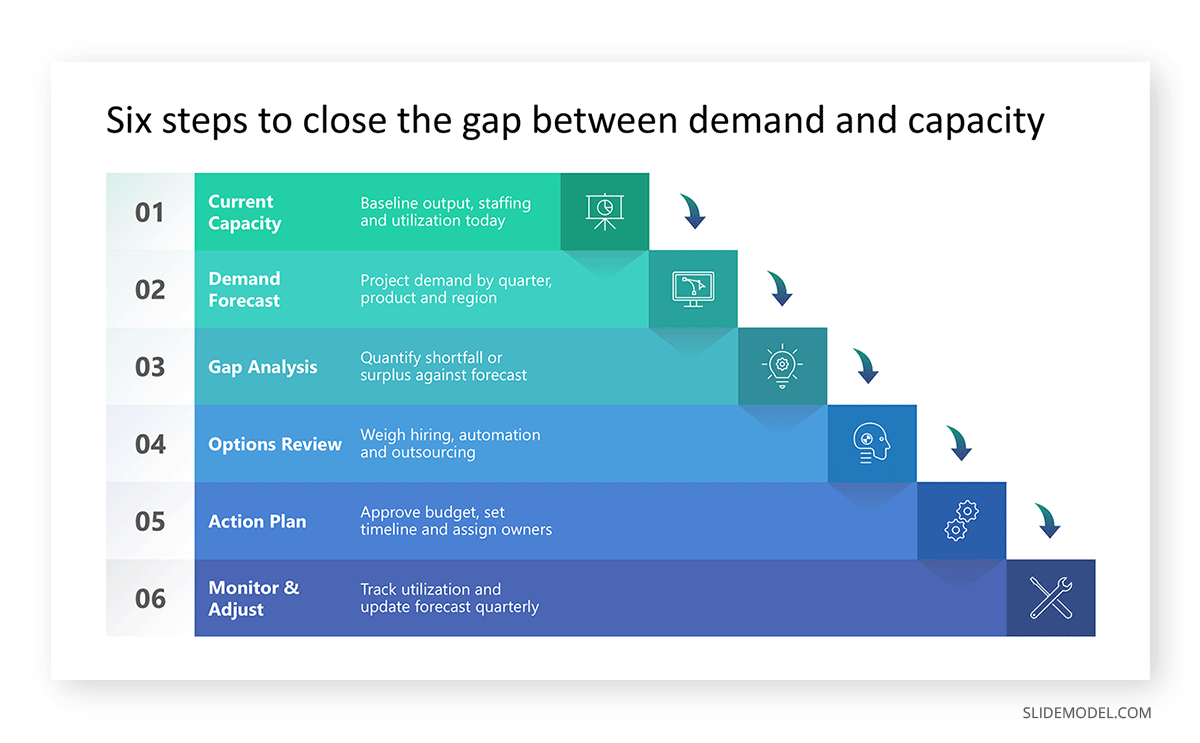
Utilization over time is usually best shown as a line chart, since trend direction matters more than any single data point, and a line makes a slow drift toward overcapacity or undercapacity visible well before it becomes a crisis. For a plan with many moving categories, whether skill groups, equipment types, or business units, a dashboard-style summary slide lets the audience scan the full picture before drilling into any one area during discussion.
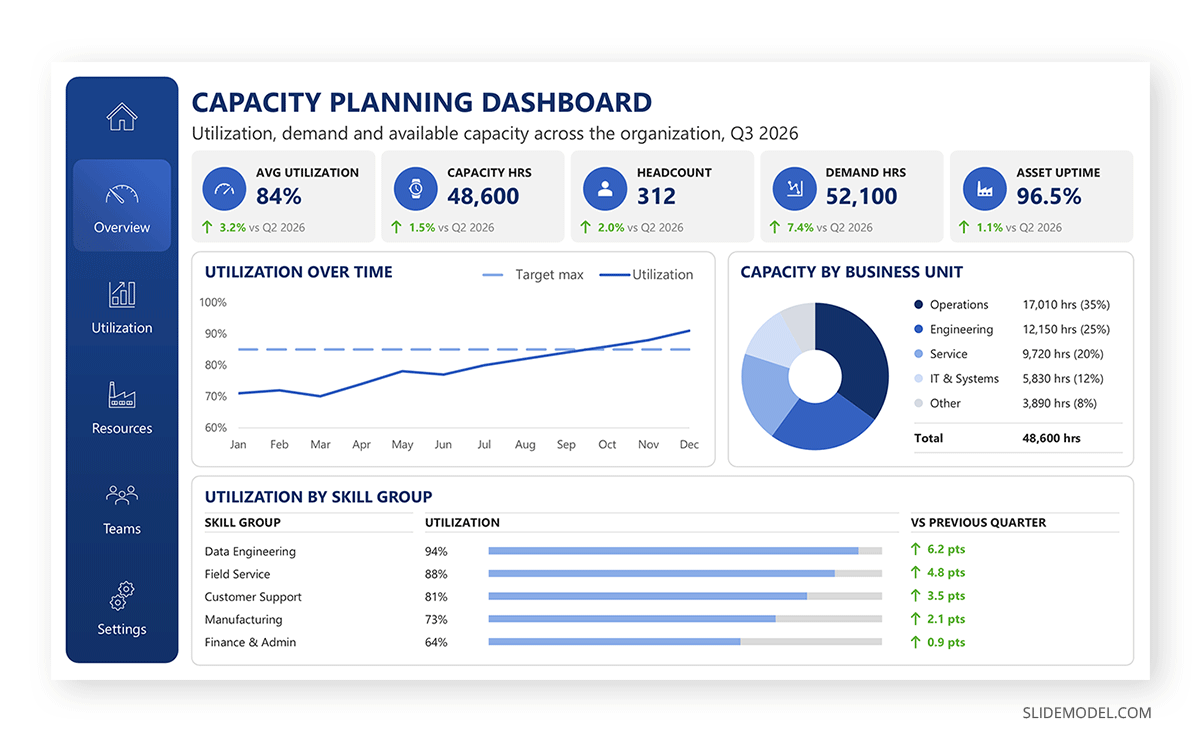
Whatever combination you use, each chart should carry a single message in its title, since a chart that requires the presenter to explain what it shows before the audience can read it has already lost some of its persuasive power.
Presenting Capacity Risk to Different Audiences
The same capacity gap needs to be framed differently depending on who is in the room, and misjudging this is a common reason technically sound plans stall. Executive audiences generally want the conclusion first: the size of the gap, the recommended strategy, its cost, and the risk of doing nothing, all on a single slide before any supporting detail. They will ask about downside risk, so a short risk analysis and risk management section, even a single slide summarizing the two or three risks that matter most, tends to earn credibility rather than slow the meeting down.
Operational and delivery teams, by contrast, usually want to see how the plan affects their day-to-day work: which roles are stretched, which projects might slip, and when relief is expected. Spending time on effective stakeholder management before the meeting, understanding what each group in the room actually needs to walk away with, does more to secure approval than any amount of polish added to the slides themselves. Clarifying ownership with a RACI matrix at this stage helps operational teams see exactly who is accountable for each capacity action, which cuts down on the follow-up questions that otherwise stall approval after the meeting ends. A plan presented the same way to a finance audience and an operations audience will usually satisfy neither one fully.
Keeping the Plan Accurate After the Meeting
A capacity plan that gets approved and then never revisited tends to drift out of date within a quarter, since demand forecasts and staffing levels rarely hold steady for long. Building a lightweight tracking mechanism, whether a recurring dashboard review or a rolled-up scorecard, keeps the original presentation from becoming a one-time artifact that nobody checks against reality. A balanced scorecard approach works well here because it forces the plan to be tracked against a small, fixed set of metrics rather than an ever-expanding pile of ad hoc reports that nobody has time to read.
Set the cadence for revisiting the plan during the original presentation, not informally afterward. A monthly check-in suits fast-moving teams where demand shifts quickly, while a quarterly review is usually enough for slower-moving production environments. Either way, naming the review cadence on the final slide of the original deck signals that the plan is a living commitment rather than a one-time approval, which makes the next presentation easier by building on an established rhythm instead of starting from scratch.
Common Mistakes in a Capacity Planning Presentation
The most common failure is presenting capacity and demand data without ever stating a recommendation, leaving the audience to draw their own conclusion from a pile of charts. A close second is treating every category of capacity as equally certain, when in reality a headcount forecast and an equipment delivery date carry very different levels of confidence and should be presented that way rather than with the same flat authority.
Overloading a single slide with every metric available is another frequent problem, since an audience that has to parse a dense table during a live meeting will miss the point the slide was meant to make. Skipping the cost of the recommendation is a mistake that surfaces later as a harder conversation, since a budget owner asked to approve a strategy without seeing its price attached will simply come back with the question the presenter avoided. Ignoring the risk of inaction is closely related: a plan that only shows the cost of adding capacity, without showing what happens if the organization does nothing, makes the case weaker than it needs to be. Finally, presenting a single-point forecast as certain, rather than showing the range of outcomes the underlying data actually supports, tends to damage credibility the moment demand comes in above or below the number on the slide.
FAQs
What is the difference between capacity planning and resource planning?
Capacity planning asks whether enough total capacity exists to meet expected demand over a given period. Resource planning is narrower and more tactical, focusing on assigning specific people or assets to specific tasks or projects within the capacity already established.
How often should a capacity plan be updated?
It depends on how quickly demand shifts in the organization. Fast-moving teams, particularly in services or technology, tend to review capacity monthly, while manufacturing or infrastructure-heavy operations often work on a quarterly cycle since capacity changes there take longer to implement.
What is capacity utilization, and how is it calculated?
Capacity utilization is the ratio of capacity actually used to total available capacity, usually expressed as a percentage. It is calculated by dividing actual output (or hours worked) by the maximum possible output or available hours over the same period.
What is the difference between lead and lag capacity planning?
Lead capacity planning adds resources ahead of expected demand growth, accepting some risk of underused capacity in exchange for readiness. Lag capacity planning adds resources only after demand has already increased, accepting a period of strain in exchange for tighter cost control.
How many slides should a capacity planning presentation have?
Most run between ten and fifteen slides for a standard review, though the number varies with audience and complexity. The goal is coverage of context, current capacity, forecast, gap, recommendation, and roadmap without padding any one section beyond what the decision requires.
What tools do teams use to build a capacity plan before presenting it?
Spreadsheets remain common for smaller teams, while larger organizations often use dedicated resource management or project management software that pulls actual hours and allocations directly from existing systems, reducing the manual reconciliation work before a presentation.
How does capacity planning differ between agile teams and traditional project teams?
Agile teams typically plan capacity in shorter cycles tied to sprints, adjusting frequently based on velocity, while traditional project teams often plan capacity against a fixed project timeline set months in advance. The underlying comparison of available versus required capacity stays the same either way.
What is a capacity buffer, and why does it matter?
A capacity buffer is a deliberate margin held above the minimum required capacity to absorb unexpected demand spikes, absences, or delays. Without one, even a small forecasting error can turn into a missed deadline or service failure.
Who should attend a capacity planning presentation?
Attendance depends on what is being decided, but it typically includes the budget owner who can approve the recommendation, the operational leads whose teams are affected, and, for cross-functional gaps, a representative from any department contributing capacity or demand data.
How do you forecast demand without historical data?
Without historical data, forecasts often rely on comparable projects or markets, input from sales or product teams closest to the pipeline, and a wider confidence range than a data-backed forecast would carry, with that uncertainty stated explicitly rather than hidden behind a single number.
What is the difference between workforce and production capacity planning?
Workforce capacity planning measures available people-hours against required people-hours, often broken down by skill or role. Production capacity planning measures physical output, such as units per shift or per line, and is more common in manufacturing or logistics settings.
How do you present a capacity shortfall to executives without alarming them?
Pairing the shortfall with a clear, costed recommendation tends to keep the conversation constructive, since executives generally respond better to a defined path forward than to a problem presented on its own. Framing the shortfall against the cost of inaction also helps put the number in context.
What metrics should a capacity planning dashboard track?
A useful dashboard usually tracks utilization rate, the size of the capacity gap over the forecast horizon, hiring or procurement lead time against that gap, and any known risk factors that could shift the forecast, such as attrition or a pending contract change.
Can capacity planning be automated?
Parts of it can. Pulling current utilization data and generating a baseline forecast are increasingly automated through resource management software, but the judgment calls, such as which strategy to recommend and how to frame the plan for a specific audience, still require a person building the presentation.
What is the difference between capacity planning and a staffing plan?
A staffing plan is typically one output of a broader capacity planning process, focused specifically on headcount and hiring timeline. Capacity planning can extend beyond staffing to cover equipment, facilities, and budget, with the staffing plan representing just the workforce portion of that larger picture.
Final Words
A capacity planning presentation earns its approval by doing two things well: building an honest comparison between what the organization has and what it will need, and presenting that comparison in a way that leads directly to a decision. The technical work of assessing capacity and forecasting demand matters, but so does the discipline of naming a recommendation, attaching a cost to it, and structuring the deck so the audience reaches the same conclusion the presenter did. Teams that treat the presentation as seriously as the underlying analysis tend to get faster approvals and fewer follow-up meetings, which is ultimately the point of building the plan in the first place.