Store Dashboard PowerPoint Template
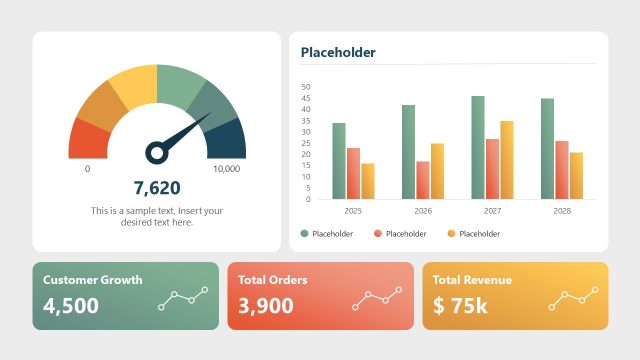
Share a comprehensive business performance report with the owners and stakeholders using our customizable Store Dashboard PowerPoint Template. Marketing managers use the dashboard layout to present their ad performance review in their team presentations. This helps them revisit their strategies, select the best performers, and make better decisions for upcoming advertising campaigns. Strategy directors use dashboard designs to communicate current revenue streams and future growth avenues to board members. The data report enables company leaders to identify trends, patterns, and insights to make informed decisions for upcoming endeavors. If you are looking for another dashboard layout or a template with different data visualizations, visit our collection of dashboard PowerPoint templates and select the one that best matches your needs.
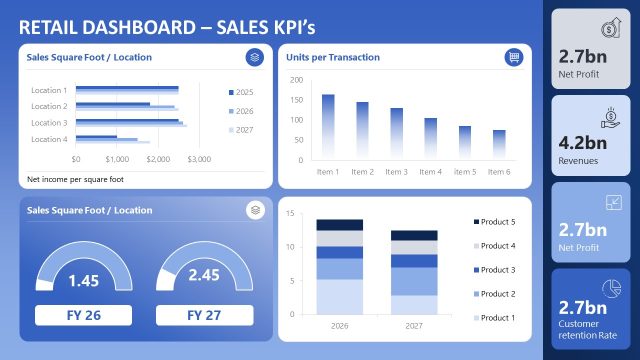
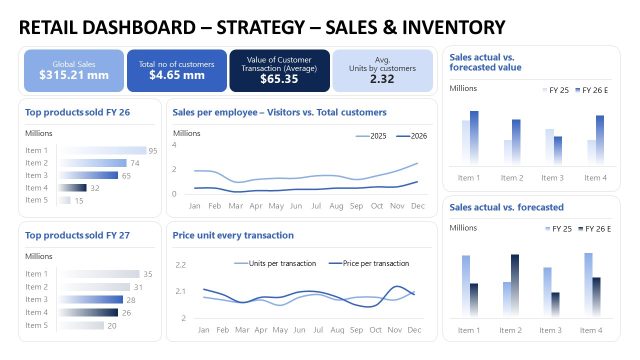
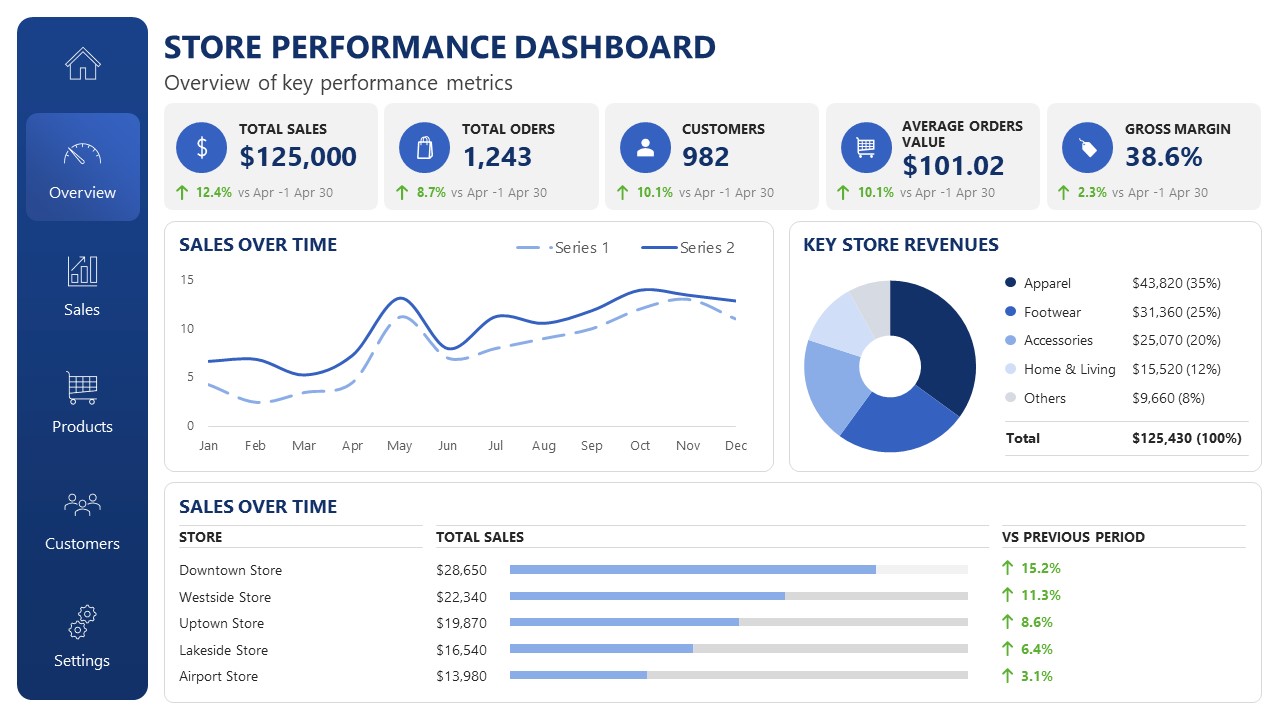
This modern Store Dashboard PowerPoint Template features multiple data visualizations and data segments. On the left, a vertical nav bar lets business consultants switch the data view to products, sales, or customers. The right segment comprises four tabs in the top row for showing total sales, total orders, customers, average order value, and gross margin. Below is the line chart that business analysts can use to view sales over time. Further, a donut chart is useful for visually distinguishing the key store revenues. At the bottom, we have provided a bar chart to clarify sales over time by brand outlet. In corporate partnership discussions, the dashboard lets the parties quickly visualize the company’s position and market cap, easing collaboration. For e-commerce stores, you can easily change the KPIs used in the dashboard, either on the dark-background slide or the white one. Download the store dashboard presentation slide template to convey the complex data points in simple visualizations.


You must be logged in to download this file.
DOWNLOAD- Category
- Business PowerPoint Templates
- Rating

 Loading...
- Size
- 16x9
- Item ID
- 23670-01
- Colors
Subscribe today and get immediate
access to download our PowerPoint templates.