The toolset of project management professionals can contain several assets. Some of these can be confusing to comprehend if you lack the required knowledge or if you work on collaborative projects in areas you may not be familiar with.
Gantt charts are a key asset for project managers as they visually represent scheduled project activities. This guide aims to clarify how to apply this tool in real-life projects efficiently. We shall explore their key features and functionalities, such as task durations, dependencies, milestones, and resource allocations. Whether you’re a beginner in project management practices or a professional seeking to enhance your skills, these 6 examples will provide a solid foundation for understanding and leveraging the power of Gantt charts in project management.
Table of Contents
- What is a Gantt Chart?
- Gantt Chart’s History
- Components of a Gantt Chart
- How to Build a Gantt Chart
- Software Tools for Creating Gantt Charts
- Strategies for Effective Gantt Charts in Presentations
- Real-Life Gantt Chart Examples
- Common Mistakes in Gantt Chart Creation
- Recommended Gantt Chart PowerPoint & Google Slides Templates
- Final Words
- References
What is a Gantt Chart?
A Gantt chart is a special type of bar chart depicting a project schedule, commonly used for displaying scheduled activities. It presents the start and finish dates of the terminal and summary elements of a project [1]. Gantt charts represent key project stages and their durations in a sequential bar chart format. The time scale is presented across the top.
The Gantt Chart is a visual roadmap for project management tasks, timelines, and interdependencies. It assists teams in planning, scheduling, and tracking progress.
Gantt Chart’s History
This type of bar chart is named after its creator, Henry L. Gantt, who designed the application of the typical bar chart for project management purposes in the early 1910s [1]. Since then, Gantt charts have become part of various construction projects, including the Hoover Dam project in 1931 [3]. Ever since, it has been employed as a visual representation of project timelines. It enhances communication and coordination among team members, thereby promoting efficiency.
Gantt charts help project managers to allocate resources efficiently. One of their main advantages is to improve communication in presentations by presenting complex project timelines in a simple format, especially in projects with overlapping stages. Stakeholders, team members, and clients can quickly grasp project timelines and milestones. Therefore, as a tool, it promotes transparency.
Studies reflect upon the value of Gantt charts in improving the cognitive ability to manage structural complexity by coordinating diverse and interdependent tasks [2]. They significantly help human resource management by saving the workforce. At the same time, the project Gantt chart also reduces product costs, being a significant tool in material management by minimizing wastage [6]. Thus, a Gantt chart saves time in any project process – which always translates into money.
Components of a Gantt Chart
A Gantt chart includes some essential components that simplify project management. Elements such as timelines, tasks, milestones, and dependencies are important for the functionality of Gantt charts [4].
Timelines
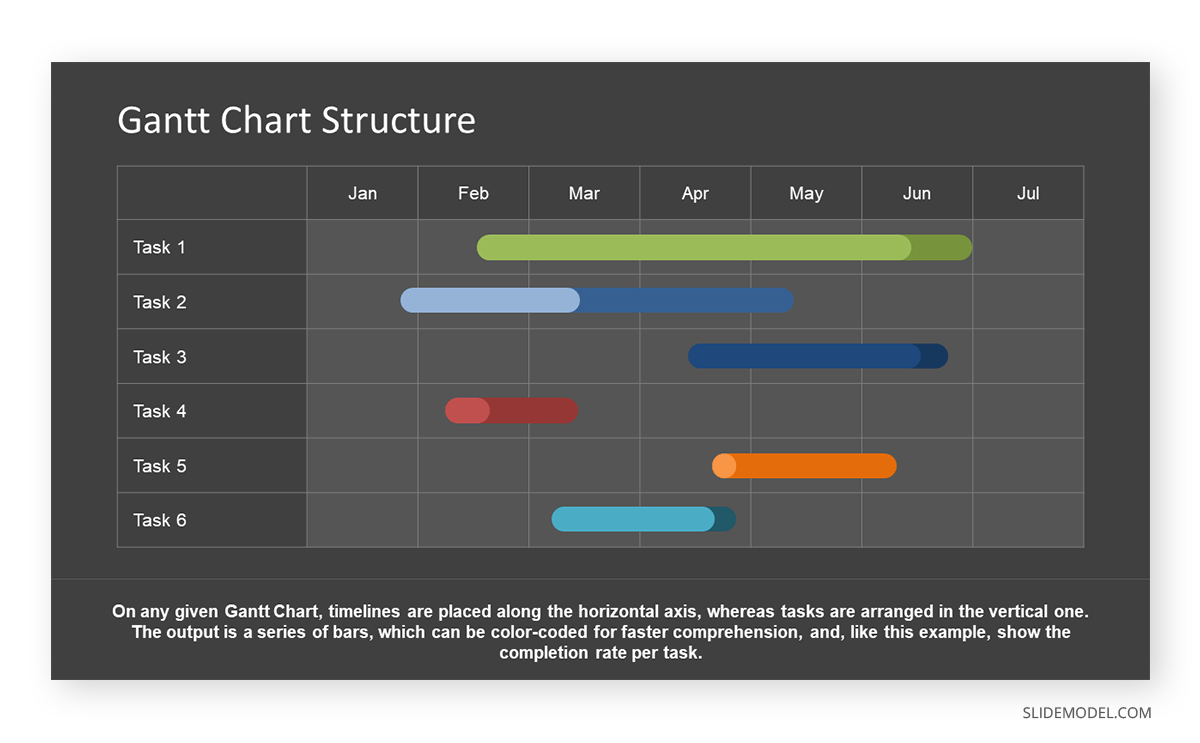
Represented horizontally, timelines provide a chronological view of a process or project. They allow us to schedule and track the whole project period with the sole purpose of efficient resource management [4]. To illustrate this point, we can imagine one horizontal bar spanning from start to finish to define the required time to allocate the project resources.
Tasks
Tasks are displayed as bars along the timeline. These tasks outline specific activities, duration, and deadlines. They must be identified by following strict color guidelines; otherwise, it can lead to confusion.
Milestones
Symbolized by markers, milestones signify key project achievements or events. They enhance focus on critical points in the timeline. Vertical markers highlight significant project events. You can differentiate milestones by assigning different colors to them.
Dependencies
Dependencies indicate task relationships, showing the sequence in which activities must be completed — the importance of establishing lies in preventing bottlenecks.
To represent dependencies, you can use the Arrow symbol. These arrows will connect tasks to showcase sequential order.
How to Build a Gantt Chart
In this section, we will present a simplified version of how to build a Gantt Chart, regardless of the software used. Alternatively, you can check our detailed guide on how to make a Gantt Chart in PowerPoint.
Step 01: Define Tasks
List all project activities or tasks clearly and concisely. The project name should be specified, as well as its starting date. Additionally, mention the weekdays declared as working days for the project.
Step 02: Create a Timeline
To create a timeline for your presentation, draw a horizontal axis representing the project timeline, segmented into appropriate time units (days, weeks, or months). Alternatively, learn how to create timelines here.
Step 03: Add Tasks to the Table
While building your project table, add tasks to the Gantt chart outline. Add the defined tasks to the chart. Repeat the process until all pending tasks are included.
Step 04: Estimate Durations
Assign specific timeframes to each task, considering the complexity and resources required. You can directly drag and drop each task onto the timeline. However, it is also possible through a simple click on your project timeline. When you are done, select the desired date for scheduling the task. Adjust the bar accordingly.
Step 05: Set Milestones
Identify crucial milestones, such as project kick-off or significant deliverables. Including milestones in the Gantt chart is a simple process. It is the same process as adding tasks. Adding milestones will help to monitor project deadlines, meetings, and important events or deliverables. For instance, you can place vertical markers on the timeline to indicate the events of milestones.
Step 06: Add Dependencies
Determine task dependencies to establish a logical execution order. Use arrows to connect tasks, showing the flow and dependencies between them.
Step 07: Task Representation
Use bars to represent each task along the timeline, with the length of the bar corresponding to the task duration. Bars are horizontal lines representing the duration of each task. Tasks start from the left end of the bar and finish at the right end. The bar’s length shows the duration of the task.
Step 08: Labeling
Clearly label each task, milestone, and timeline for easy understanding.
Software Tools for Creating Gantt Charts
There are various tools to assist when making a Gantt Chart. Depending on the outcome intended for your Gantt Chart, you can pick simpler tools, like smartphone apps or online Gantt Chart makers, generators or online builders, or you can use dedicated software like Microsoft Project for detailed project management. The latter is the preferred choice of architecture professionals and contractors, as this tool has been encouraged since university days; hence, becoming an industry standard for many.
Microsoft gives us several other options to lower the complexity curve. Microsoft Excel is pretty straightforward for creating these charts [7], although it may lack visual impact. The sweet spot? Using PowerPoint templates for Gantt Charts: easy to edit, powerful visuals that boost retention rate, and a reusable tool that can be modified as often as required. If you work with open-source software, Google Slides templates are also available for this presentation niche.
Cloud-based apps like Asana and Trello offer collaborative Gantt chart development. These platforms support real-time updates and assist teamwork [4]. This enhances the project efficiency and coordination.
Strategies for Effective Gantt Charts in Presentations
Creating a Gantt Chart example for project management presentations involves clarifying information and engaging your audience. Here are some suggestions based on our expertise to elevate the quality of your Gantt Chart samples.
Data Representation and Visuals
When applied to project timelines, the power of visual representation can be measured in how they interpret the information being disclosed [5].
Use clear and concise task names or descriptions for audience understanding. Display task durations to give a sense of the timeline.
Animations can help to gradually reveal the Gantt chart elements, emphasizing one task or phase at a time. In addition, using colors to distinguish between different tasks, team members, or project phases is essential.
Balancing Detail and Simplicity
Include only significant tasks and milestones. Avoid excessive detail and unnecessary information to maintain clarity and facilitate maintenance.
It is advisable to exclude inconsistent formatting for a cohesive and professional appearance. Limiting different views prevents unnecessary complexity, as the chart focuses on essential project elements by avoiding overemphasizing less critical tasks.
Color Coding and Symbols for Clarity
A good strategy to implement is to use different colors to represent task categories. For instance, we can use blue for design and green for development. Therefore, the audience will notice the design and development project components quickly.
Highlighting priority levels with the help of colors is a practice often used in the manufacturing industry. Red denotes high-priority tasks that require quick attention. Presenters can use green to signify low-priority items.
Another take is to use a color scheme to show task progress. Start in red, transition to yellow as in progress, and turn green upon completion. It offers a dynamic visual representation of project advancement.
Various icons or symbols, such as stars for milestones, make crucial achievements easily recognizable. Resource allocation can be visually communicated by assigning different colors to icons. At the same time, apply background colors to differentiate project phases.
White space can be strategically used to give a cleaner Gantt chart. The presenter must explain the meaning of colors and symbols. Only then can all stakeholders easily interpret visual signs. Colors should be chosen carefully to make the Gantt Chart more user-friendly. For instance, choose high-contrast and color-blind-friendly options.
As we could see, Gantt Chart is a visual roadmap for project management collaboration tools. It will help you with tasks, timelines, and interdependencies. In the next section, we’ll see some real-life scenarios and cases where Gantt Charts can be applied.
Real-Life Gantt Chart Examples
In this section, we will learn from 6 cases presented in different niches. What are the requirements to create high-quality documents for further reference as the projects get into action, suggestions for slide design, and how to properly place data inside these Gantt Charts. For each example, we will use one SlideModel template to speed up the design process. Check how to edit Gantt Chart templates for PowerPoint here.
Case 1: Gantt Chart Example for a Construction Project
The Maple Heights Construction Project was initiated in January 2023, aiming to build a residential complex in a suburban area. The project was estimated to take 18 months, with a budget of $50 million. The construction company, BuildWell Constructors, faced challenges ensuring timely delivery while managing multiple subcontractors and maintaining quality standards.
1) Tasks
- Groundwork: Site clearing, excavation, and leveling.
- Foundation: Laying the foundation, including concrete and steel work.
- Structural Work: Erecting the building structure, floors, and roofing.
- Exterior Development: Facade, windows, and external plumbing and electrical fittings.
- Interior Work: Interior walls, flooring, and installation of fixtures.
- Finishing: Painting, final installations, landscaping, and exterior finishing.
2) Milestones
- Groundbreaking: The starting point of the groundwork.
- Foundation Completion: Completion of the foundation laying.
- Structural Completion: Completion of the main building structure.
- Lock-Up Stage Reached: Exterior development completed, making the building weatherproof.
- Interior Ready: Completion of all interior work.
- Project Completion: All finishing work is done, and the building is ready for handover.
3) Dependencies
- Foundation Depends on Groundwork: Foundation work can only start after the completion of site clearing and leveling.
- Structural Work Depends on Foundation: Structural work begins only after the foundation is laid.
- Exterior Development Depends on Structural Completion: External work starts after completing the building structure.
- Interior Work Depends on Lock-Up Stage: Interior fittings and installations begin after the building is weather-proof.
- Finishing Depends on Interior Completion: Final touches like painting and landscaping are done after all interior work is finished.
4) Timeframe
- Groundwork: January – February 2023.
- Foundation: March – April 2023.
- Structural Work: May – August 2023.
- Exterior Development: September – November 2023.
- Interior Work: December 2023 – March 2024.
- Finishing: April – June 2024.
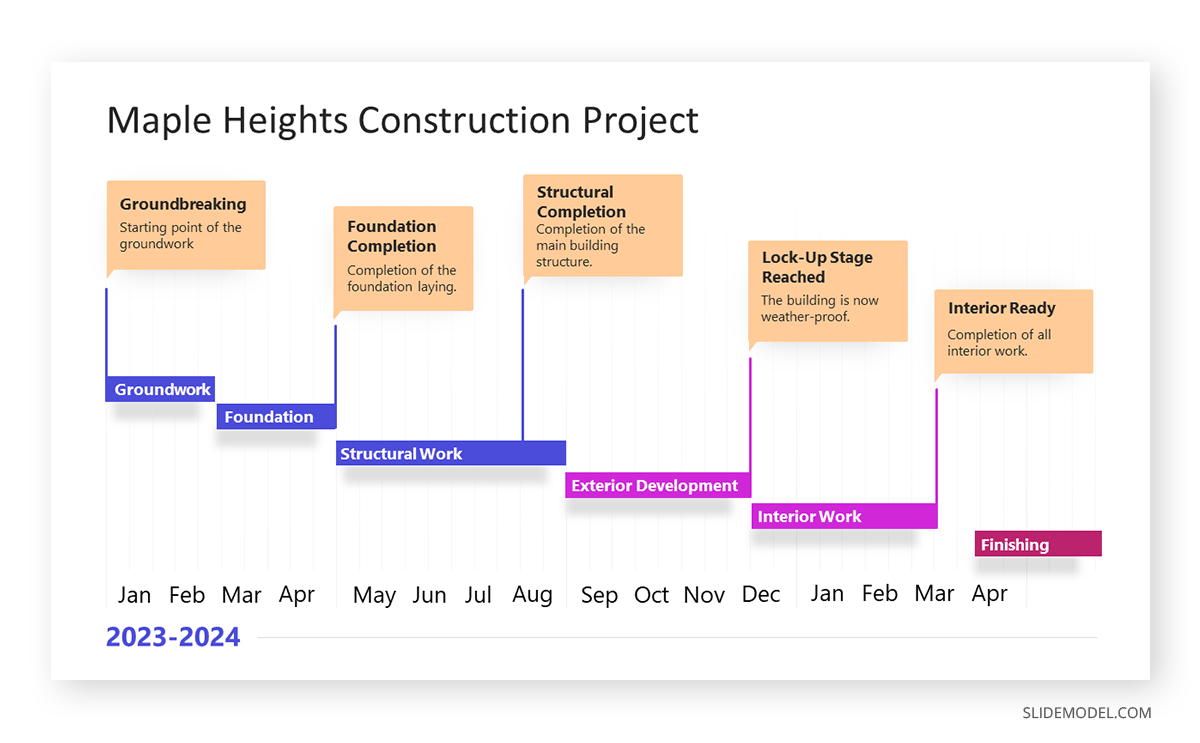
Out of this information, two types of Gantt Charts can be created. The first one is a generalist overview in which we see the core tasks. On a second level, the individual Gantt Charts for each of the groups of tasks defined in the first step. For this example, we shall work with the generalist one.
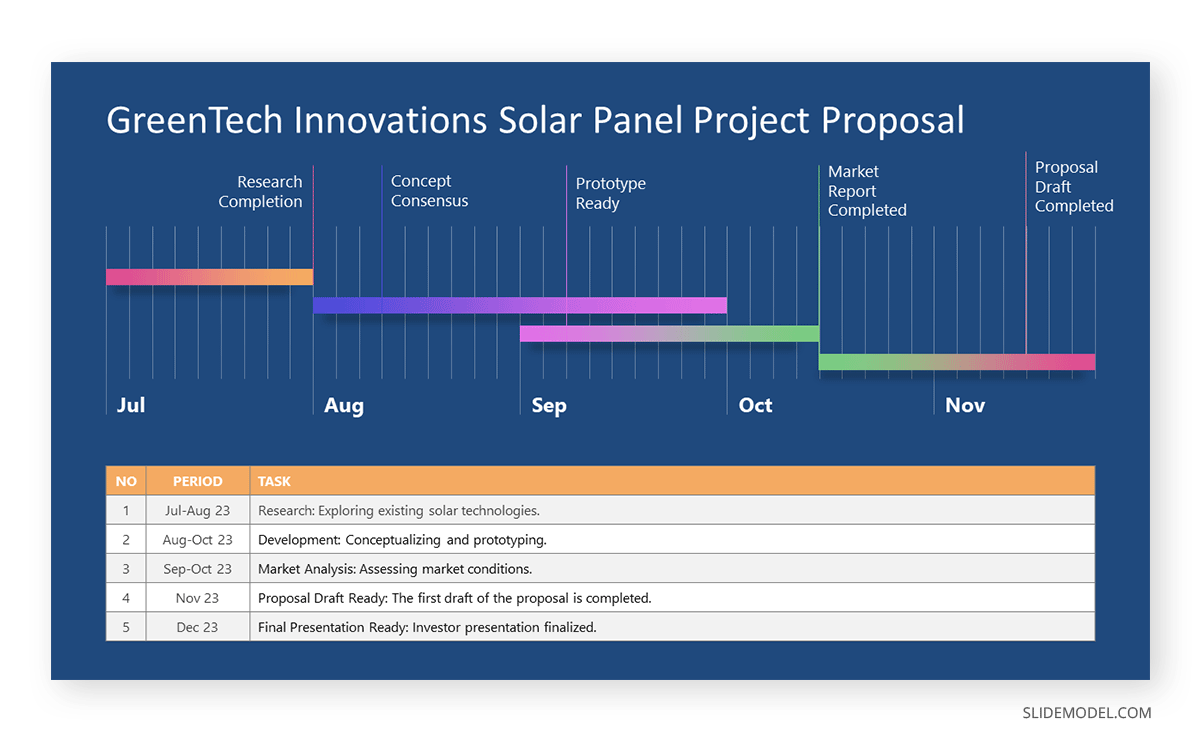
Case 2: Gantt Chart Example for Project Proposal
GreenTech Innovations, a startup specializing in renewable energy solutions, embarked on a project in July 2023 to develop a new solar panel technology. The project, spanning six months, aimed to result in a comprehensive proposal for potential investors.
Rather than the typical roadmap template, their team now requires a Gantt Chart to allocate their efforts in crafting an attractive project proposal within a very tight agenda.
1) Tasks
- Research: Exploring existing solar technologies.
- Development: Conceptualizing and prototyping.
- Market Analysis: Assessing market conditions.
- Proposal Drafting: Creating the proposal document.
- Presentation Preparation: Developing the final investor presentation.
2) Milestones
- Research Completion: All necessary data on solar technology gathered.
- Conceptualizing: Concept consensus.
- Prototype Completion: The first prototype of the new design is ready.
- Market Analysis Completion: Comprehensive market report prepared.
- Proposal Draft Ready: The first draft of the proposal is completed.
- Final Presentation Ready: Investor presentation finalized.
3) Dependencies
- Development Depends on Research: Prototyping starts the post-research phase.
- Market Analysis Parallel to Development: Conducted alongside the development phase.
- Proposal Drafting Depends on Market Analysis Completion: Proposal writing starts after market analysis.
- Presentation Preparation Follows Proposal Drafting: The final presentation is prepared after the proposal draft is ready.
4) Timeframe
- Research: July – August 2023.
- Development: August – October 2023.
- Market Analysis: September – October 2023.
- Proposal Drafting: November 2023.
- Presentation Preparation: December 2023.
Case 3: Gantt Chart for Software Development
Orion Tech, a software development company, initiated a project in January 2022 to develop a new customer relationship management (CRM) software. The “OrionCRM” project was slated for completion over 12 months to create a robust, user-friendly CRM platform with full integration with WordPress.
1) Tasks
- Requirements Gathering: Identifying user needs and technical specifications.
- Design: Creating system and UI/UX designs.
- Development: Writing and integrating code.
- Testing: Ensuring functionality and reliability.
- Deployment: Launching the software for users.
- Post-Deployment Support: Ongoing maintenance and updates.
2) Milestones
- Requirements Finalized: Completion of the requirements gathering phase.
- Design Sign-Off: Final approval of system and UI/UX designs.
- Development Completion: All coding and feature integration are finished.
- Successful Testing: All tests passed with minimal issues.
- Official Launch: Software made available to users.
- First Update Release: Release of the first software update post-launch.
3) Dependencies
- Design Depends on Requirements: The design phase starts after finalizing requirements.
- Development Follows Design: Coding begins post-design approval.
- Testing after Development: The testing phase begins once development is complete.
- Deployment Post Testing: Deployment only after successful testing.
- Post-Deployment Support Ongoing: Starts after deployment and continues indefinitely.
4) Timeframe
- Requirements Gathering: January – February 2022.
- Design: March – April 2022.
- Development: May – August 2022.
- Testing: September – October 2022.
- Deployment: November 2022.
- Post-Deployment Support: December 2022 onwards.
Since changes were implemented to the original agenda, the team had to update the Gantt Chart, plus create an extra document reflecting the original vs. the new dates and the causes behind the delays.
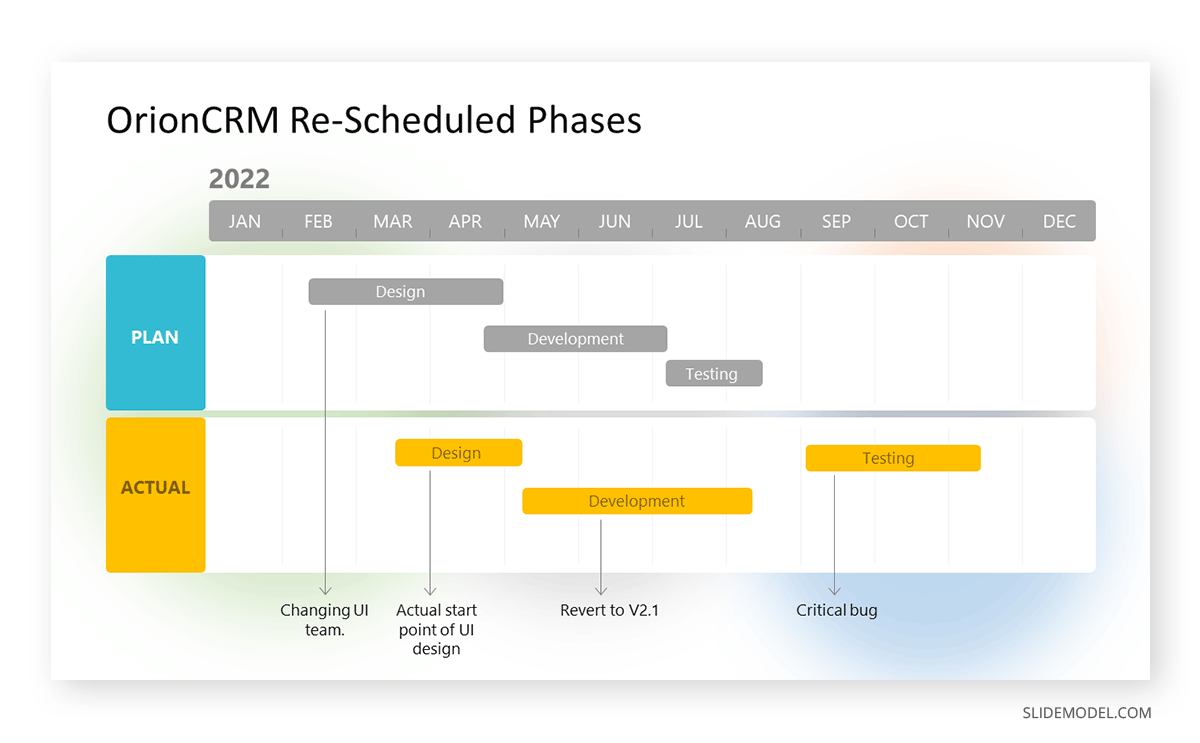
As experience tells us, software development projects are not precisely predictable regarding agenda. The UI team was sacked at the initial stages of the project due to inconsistencies regarding budget and expected delivery. This led to a delay in the original starting date for the Design Phase, as well as the Development one.
During the testing phase, several bugs were found to delay the deployment phase, requiring the project management team to update the Gantt Chart with the new estimated dates for Deployment and Post-Deployment Support (originally intended for October and November, respectively). This highlights the importance of counting with an editable document that helps us change the estimated deadlines and pinpoint the reasons why that happened — which can be further explained in the complementary document.
Case 4: Gantt Chart for Event Planning
In 2022, PlanIt Event Management embarked on organizing a large international tech conference scheduled for mid-2023. The event, named “Global TechCon 2023,” was to host over 5000 attendees, featuring keynotes, workshops, and networking sessions. The challenge was to meticulously plan and coordinate various aspects of the event within a tight timeframe.
1) Tasks
- Venue Selection: Choosing and booking the event location.
- Vendor Coordination: Arranging catering, decoration, and technical setup.
- Marketing and Promotion: Implementing marketing strategies and handling ticket sales.
- Participant Management: Engaging with speakers and managing attendee information.
- Event Execution: Facilitating the smooth operation of the event.
2) Milestones
- Venue Confirmed: Venue booking finalized.
- Vendors Secured: All vendor contracts signed.
- Registration Open: Launch of ticket sales.
- Speakers Finalized: Confirmation of all keynote and workshop speakers.
- Event Day: The day of Global TechCon 2023.
3) Dependencies
- Vendor Coordination Depends on Venue Selection: Vendors finalized post-venue booking.
- Marketing Starts Post Venue Confirmation: Marketing campaigns are initiated after securing the venue.
- Participant Management Parallel to Marketing: Concurrent with marketing efforts.
- Event Execution Following All Preparations: The execution phase commences after completing all planning phases.
4) Timeframe
- Venue Selection: July – August 2022.
- Vendor Coordination: September – October 2022.
- Marketing and Promotion: November 2022 – June 2023.
- Participant Management: January – June 2023.
- Event Execution: Mid-July 2023.
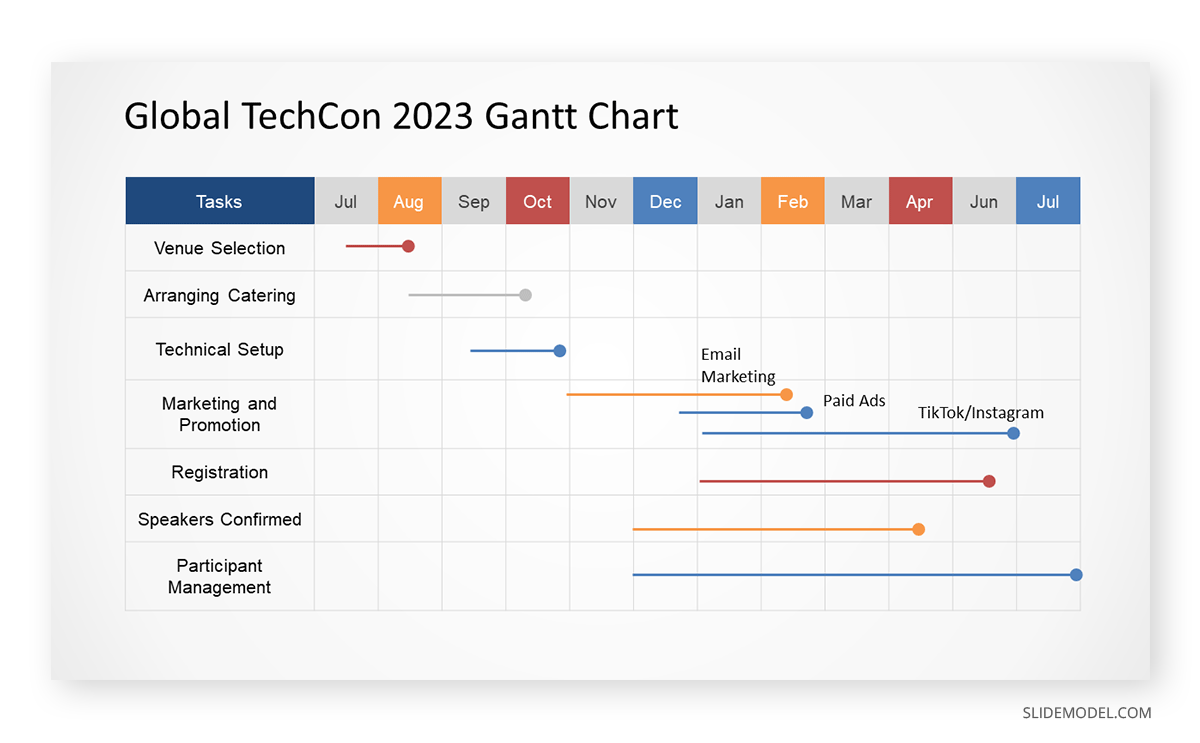
Like in the previous case, last-minute changes (speakers who couldn’t make it to the event) required reallocating efforts, planning new activities, or contacting other experts in the area. Since the original Gantt Chart gave a clear overview of the time available before the event execution, the organizers had 20 days to solve the presented issue.
Case 5: Gantt Chart for Product Launch
By Q1 2022, AquaPure Innovations, a company specializing in home water filtration systems, planned the launch of their latest product, the AquaPure Advanced Filter. The launch was scheduled for mid-2023, aiming to enter a competitive market with a state-of-the-art filtration system. Although this case may have some elements in common with Case #2, its implementation differs as it doesn’t dwell on the proposal phase but aims for a completed and sellable product.
1) Tasks
- Product Development: Designing and developing the product.
- Market Research: Conducting market analysis and target audience identification.
- Marketing Strategy Development: Planning marketing and advertising campaigns.
- Production Scaling: Setting up mass production processes.
- Distribution Planning: Organizing logistics and distribution networks.
- Launch Campaign: Implementing the marketing and sales strategy.
- Post-Launch Review: Evaluating the launch’s success and planning future steps.
2) Milestones
- Prototype Completion: Finalization of the product prototype.
- Market Research Report: Completion of market analysis.
- Marketing Plan Finalized: Final approval of the marketing strategy.
- Production Ready: Start of mass production.
- Launch Date: Official product launch in the market.
- Post-Launch Analysis Completed: Review and analysis of launch success.
3) Dependencies
- Market Research Before Marketing Strategy: Marketing strategy depends on the insights from market research.
- Marketing Strategy Before Launch Campaign: The launch campaign is based on the marketing strategy.
- Production Scaling Before Launch Date: Mass production must be ready before the launch.
- Post-Launch Review Following Launch Campaign: Evaluation happens after the launch.
4) Timeframe
- Product Development: January – April 2022.
- Market Research: February – May 2022.
- Marketing Strategy Development: June – August 2022.
- Production Scaling: September 2022 – February 2023.
- Distribution Planning: November 2022 – March 2023.
- Launch Campaign: April – June 2023.
- Post-Launch Review: July – August 2023.
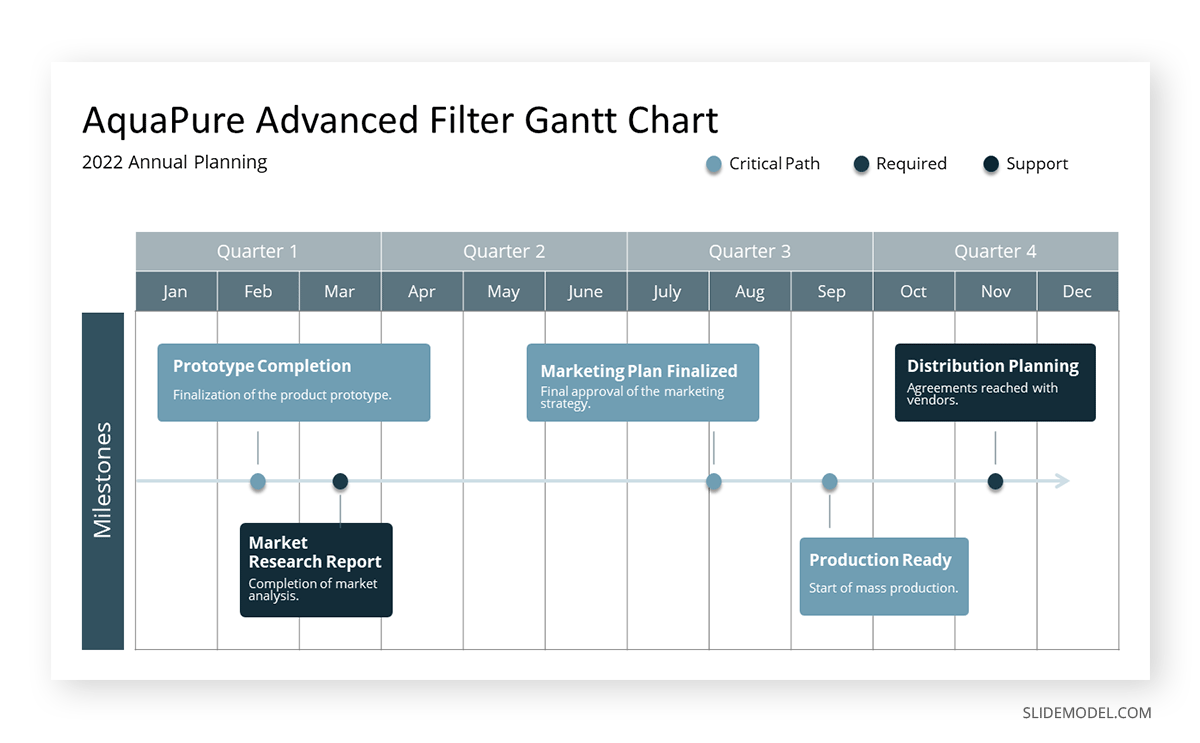
As a result of implementing the example Gantt Chart shown above, the team managed to synchronize efforts across different departments, leading to a smooth launch.
Case 6: Gantt Chart for Marketing Campaign
ChicFashions, a boutique fashion retailer, initiated a strategic rebranding campaign in early 2023. The objective was to modernize the brand’s image, targeting a younger, trend-conscious demographic. The campaign’s primary focus was on leveraging social media platforms, specifically Instagram and TikTok, known for their substantial influence on fashion trends and youth engagement.
1) Tasks
- Content Creation: Producing photos, videos, and graphics.
- Social Media Strategy Development: Crafting a detailed posting schedule and influencer collaboration plan.
- Launch Plan Execution: Coordinated release of campaign content across platforms.
- Monitoring & Adjustment: Ongoing analysis of engagement metrics and fine-tuning the campaign.
2) Milestones
- Content Bank Ready: A complete set of initial content prepared for launch.
- Strategy Finalization: The social media strategy is fully developed and ready for implementation.
- Campaign Launch: Official start of the rebranding campaign on Instagram and TikTok.
- First Review: Initial assessment of campaign performance.
3) Dependencies
- Strategy Development Depends on Content Creation: Social media strategy is based on the available content types and themes.
- Launch Plan Execution Depends on Strategy Finalization: The launch is contingent on the completion of the social media strategy.
- Monitoring & Adjustment Follows Launch: Analysis and adjustments are made post-launch.
4) Timeframe
- Content Creation: January – February 2023.
- Social Media Strategy Development: March 2023.
- Launch Plan Execution: April 2023.
- Monitoring & Adjustment: May – June 2023.
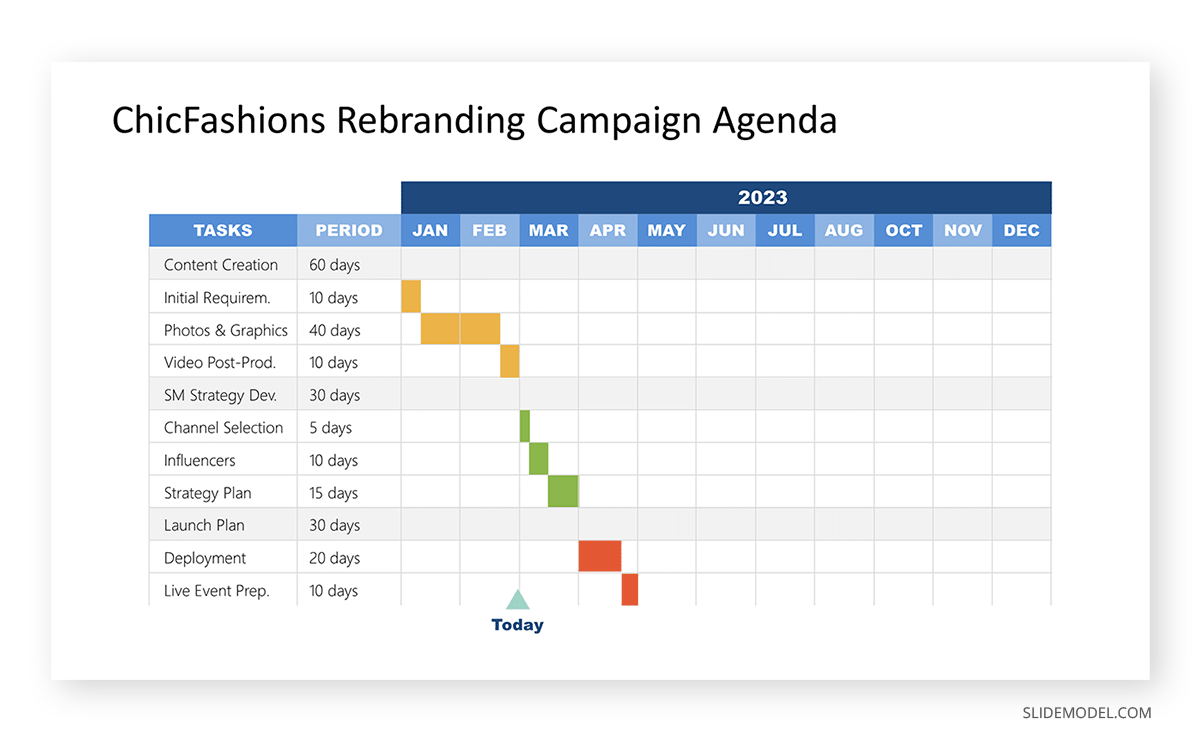
In cases like this, teams can work with Free Gantt Chart templates and get exceptional results, crafting a document that can be updated or repurposed for other customers with similar projects.
Common Mistakes in Gantt Chart Creation
Although Gantt charts are relatively easy to craft once you understand their structure and requirements, there are some common mistakes seen in presentations that we would like to address in this section, for improving the quality of your work.
Mistake #1 – Ignoring Dependencies
Failing to accurately represent task dependencies can lead to unrealistic timelines and inefficient resource allocation. This will build up a snowball effect, potentially threatening to affect the project’s completion rate.
Mistake #2 – Neglecting Buffer Times
Not including buffer times for unforeseen delays can lead to cascading delays in the project. Always account for potential setbacks. A good rule is to consider a 10-15 percent ‘safe time buffer’ for potential delays. In case the delays take longer, update the document to reflect the changes.
Mistake #3 – Underestimating Resource Allocation
Much like money and time, resources are a finite element. Ignoring the resource count or overestimating expectations out of them results in bottlenecks.
Mistake #4 – Insufficient Detail on Task Breakdown
Although Gantt Charts can be displayed in an overview format, it is required to do a proper task breakdown and show them in individual Gantt Charts so all elements can be tracked. Ignoring this approach leads to inaccurate task completion times and failing to follow dependencies.
Mistake #5 – Poor Integration with Budgeting
Failing to link the Gantt chart with the budgeting aspects of the project can lead to cost overruns and financial mismanagement.
Mistake #6 – Inaccurate Color Scheme
Whenever we build a Gantt Chart template, we aim for clarity in the document. If that chart presents inconsistencies across the color scheme used, tasks and dependencies won’t be clearly identified. This is a really common mistake that consumes countless hours in trying to interpret which dependency belongs to each task and what were the criteria used for the chart.
Recommended Gantt Chart PowerPoint & Google Slides Templates
1. Gantt Chart for Project Management PowerPoint Template

If you’re looking to discover what a Gantt Chart is, this template is the perfect example to work on all your project management plans. Easy to customize, it introduces a series of arrows to further illustrate dependencies. Icons to signal revision points are also included.
2. Work Status Project Gantt Chart Timeline PowerPoint Template

Create a high-level document that helps to understand where your workforce resources are being allocated and how much time each employee spends working on each project. A simple template layout with 100% customizable PowerPoint elements.
3. Product Roadmap Gantt Chart Example Template
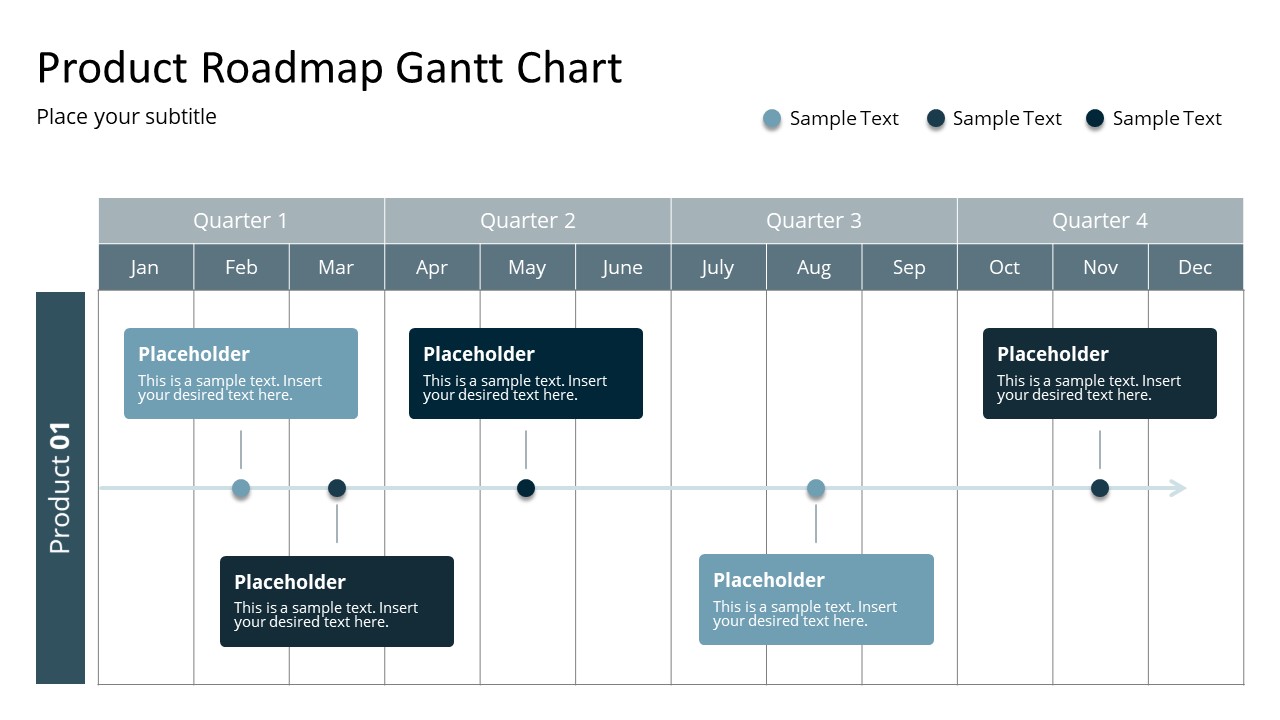
Track the progress of simultaneous product releases by implementing this swimlane format Gantt Chart template. It allows us to capture as many products as required, introducing the required details for their completion.
4. Data Driven Waterfall Format Gantt Chart PowerPoint Template
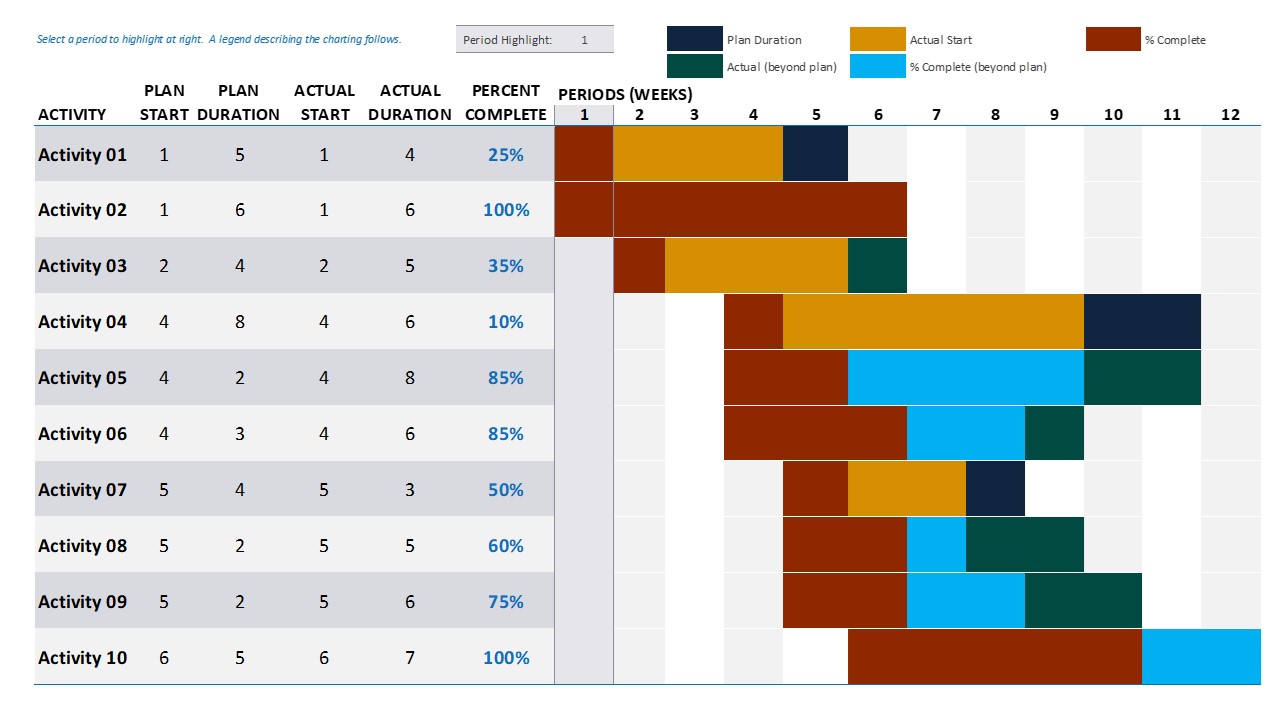
A common representation of the Gantt Chart in the manufacturing industry is the waterfall chart. In this case, we present a data-driven template intended for logistics, manufacturing, or any project requiring special attention to detail and can be fed through traceable sensor data. The ideal companion for your Excel or PowerBI reports.
5. Minimalistic Design Gantt Chart Example Template
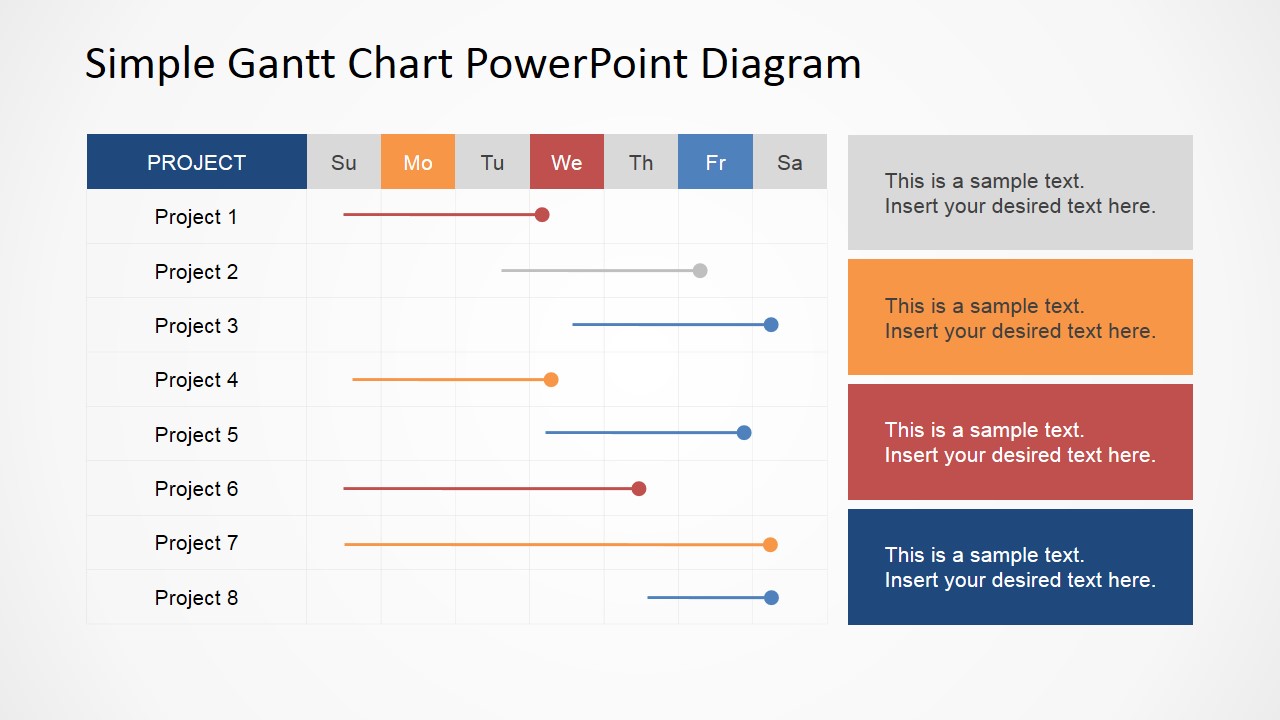
If you are looking for a cleaner layout in your Gantt Chart example for a project proposal, this template featuring clean lines rather than bar charts may be the answer. The usability of this template is exactly the same as other Gantt Chart templates, but it is presented as a decluttered version with more space for milestone tags.
6. RAG Dashboard Gantt Chart Template
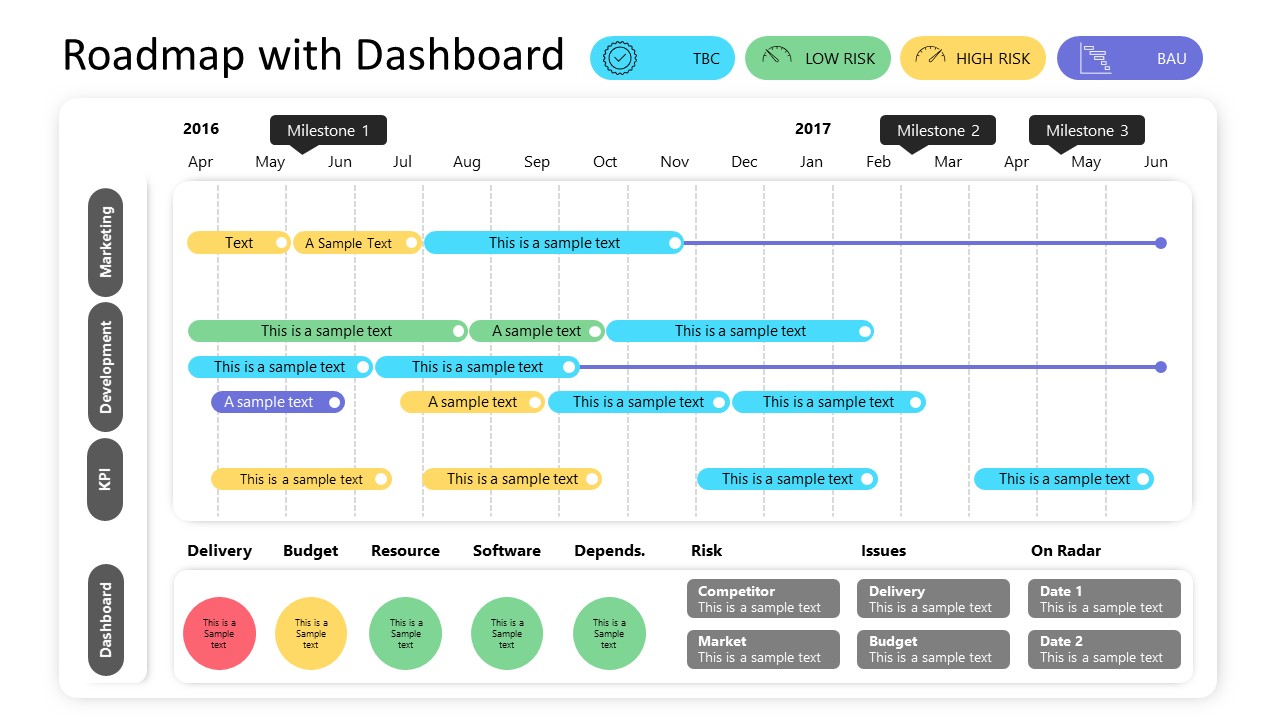
The Red-Amber-Green model is used to organize tasks according to their importance level. In the Gantt Chart application, this model is particularly interesting for production processes. The dashboard format can help us to create reports with powerful visuals in just minutes.
Final Words
As we have seen, Gantt Charts are versatile tools for presenters looking at how to start a presentation in style, as they invite the transformation of the typical presenter-spectators meeting format into interactive presentations through debating the different project aspects. As a tool, they serve as a referenceable document that can be addressed whenever an inconvenience happens with the expected deadlines or simply to check the project advancement rate.
We hope these insights can help you master the usage of Gantt Charts. See you next time!
References
[1] Albrecht, J., 2018. GIS Project Management. https://www.sciencedirect.com/science/article/abs/pii/B9780124095489096123
[2] Geraldi, J. and Lechter, T., 2012. Gantt charts revisited: A critical analysis of its roots and implications to the management of projects today. International Journal of Managing Projects in Business, 5(4), pp.578-594. https://www.emerald.com/insight/content/doi/10.1108/17538371211268889/full/html
[3] GANTT Chart (2023) Go to City Tech OpenLab. Available at: https://openlab.citytech.cuny.edu/ent-projectmanagement/gantt-chart/#:~:text=He%20developed%20Gantt%20charts%20in,network%20which%20started%20in%201956.
[4] Rebiere, O. and Rebiere, C., 2017. Mastering the Gantt Chart: Understand and use the” Gantt Project” open-source software efficiently! (Vol. 1). Rebiere.
[5] Kumar, P.P., 2005. Effective use of Gantt chart for managing large-scale projects. Cost engineering, 47(7), p.14. https://www.proquest.com/openview/72672e5266e73976dcac3c515234115e/1?pq-origsite=gscholar&cbl=49080
[6] Ramachandran, K.K. and Karthick, K.K., 2019. Gantt chart: An important tool of management. Int. J. Innov. Technol. Explor. Eng, 8(7). https://www.researchgate.net/profile/Ramachandran-K-K-3/publication/358234055_Gantt_Chart_An_Important_Tool_of_Management/links/61f78cc7007fb5044727d77d/Gantt-Chart-An-Important-Tool-of-Management.pdf
[7] Caballero Villalobos, J.P., Jarro Sanabria, S.P. and García Cáceres, R.G., 2011. Activity scheduling through Gantt charts in an MS Excel spreadsheet. Revista Facultad de Ingeniería Universidad de Antioquia, (61), pp.132-145. http://www.scielo.org.co/pdf/rfiua/n61/n61a14.pdf
[8] Yakura, E.K., 2002. Charting time: Timelines as temporal boundary objects. Academy of Management Journal, 45(5), pp.956-970.