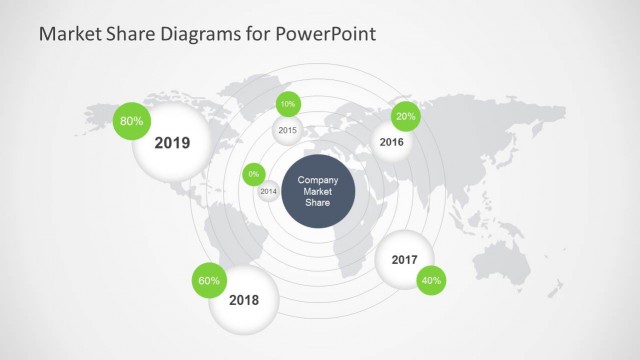
The Global Market Share PowerPoint template contains functional market share diagrams and charts you can use to present market share data in a PowerPoint or business project presentation. This presentation slide design with a Global Market Share chart has a world map illustration at the slide’s background and circular shapes with an amount inside representing the respective market shares of companies or business units.
The presentation template on market share data can be used to describe a competitive landscape slide in a pitch deck presentation or as part of a competitor analysis presentation.
Alternatively, you can download other business marketing PowerPoint templates and slide designs, including popular business models and presentations with market share slides and infographics that can be a good complement when presenting the market share of any business.
What’s inside this template
Example presentation scenarios
- A marketing manager can use the world map bubble diagram to show regional market share and explain where the company has the largest or smallest footprint.
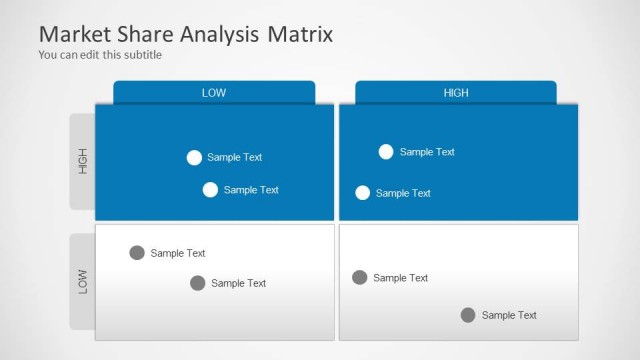
- A product manager can use the bubble chart to compare business units, product lines, or competitors by size and position across two market variables.
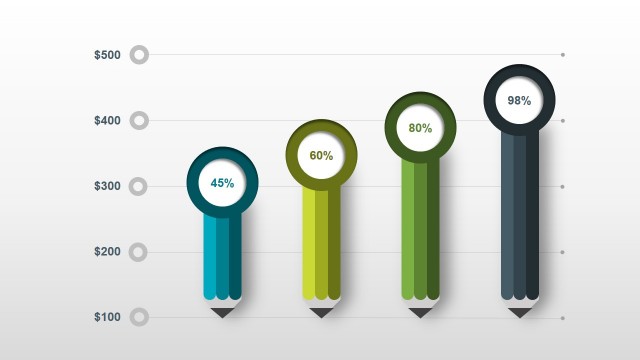
- A strategy consultant can use the KPI cards and line chart to summarize share trends before recommending a market entry or expansion decision.
- A startup founder can use the map and bubble layouts in an investor pitch to present market opportunity and competitor concentration without building custom diagrams.
Features
- 100% editable presentation template
- Compatible with Microsoft PowerPoint and Google Slides
- 16:9 aspect ratio slides
- Scalable vector shapes, icons and illustrations
- AI-Ready for Microsoft Copilot and Claude
- Instant access and download
Frequently asked questions
Q: How should I present market share clearly with this template?
A: Start with the world map bubble slide to establish where the market is concentrated, then use the bubble chart to compare competitors or segments on two variables. Close with the KPI cards and line chart to summarize totals and movement over time. Keep one data story per slide so bubble size, percentage callouts, and trend lines do not compete.
Q: Who is this template best suited for?
A: This template fits marketing, product, strategy, and consulting presenters who need to explain market position at a high level. It is strongest when the audience needs to compare regions, competitors, or product portfolios quickly. The map bubbles communicate scale, while the line chart supports a short discussion of trend direction.
Q: Why use map bubbles and bubble charts instead of a table?
A: The bubble metaphor turns share and volume into visible size, making differences easier to scan than rows of numbers. The world map adds geographic context, while the standalone bubble chart lets the presenter explain relative position. Together, they separate the questions of where the market is and how each player compares.
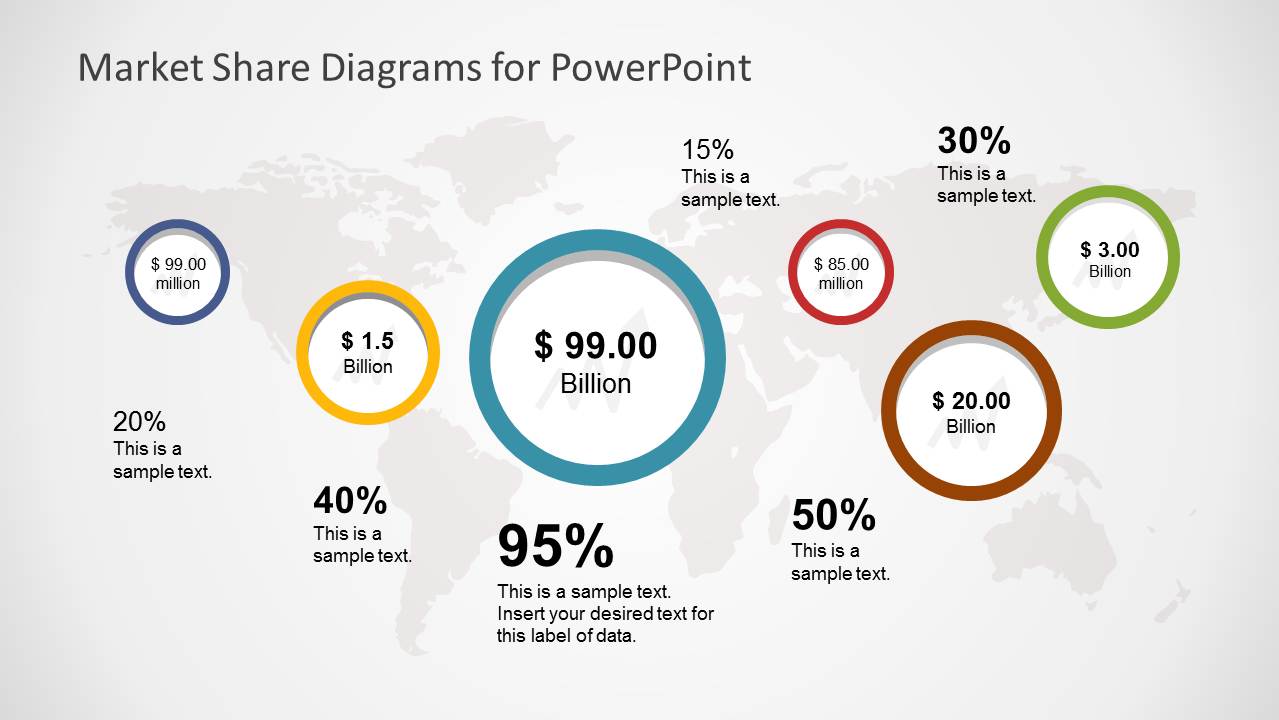


Global Market Share PowerPoint Template
6-slide presentation template for global market share, bubble charts, and competitor analysis diagrams
The Global Market Share PowerPoint Template is a 6-slide diagram set for presenting market share and competitor position across regions. It includes world map bubble diagrams, bubble charts, KPI summary boxes, and line charts for trend comparison. Designed for marketing, product, and strategy teams in Microsoft PowerPoint and Google Slides.
- Category
- Diagrams
- Rating


 Loading...
- Aspect ratio
- 16:9
- Item ID
- 6168-02
- Colors
 Microsoft PowerPoint
 Microsoft Copilot
 Claude for PowerPoint
Other formats supported
Subscribe today and get immediate
access to download our PowerPoint templates.