Slide 1 of 6 from Global Market Share PowerPoint Template
Global Market Share PowerPoint Template with World Map
Market Share Bubble Chart for Presentations
- Chart
- Bubble Chart
- Strategic Analysis Slide
- 16:9
- 100% Editable
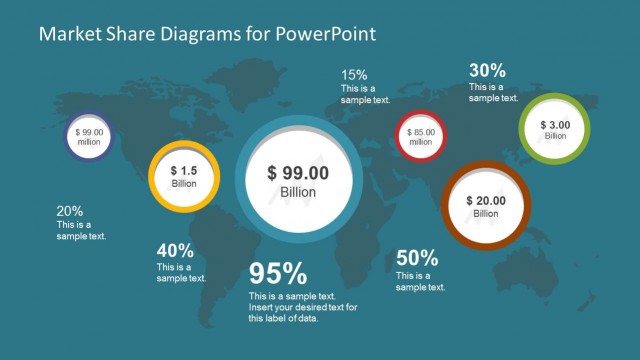
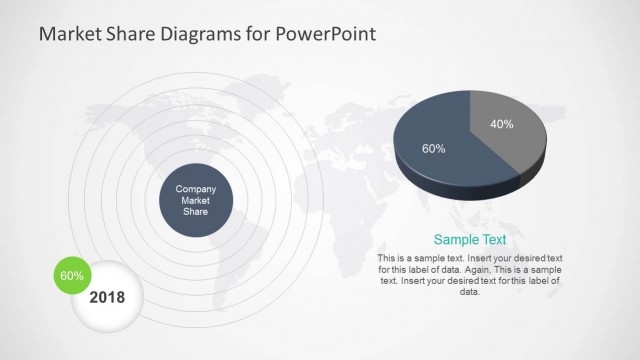
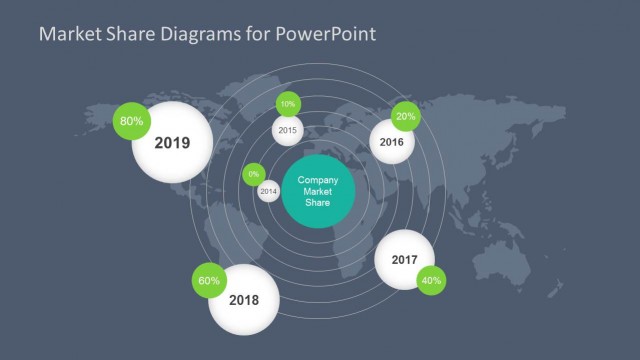
The Market Share Bubble Chart slide from the Global Market Share PowerPoint Template offers a clear visualization of competitive data using editable shapes and vector icons. Designed for business presentations and strategic analysis, this slide template supports market share comparisons across regions with distinct bubble sizes and colors, enhancing clarity in corporate presentations and pitch deck templates.
What’s on This Slide
The layout features a world map background with several circular nodes positioned around it. Each node displays market share values, with varying sizes and colors to indicate different data points. The largest node, centered, shows a value of $99.00 billion, while others display values ranging from $3.00 billion to $99.00 million. Text placeholders are aligned within each node, with some positioned above or below the circles. The overall composition is balanced, with nodes evenly spaced to maintain visual clarity. The color scheme includes blue, green, orange, and red hues.
How to Use It
This layout serves as a bubble chart for visualizing market share data across different regions or products. It fits well in presentations discussing market analysis or competitor positioning. This structure is useful for marketing teams to highlight key metrics and comparisons in a visually engaging manner. It can be employed in business meetings or strategy sessions where data-driven insights are essential for decision-making.
Text Placeholders & Capacity
Keep your copy within these limits so it fits without resizing. Node labels can hold about 20 characters each.
| Placeholder | Count | Max characters (approx.) |
|---|---|---|
| Item body | 6 | 30 |
| Item heading | 6 | 20 |
Slide Keywords
Download unlimited PowerPoint templates, charts and graphics for your presentations with our annual plan.
DOWNLOADReturn to Global Market Share PowerPoint Template.