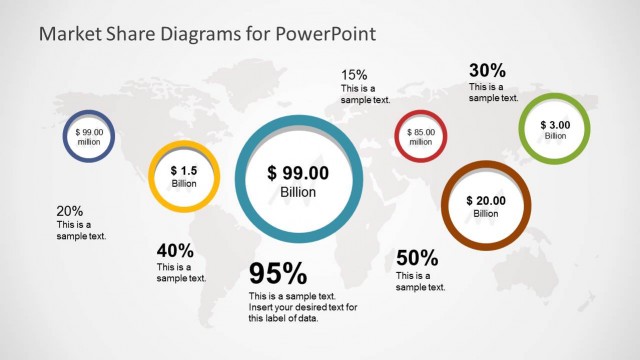
Slide 4 of 6 from Global Market Share PowerPoint Template
Business Market Share Diagram for PowerPoint
Market Share Bubble Chart for Presentations
- Diagram
- Bubble Chart
- Comparison Slide
- 16:9
- 100% Editable
The Market Share Bubble Chart slide from the Global Market Share PowerPoint Template offers a clear visual comparison of regional market values using editable shapes and vector icons. This slide layout is ideal for business presentations focused on competitor positioning and product development, providing a balanced design with a world map background that enhances data visibility in corporate presentation slide decks.
What’s on This Slide
The layout features a world map as the background, with circular nodes positioned across various regions. Each node displays market share data in different sizes and colors, indicating varying values. The largest node, centered, shows $99.00 billion, while others display values like $1.5 billion and $20.00 billion. Text placeholders are present within each node, aligned centrally. The overall composition is balanced, with nodes grouped by size and color to signify importance. The background is a solid teal, enhancing the visibility of the nodes.
How to Use It
This layout serves as a bubble chart to visualize market share across different regions. It fits well in a presentation sequence after introducing market analysis or competitor positioning. Ideal for business scenarios such as competitor analysis, market research, and product development discussions. It allows for a clear comparison of market values and shares, making it suitable for strategic planning sessions.
Text Placeholders & Capacity
Keep your copy within these limits so it fits without resizing. Node body slots can hold about 5-6 words each.
| Placeholder | Count | Max characters (approx.) |
|---|---|---|
| Item body | 6 | 30 |
| Slide title | 1 | 40 |
Slide Keywords
Download unlimited PowerPoint templates, charts and graphics for your presentations with our annual plan.
DOWNLOADReturn to Global Market Share PowerPoint Template.