Slide 2 of 6 from Global Market Share PowerPoint Template
Market Share Slide Design for PowerPoint
Market Share Bubbles Chart for Analysis
- Chart
- Bubble Chart
- Comparison Slide
- 16:9
- 100% Editable
The Market Share Bubbles Chart slide from the Global Market Share PowerPoint Template offers a clear visual comparison of market positioning using editable shapes and vector icons. This slide layout is ideal for business presentations focused on competitor analysis and product performance, providing a professional way to display market share data within a corporate presentation or pitch deck template.
What’s on This Slide
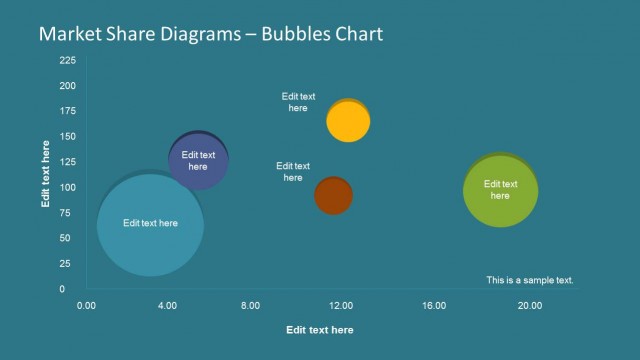
The layout features a bubble chart positioned centrally, with a vertical axis on the left labeled with values up to 225 and a horizontal axis at the bottom ranging from 0 to 20. There are five bubbles of varying sizes and colors, each representing different data points. Text placeholders are located within each bubble for labeling, and additional text placeholders are positioned at the bottom and right for axis labels. The background is a light gradient, enhancing the visibility of the bubbles and text.
How to Use It
This layout serves as a data visualization tool to compare market share across different entities or products. It fits well in a presentation sequence after introducing market dynamics or competitor analysis. Business scenarios include presenting market positioning, analyzing competitor strengths, or showcasing product performance in a visual format. It is suitable for marketing and product management discussions.
Text Placeholders & Capacity
Keep your copy within these limits so it fits without resizing. Node labels can accommodate roughly 20 characters each.
| Placeholder | Count | Max characters (approx.) |
|---|---|---|
| Chart title | 1 | 30 |
| Item heading | 5 | 20 |
| Axis label | 2 | 15 |
| Body paragraph | 1 | 50 |
Slide Keywords
Download unlimited PowerPoint templates, charts and graphics for your presentations with our annual plan.
DOWNLOADReturn to Global Market Share PowerPoint Template.