Slide 5 of 6 from Global Market Share PowerPoint Template
6168-02-market-share-diagrams-5
Market Share Bubbles Chart for Analysis
- Chart
- Bubble Chart
- Strategic Analysis Slide
- 16:9
- 100% Editable
The Market Share Bubbles Chart slide from the Global Market Share PowerPoint Template offers a clear visual tool for competitor analysis and product portfolio assessment. This slide layout uses editable shapes and vector icons to represent market share data dynamically, making it suitable for business presentations focused on strategic market positioning. Its design supports effective communication of complex data within a corporate presentation or pitch deck template.
What’s on This Slide
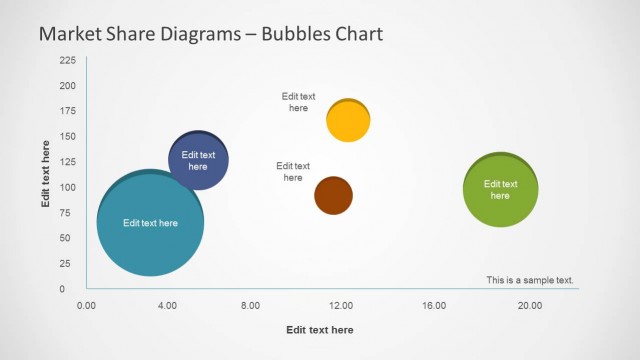
The slide features a bubbles chart positioned centrally against a teal background. The vertical axis measures values up to 225, while the horizontal axis ranges from 0 to 20. Five bubbles of varying sizes represent different data points, with labels positioned inside each bubble. The largest bubble is at the bottom left, while smaller bubbles are distributed towards the right and top. Text placeholders are present for the chart title, axis labels, and bubble labels, with the title at the top and axis labels along the left and bottom edges. The overall layout emphasizes the relationship between the data points.
How to Use It
This layout serves as a bubbles chart for visualizing market share data across multiple competitors or products. It fits well in a presentation sequence focused on market analysis, following slides that introduce the market context or competitor landscape. This structure is useful in business scenarios like competitor analysis, portfolio assessment, or product development discussions, allowing stakeholders to quickly grasp market positioning and share dynamics.
Text Placeholders & Capacity
Keep your copy within these limits so it fits without resizing. Node labels can accommodate roughly 3-5 words each.
| Placeholder | Count | Max characters (approx.) |
|---|---|---|
| Chart title | 1 | 30 |
| Axis label | 2 | 20 |
| Item heading | 5 | 15 |
| Body paragraph | 1 | 50 |
Slide Keywords
Download unlimited PowerPoint templates, charts and graphics for your presentations with our annual plan.
DOWNLOADReturn to Global Market Share PowerPoint Template.