Slide 3 of 6 from Global Market Share PowerPoint Template
Line Chart Slide Design for PowerPoint Presentations on Market Share
Market Share Summary Chart for Analysis
- Chart
- Line Chart
- Comparison Slide
- 16:9
- 100% Editable
The Market Share Summary Chart slide from the Global Market Share PowerPoint Template offers a clear line chart layout ideal for presenting market share trends and competitor comparisons. This slide layout supports business presentations by visually comparing financial data over time, using editable shapes and vector icons to enhance clarity in corporate presentations or pitch deck templates.
What’s on This Slide
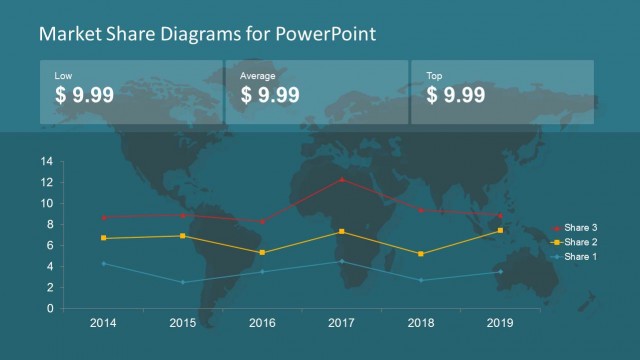
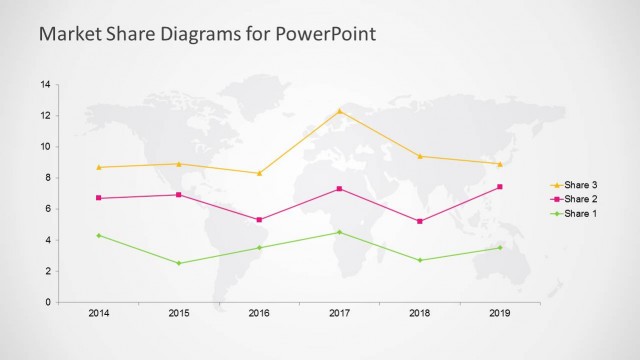
The slide features a line chart positioned centrally, displaying market share trends over time. The x-axis represents years from 2014 to 2019, while the y-axis indicates market share values ranging from 0 to 14. Three distinct lines, each representing different market shares, are color-coded: red for Share 3, yellow for Share 2, and blue for Share 1. Above the chart, three text placeholders are aligned horizontally, labeled 'Low,' 'Average,' and 'Top,' with corresponding dollar values. The background is a light gray with a subtle world map pattern.
How to Use It
This layout serves as a comparative analysis tool for market share trends over multiple years. It fits well in a presentation sequence after introducing market share concepts and before discussing specific strategies. This slide is suitable for business scenarios involving competitor analysis, market positioning, and financial forecasting. It can be used to illustrate changes in market dynamics and inform decision-making processes.
Text Placeholders & Capacity
Keep your copy within these limits so it fits without resizing. Node labels can hold about 10 characters each, while the title can accommodate 30 characters.
| Placeholder | Count | Max characters (approx.) |
|---|---|---|
| Chart title | 1 | 30 |
| Item heading | 3 | 10 |
| Item body | 3 | 10 |
Slide Keywords
Download unlimited PowerPoint templates, charts and graphics for your presentations with our annual plan.
DOWNLOADReturn to Global Market Share PowerPoint Template.