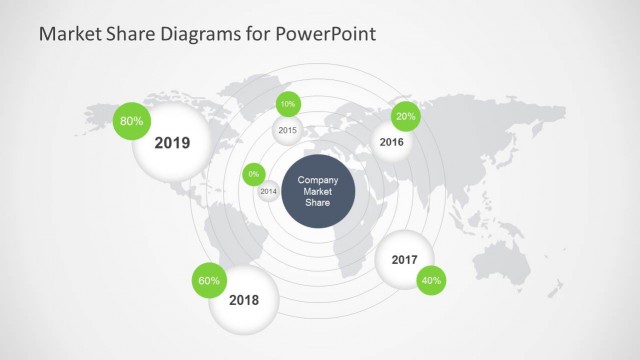
Slide 6 of 6 from Global Market Share PowerPoint Template
6168-02-market-share-diagrams-6
Market Share Trend Analysis for PowerPoint
- Chart
- Line Chart
- Evaluation Slide
- 16:9
- 100% Editable
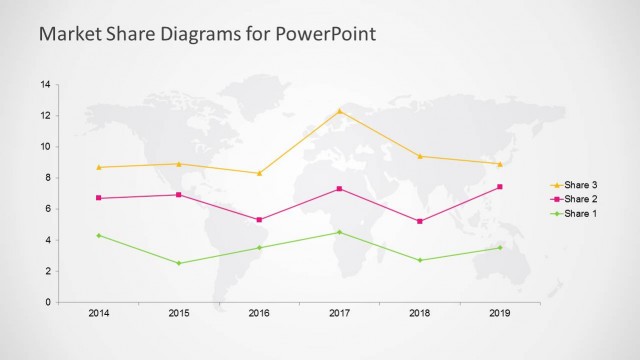
The Market Share Trend Analysis slide from the Global Market Share PowerPoint Template offers a clear visualization of market share fluctuations over time using editable slides with a line chart overlay. This layout is well-suited for corporate presentations focused on competitor performance and product trend evaluation, integrating vector icons and slide templates to enhance business presentation clarity.
What’s on This Slide
The layout features a world map as the background, with a line chart overlaying it. The chart displays four data series represented by different colored lines. Above the chart, three rectangular boxes are aligned horizontally, labeled 'Low,' 'Average,' and 'Top,' each containing a price value. The chart axes are labeled, with the vertical axis indicating market share values and the horizontal axis representing years from 2014 to 2019. Text placeholders exist for the chart title and axis labels, positioned at the top and bottom of the slide, respectively.
How to Use It
This layout serves to present market share trends over time, making it suitable for analysis in business presentations. It fits well at the conclusion of a market analysis sequence, summarizing key findings. Ideal scenarios include competitor comparisons, market research reports, and product performance evaluations. The visual structure supports clear communication of trends and insights, making it effective for strategy discussions and decision-making processes.
Text Placeholders & Capacity
Keep your copy within these limits so it fits without resizing. Chart title is tight, roughly 5 words each.
| Placeholder | Count | Max characters (approx.) |
|---|---|---|
| Chart title | 1 | 30 |
| Axis label | 2 | 20 |
| Data label | 4 | 10 |
Slide Keywords
Download unlimited PowerPoint templates, charts and graphics for your presentations with our annual plan.
DOWNLOADReturn to Global Market Share PowerPoint Template.