Venn Diagrams are widely used for business presentations to show the relationship between a collection of sets. Venn Diagrams can be made using PowerPoint shapes or SmartArt Graphics, however, they can appear confusing if the color combinations and display layout do not follow presentation best practices. You can save time and effort in making Professional Venn Diagrams for your presentations with the help of readymade Venn Diagram PPT Templates.
Whether you’re a student or a professional, you may have heard of Venn diagrams. Perhaps you’re required to demonstrate the logic in boolean expressions, describe the commonalities and differences between two communities, or want to show how your company is different from the competition; Venn diagrams can be a great tool to organize all of this data. These diagrams are a great tool to visually demonstrate the commonalities and differences between two or more entities.
In this article, we will discuss what Venn diagrams are? their history, their purpose, and where they are used.
Table of Contents:
- What is a Venn Diagram?
- A Brief History of Venn Diagrams
- Quick Guide to Venn Diagrams
- What are Venn Diagrams Used for?
- PowerPoint Venn Diagram Template Examples
- Interactive Venn Diagrams: Engaging Your Audience in Presentations
- The Future of Venn Diagrams in a Data-Driven World
- F.A.Q. Section — Venn diagrams explained
- Final Words
What is a Venn Diagram?
A Venn Diagram is an illustration representing sets and the relationship between them. Venn diagrams consist of circles, each representing a set. Everything inside a particular circle is considered an element of the set, while everything that is outside is not considered an element of the set. If there are elements that belong to two or more sets, the circles are overlapped such that the elements become part of two or more entities.
Venn diagrams are part of Euler diagrams and are used in mathematics to demonstrate the set theory. Moreover, these diagrams are used to illustrate relationships between sets in logic, probability, statistics, computer science, and linguistics.
Other Names For Venn Diagrams may include primary diagrams, logic diagrams, or set diagrams.
A Brief History of Venn Diagrams
The pioneer of Venn diagrams was John Venn, who made these diagrams popular in 1880. John Venn published a titled On the Diagrammatic and Mechanical Representation of Propositions and Reasoning in the Journal of Science and the Philosophical Magazine. The diagrams introduced by Venn gave various ways to illustrate propositions by diagrams.
According to Mark Wetson and Frank Ruskey, these diagrams had been used in formal logic much before Venn. However, they are correctly associated with him as he had comprehensively studied these diagrams, formalized them, and generalized their usage.
At first, Venn did not call his diagrams Venn Diagrams but rather referred to them as Eulerian Circles. However, Lewis Carroll included Venn’s Method of Diagrams and Euler’s Method of Diagrams in the appendix of his book titled Symbolic Logic in 1896. Moreover, in his book entitled A Survey of Symbolic Logic in 1918, Clarence Irving Lewis used the term Venn Diagram.
Leonhard Euler developed Euler Diagrams in the 18th century; Venn diagrams are quite similar to Euler Diagrams. Moreover, M.E. Baron stated that Leibniz, in the 17th century, made similar diagrams to Euler diagrams. However, much of the work remained unpublished. She also noted that early Euler-like diagrams had been around since the 13th century by Ramon Lull.
Quick Guide to Venn Diagrams
We will analyze how Venn diagrams are used in real-life scenarios.
Let’s think of 2 items that most people have in their homes or offices: Smartphones and Laptops. Both devices do some similar tasks and also show some significant differences. We can explain how they share features as much as how they can be different —taking this into account:
- Circle A: Smartphone: small form factor, allows phone connectivity, includes a high-definition camera
- Circle B: Laptop: large form factor, requires Wi-Fi access, includes a keyboard
To understand the intersection of both, we will add the features they both share, including the internet browser, games, work, and video calls.

We now understand both devices are different, as they do additional things, but they also have in common a set of features that allow for cross-usage.
When creating a Venn Diagram, generally, we think about 2 circles side by side, but we might realize that 2 circles will come off short, and we need more when defining the information that will go into them. Therefore, many interesting variations of Venn Diagrams have been created to portray different element sets, and you can include as many circles and information as needed.
You can check our Venn Diagram PPT Templates and select a ready made Venn Diagram design for your presentation
What are Venn Diagrams Used for?
Venn diagrams are used for various purposes. They show the relationship between multiple sets of entities and organize the data visually. You can add all kinds of different Venn Diagrams either with SmartArt from PowerPoint or any of the SlideModel templates in presentations. Even during a meeting or a work session, you can actively workshop with your team information to be included in a presentation that will later be given to a client to confer relevant ideas. Due to the flexibility of Venn diagrams, they can be added with few explanations when explaining 2 or more sets of information.
Venn Diagrams in Education
Students, as well as professionals, may use these diagrams to show the logic governing a concept as well as to aid visual communication. They may be able to demonstrate the similarities and differences between the two concepts in a visual manner.
With Venn diagrams, you may be able to show the commonalities and differences between two or more entities in business or marketing. This may be used for selecting a service or product for purchase. They will also come in handy while teaching regular subjects: Mathematics, logic, probability, and statistics.
Venn Diagrams in Math
If you’re a mathematician or a student studying mathematics, you can use these diagrams to solve complex problems, visualize the prediction of probabilities, and correlations, and compare data sets. These diagrams may also be used to give reasons for the logic in statements, such as in Boolean logic.
Venn Diagrams in Computer Science
This type of diagram is great for showing the overlaps between sets of data in Computer Science.
Venn Diagrams in Business.
We want to share with you another day-to-day example, but this time we want to frame out a prevalent set of terms used in marketing, sales, or an investor pitch. You might have heard about TAM, SAM, and SOM, but in case you haven’t, we will add a brief explanation alongside how we can create this model with Venn Diagrams.
When working to roll out any commercial plan, it’s crucial to understand the market size. TAM, Total Addressable market, means the whole universe of people who can be potential buyers; this is to be represented as a large outer circle. Afterward, we need to define the SAM, Service Addressable Market, or the market to reach realistically with the current business model in a second internal circle. Finally, we will build a smaller circle inside the SAM to represent the SOM, or Serviceable Obtainable Market, a faithful portion of the market to be reached with available resources.

Check our market segmentation ppt article for more information about Market Segmentation Presentations.
PowerPoint Venn Diagram Template Examples
Since we’ve added some examples of how you can use Venn Diagrams in presentations, we want to share how you can create PowerPoint presentations with a varied array of premade designs and formats, including an editable Venn Diagram template, available at our gallery.
1. Grunge Venn Diagram For PowerPoint
The Grunge Venn Diagram PowerPoint Template is a professionally designed template that provides highly customizable sample slides for making Venn Diagrams.

The overlapping circles in this template come with different color combinations and a clean layout; which can be customized right down to the very basic objects in the given sample slides.

This template is available in both Standard and Widescreen formats.
2. Grunge Concentric Circles For PowerPoint
Another Grunge-based template for PowerPoint that can be quite handy in quickly constructing Venn Diagrams is the Grunge Concentric Circles PowerPoint Template. This template comes with textured objects and different shapes for making different types of Venn Diagrams.
In this example, we are using the Golden Circle created by Simon Sinek, which seeks to explain the purpose (Why), method (How), and solution (What).

The diversity in shapes can be useful in constructing diagrams for representing a diverse range of processes and can also be helpful in differentiating one type of process from another (during a PowerPoint presentation).

3. Ecosystem Diagram PowerPoint Template
This is another fine template for making Venn Diagrams. It provides 6 awesome slide designs in the form of circular diagrams.

While this template has been designed mainly for biology or eco-system-related presentations, however, you can also use this template to create Venn Diagrams related to business or production processes, a community, a network of objects or people, etc.

To see an example of sample slides and to download this template, check out the link given below.
Go to Download Ecosystem Diagram PowerPoint Template
4. Gradient Venn Diagram for PowerPoint
The gradient Venn diagram is an aesthetically pleasing template that allows you to create a comparison or connection between 2 main ideas, including the intersection of both and the universe of surrounding concepts.

Go to Download Gradient Venn Diagram Template and try this modern Venn Diagram Template.
5. Multi-Layer Diagram Concept for PowerPoint
When seeking to create a Venn diagram that shows multiple levels and several processes, this is a great option. This template allows you to build upon different levels of information, including an infographic format that explains further in a more visually pleasing design.

The multi-layer diagram uses modern gradient colors and fine details in the shapes. Ideal for modern executive audiences.
Go to Download Multi-Layer Diagram Concept Template and check the additional slides provided.
6. Hexagon Venn Diagram PowerPoint Template
A Venn Diagram can become increasingly complex and become an infographic and the set up of the information; this is why a template like the 5 Hexagon Venn Diagram for PowerPoint is an excellent choice if you need to present a large number of interactions.

Providing dark and white contrast backgrounds the hexagonal Venn diagram can be used in infographic designs or traditional business presentations.
Go to Download 5 Hexagon Venn Diagram PowerPoint Template and experiment with this modern design.
7. Venn Diagram Material Design for PowerPoint
After the 2-circle Venn Diagram, the 3-circle version is almost as popular, therefore to be able to build not only an intriguing but clear presentation is mandatory when working with 3 elements. The Venn Diagram Material Design PowerPoint Diagram will be helpful when it’s necessary to create a graphic that not only allows more information, a basic one but also needs to be eye-catching and practical.

This diagram provides vertexes over the circle vector that help the presenter add additional data points over the set information.
Go to Venn Diagram Material Design for PowerPoint to check the different layouts provided.
Interactive Venn Diagrams: Engaging Your Audience in Presentations
In today’s world of dynamic presentations, engagement is key to getting your message across effectively. Venn diagrams, traditionally static visual aids, can be transformed into interactive tools to captivate your audience. Here’s how to make your Venn diagrams interactive and take your presentations to the next level.
- Clickable Elements: Instead of static circles use clickable elements within your Venn diagram. This can be achieved through hyperlinks or interactive objects in your presentation software. When clicked, these elements can reveal additional information or take the audience to a different part of your presentation.
- Animated Transitions: Animate the transitions between different sections of your Venn diagram to create a sense of movement and flow. This can make your presentation more dynamic and engaging.
- Drag-and-Drop Functionality: Introduce drag-and-drop features to allow the audience to move elements within the Venn diagram. This can be a useful tool for educational presentations, problem-solving scenarios, or group discussions.
- Pop-up Descriptions: When a user hovers their cursor over a specific part of the Venn diagram, a pop-up description can appear, providing additional details, context, or insights. This interactive feature keeps the audience engaged and informed.
- User-Generated Content: Encourage audience participation by allowing them to contribute to the Venn diagram. This can be particularly effective in brainstorming sessions, surveys, or collaborative decision-making.
- Quizzes and Polls: Incorporate interactive quizzes or polls within your Venn diagrams. This not only engages the audience but also provides valuable feedback and insights.
- Navigation Buttons: Include navigation buttons that allow the audience to explore the Venn diagram at their own pace. This empowers viewers to focus on areas of interest and navigate through the content as they see fit.
By making your Venn diagrams interactive, you transform them into engaging, educational, and participatory tools that can enhance your presentations and leave a lasting impact on your audience.
The Future of Venn Diagrams in a Data-Driven World
As we move further into the 21st century, the role of Venn diagrams in our data-driven world is evolving. These timeless visual aids are adapting to meet the demands of an increasingly complex and data-rich environment. Here’s a glimpse into the future of Venn diagrams:
Big Data Visualization
Venn diagrams are taking on a pivotal role in visualizing big data. In various fields such as business, science, and technology, the volume of data has exploded. Venn diagrams are becoming essential for simplifying complex data relationships and patterns. They help distill vast datasets into manageable and comprehensible insights. In business, for instance, they can represent market segmentation, customer preferences, and the overlap between different target audiences. In scientific research, Venn diagrams can be used to identify commonalities and differences in large datasets, facilitating data-driven discoveries.
Artificial Intelligence Integration
Venn diagrams are harnessing the power of artificial intelligence (AI). AI-powered tools are beginning to enhance the capabilities of Venn diagrams. These tools can automatically identify overlaps, correlations, and patterns within data. This automation makes the diagram creation process more efficient and insightful. For instance, in data analysis, AI can analyze large datasets and generate Venn diagrams that highlight significant intersections, enabling faster decision-making and uncovering hidden relationships within the data.
Real-Time Data Representation
Venn diagrams are adapting to the need for real-time data representation. They are becoming valuable tools for monitoring and decision-making. Businesses and organizations are using them to track market trends, customer behavior, and more. With real-time data integration, Venn diagrams enable decision-makers to respond promptly to changing situations. For example, in e-commerce, Venn diagrams can illustrate the dynamic relationship between customer preferences and inventory levels, helping businesses optimize their supply chain and stock management in real-time.
Cross-Platform Accessibility
Venn diagrams are becoming more versatile and accessible across different platforms and devices. They are no longer confined to static presentations. Mobile apps and web applications are adopting Venn diagrams for data analysis, collaboration, and decision support. This accessibility ensures that data-driven insights can be shared and accessed conveniently across teams and devices, making collaboration more efficient and informed.
Customization and Personalization
Users are gaining more control over the design and functionality of Venn diagrams. They can tailor these visuals to their specific needs. This personalization is catering to a wide range of industries and applications. Users can customize the appearance of Venn diagrams to match their brand identity or specific requirements. For instance, in educational settings, educators can adapt Venn diagrams to suit their teaching style and the complexity of the subject matter. This customization empowers users to create diagrams that are highly relevant to their unique contexts.
FAQs — Venn diagrams explained
Can I create a Venn diagram with more than two circles?
Traditionally, Venn diagrams have 2 circles intersecting; however, depending on the amount of information that needs to be shown, we can add more circles. If you are looking to display many circles more than 4 or 5 to increment the data, it might be a good idea to rethink the type of diagram and perhaps include 3D shapes.
Alternatively, discover our guide on how to make a Venn Diagram in PowerPoint.
How to use a Venn diagram in the classroom?
Venn diagrams are great for teaching science, social studies, biology, or even math, as they are flexible and can be built on the go. When teachers want to show what makes several concepts similar or different, this type of diagram will support a clear and visual explanation that will suit all learners of all sorts. If the subject is too detailed, perhaps a Venn Diagram is not the ideal tool, as this works better with precise information.
What are the advantages of Venn Diagram Templates?
First of all, Venn Diagrams are very visual, which will help the relationship between elements become easier to understand. Second, this type of diagram’s elegant simplicity allows fewer words to explain complex information. Finally, the combination of the above will help retention overall through the association of colors and shapes.
What is the middle of the Venn Diagram called?
The middle section of the Venn Diagram is called an intersection. This area is where concepts intersect, it´s used to add the shared information between 2 ideas. What are Venn diagrams used for? Venn diagrams are excellent for visually organizing information due to their graphic nature, comparing or contrasting 2 or more choices, understanding or solving math problems, comparing information sets for computer science, teaching, or even using Boolean logic.
Final Words
Explaining almost any complex information gets easier when including compelling graphic elements. Venn Diagrams have been around for centuries and have been used for nearly every industry in dozens of contexts. Nevertheless, the popularity of these diagrams continues to grow, especially today, where we see more data than ever.
Something is true, different visual formats will only grow in variability shortly, and with the shift to remote work, virtual communications require the synthesis of ideas faster in another way of presenting. The beauty of well-built models like Venn Diagrams surpasses the tests of technology and innovation, bringing to the table flexibility and pragmatism, not just today but probably for decades to come.
1. 4-Step Petal Venn Diagram PowerPoint Template
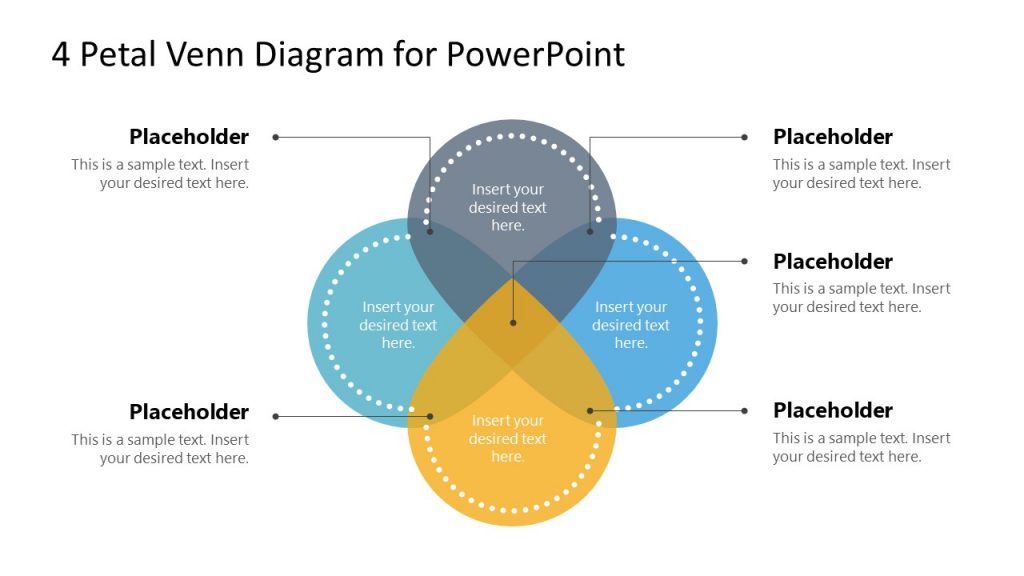
Venn diagrams can have more than 2 circles, they can even include different shapes or be similar to organic or non organic shapes. In this case, the 4 Step Petal can be useful to explain 4 sets of information in a visually appealing format.
2. 4 Hexagon Venn Diagram PowerPoint Template
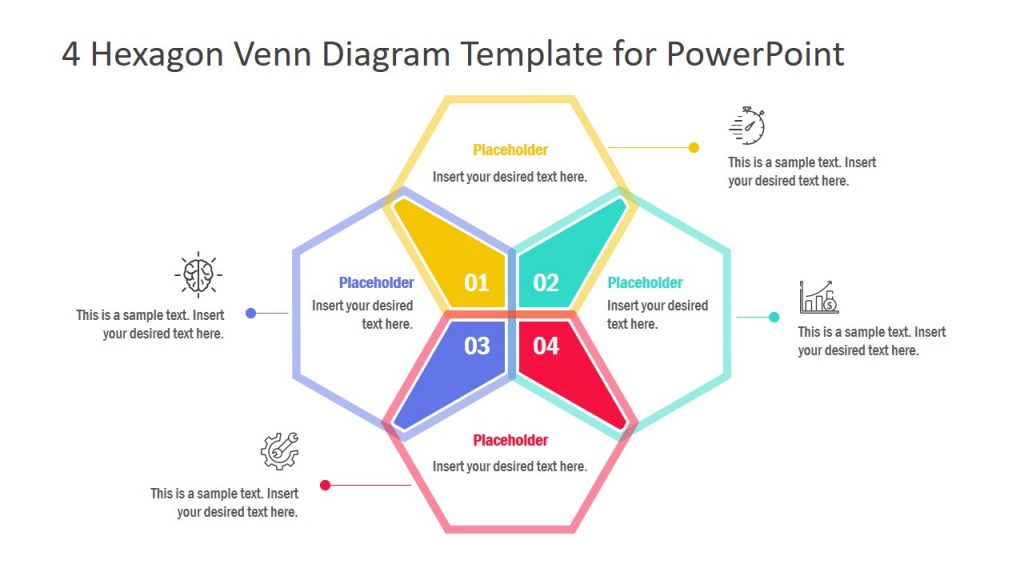
Working with 4 relevant sets of information might require a Venn Diagram to support the analysis of a presentation. This template provides a creative format to present data that is interconnected.
3. Simple Flat Venn Diagram PowerPoint Template
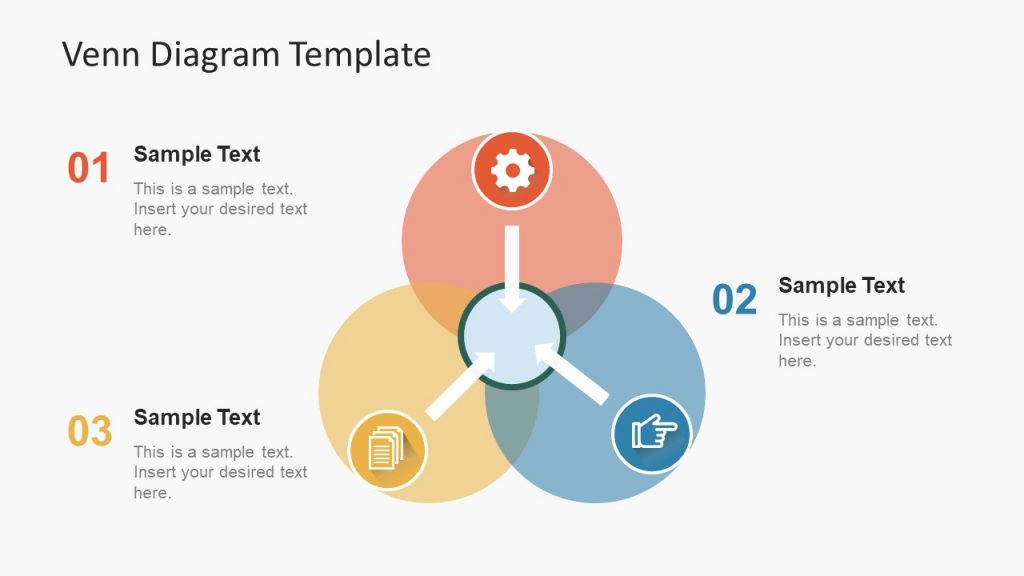
If you are working on a Venn Diagram and you have 3 sets of very relevant information, this template can help you present your data in a functional, yet aesthetic way.
4. 4 Circle Venn Diagram PowerPoint Template
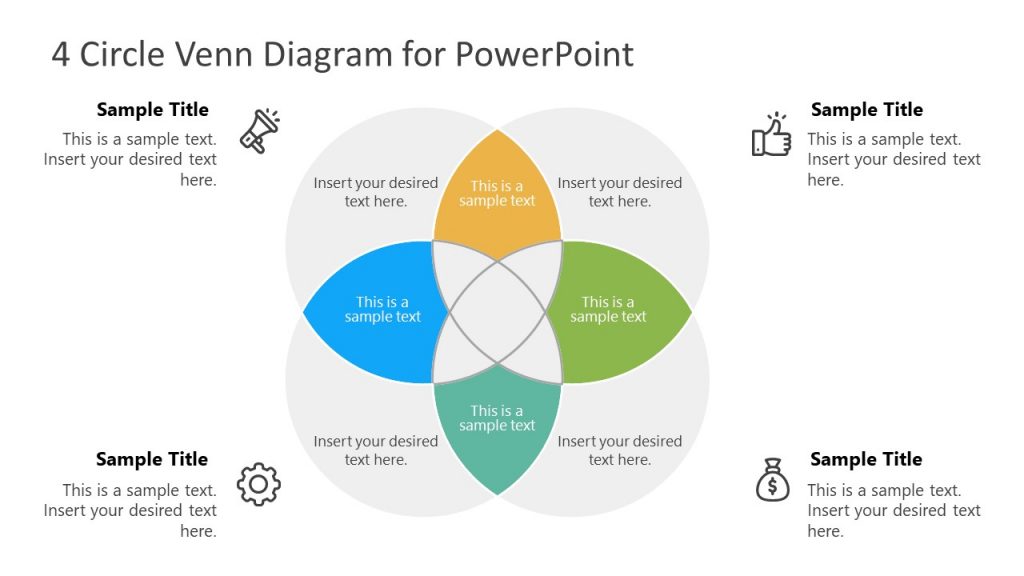
This is a 4 circle Venn diagram design that you can use to represent four overlapping ideas in a PowerPoint presentation.
5. Modern Venn Diagram Infographics
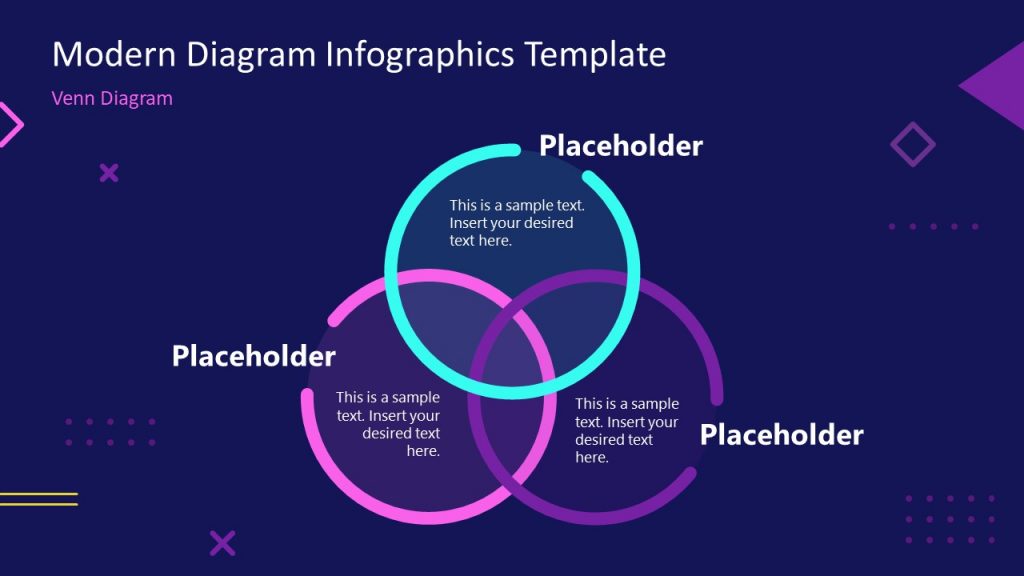
This slide bundle contains 14 slides with modern diagram infographics and includes a Venn diagram design.