Venn Diagrams are created to depict logical or mathematical sets visually. Named after the English Logician during the 1880s, Venn diagrams are widely used to show relationships, such as commonalities and differences between sets. In a previous article, we covered Venn Diagram ideas for PowerPoint presentations, and now, we’ll also guide you on how to create a Venn diagram in PowerPoint.
Table of Contents
- Why Should I Use Venn Diagrams in PowerPoint?
- Making a Venn Diagram in PowerPoint
- Things to Consider When Making a Venn Diagram in PowerPoint
- Final Words
Why Should I Use Venn Diagrams?
Clarity and Simplicity
Venn diagrams excel at simplifying complex information. When you have data with multiple sets or categories, conveying the relationships and overlaps effectively through text alone can be challenging. Venn diagrams visually represent these relationships with circles and intersections, clearly and concisely communicating complex ideas.
This clarity ensures that your audience comprehends the information quickly and accurately. In a PowerPoint presentation, where attention spans can be limited, using Venn diagrams helps ensure that your message is not lost in the complexity of the data.
Enhanced Engagement
PowerPoint presentations can sometimes suffer from being text-heavy and visually monotonous. Integrating Venn diagrams into your slides introduces visual interest and variety. The unique structure of Venn diagrams naturally draws the audience’s attention to the areas of overlap and distinction between the sets.
This enhanced engagement is especially valuable when highlighting key concepts, comparisons, or relationships in your presentation. Visual elements like Venn diagrams break up the monotony and make your content more engaging and memorable.
Effective Data Comparison
Venn diagrams are particularly effective when you need to compare data sets. Whether you’re illustrating the similarities and differences in market segments, customer preferences, or the features of various products, Venn diagrams offer a straightforward way to showcase this information.
By visually highlighting the shared and unique elements of different sets, you make it easier for your audience to grasp key insights. This ability to convey data in a comparative and intuitive manner is especially beneficial for data-driven or analytical presentations.
Versatility
Venn diagrams are versatile tools that can be adapted to various subject matters and fields. They are not limited to one specific type of data or concept. You can use them for a wide range of topics, from illustrating mathematical relationships in set theory to comparing elements in business models, scientific concepts, or even storytelling.
The adaptability of Venn diagrams makes them a valuable addition to your presentation arsenal, regardless of your industry or area of expertise.
Professional Appearance
Including well-designed Venn diagrams in your PowerPoint presentation conveys professionalism and attention to detail. It demonstrates that you’ve taken the time to present your information in a visually appealing and organized manner. The polished look and feel of Venn diagrams can enhance your credibility as a presenter.
In a business or academic setting, professionalism can make a significant difference in how your audience perceives your content. Using Venn diagrams in your presentations not only makes the Venn diagram PPT information more accessible but also elevates the overall quality and impact of your slides.
Incorporating Venn diagrams into your PowerPoint presentations is a practical choice, as it simplifies complex data, enhances engagement, aids in data comparison, offers versatility, and adds a professional touch to your slides. These benefits can help you effectively communicate your message and leave a lasting impression on your audience.
Making a Venn Diagram in PowerPoint
Below are three simple methods that show how to make a Venn diagram in PowerPoint.
1. Create a Venn Diagram in PowerPoint using SmartArt
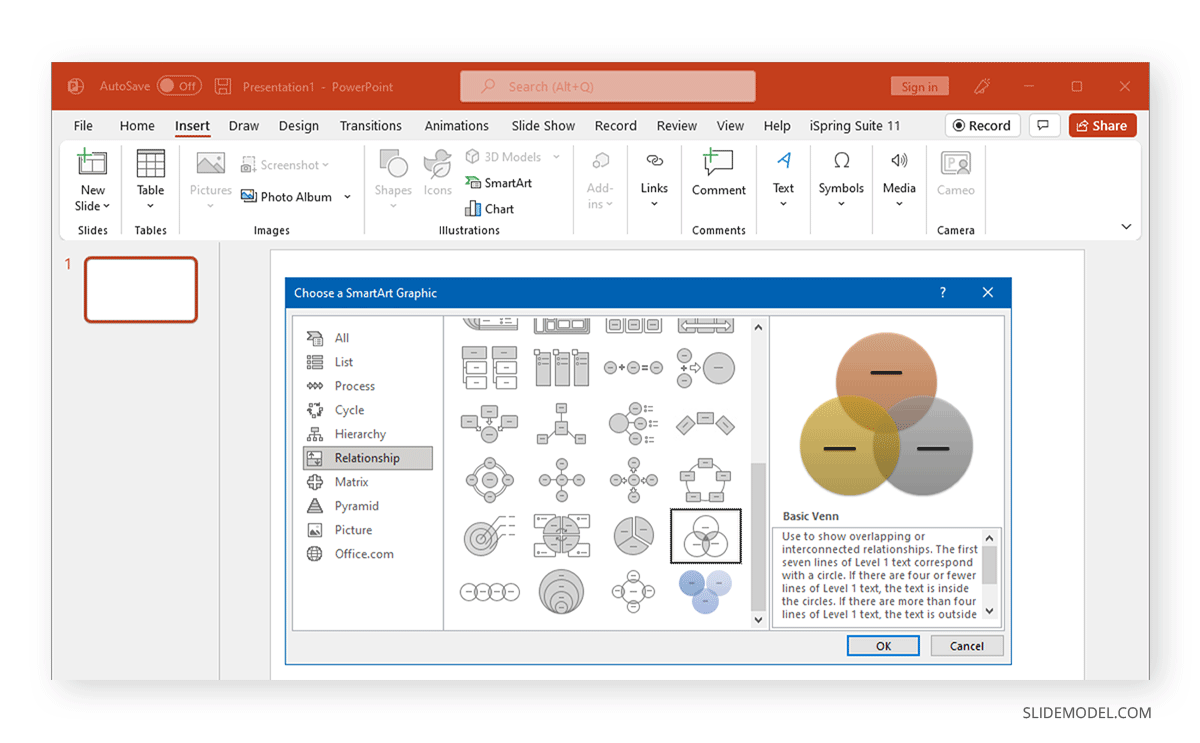
SmartArt Graphics in PowerPoint provides a variety of layouts for making visualizations by customizing the given graphics. You can also create Venn diagrams via Insert > SmartArt > Relationship among the available options.
The available SmartArt Graphics that can be used for a standard Venn diagram include Interconnected Rings, Basic Venn, Radial Venn, and Linear Venn. As the names imply, these diagrams represent your visualization’s linear, stacked, and circular connectivity.
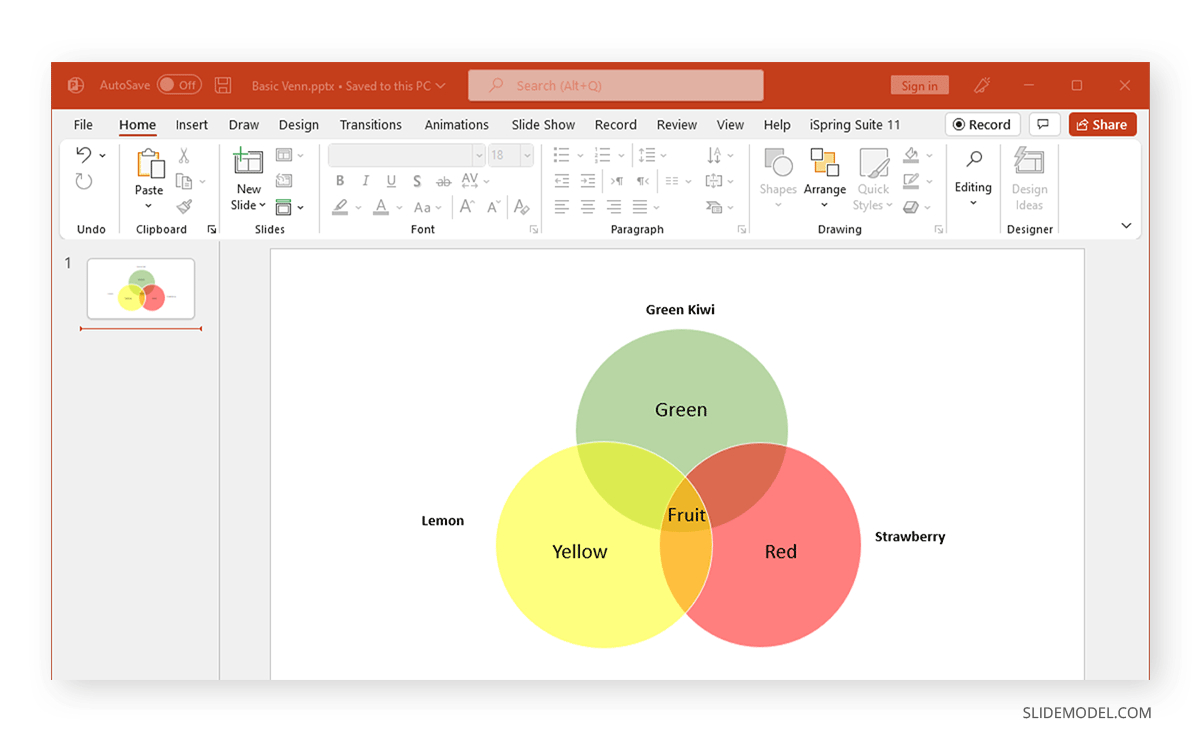
You can add text to the layouts to create a diagram representing the sets you intend to present.
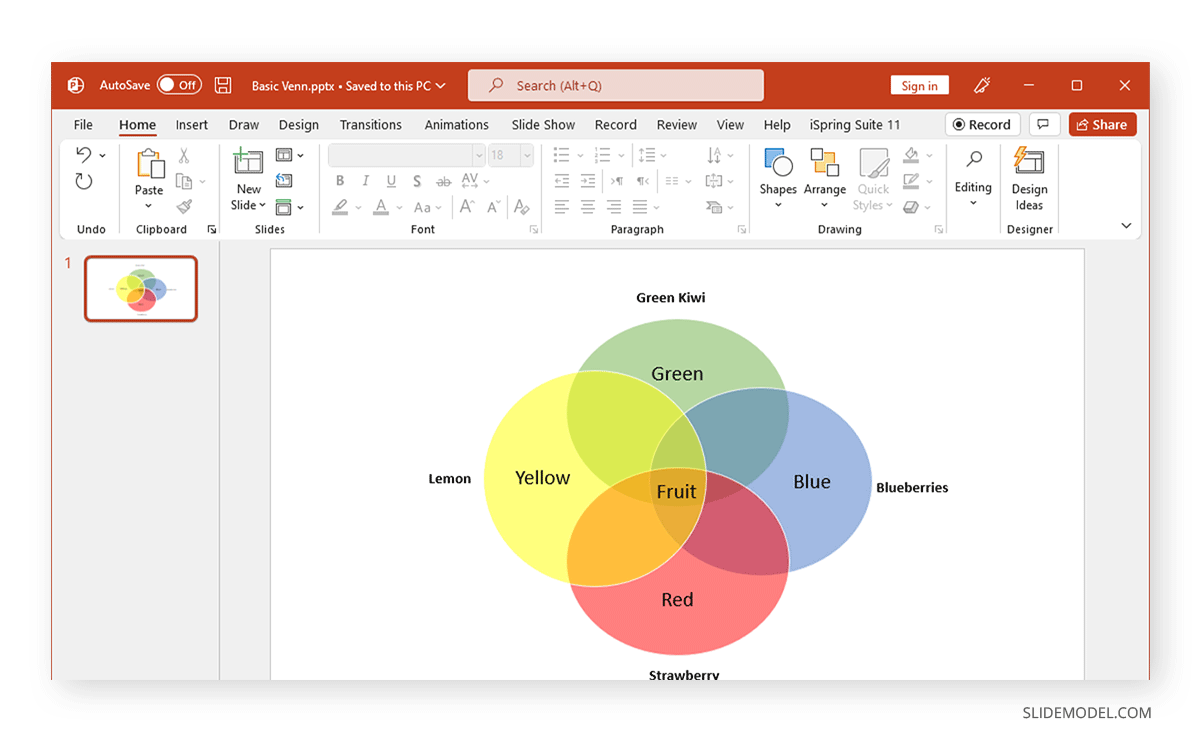
To make your Venn diagram more elaborate, copy and paste the circles within the SmartArt layout. The Venn diagram can be customized via SmartArt Design and Format options from the Ribbon menu to change the illustration’s color, size, and other aspects.
2. Create a Venn Diagram in PowerPoint using PowerPoint Shapes
To create a Venn diagram in PowerPoint using Shapes, go to Insert > Shapes and select a circular shape such as an oval.
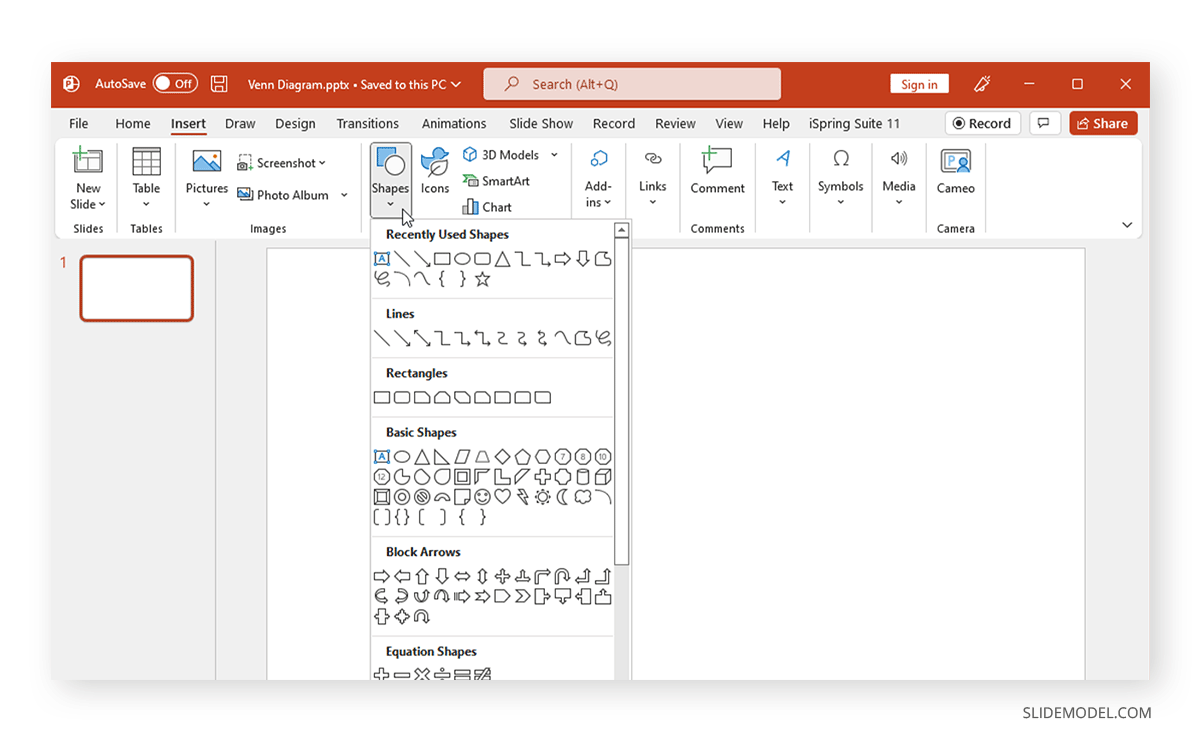
Customize the shape size and colors according to need. You can use the Shape Format to adjust the colors, transparency, size, etc.
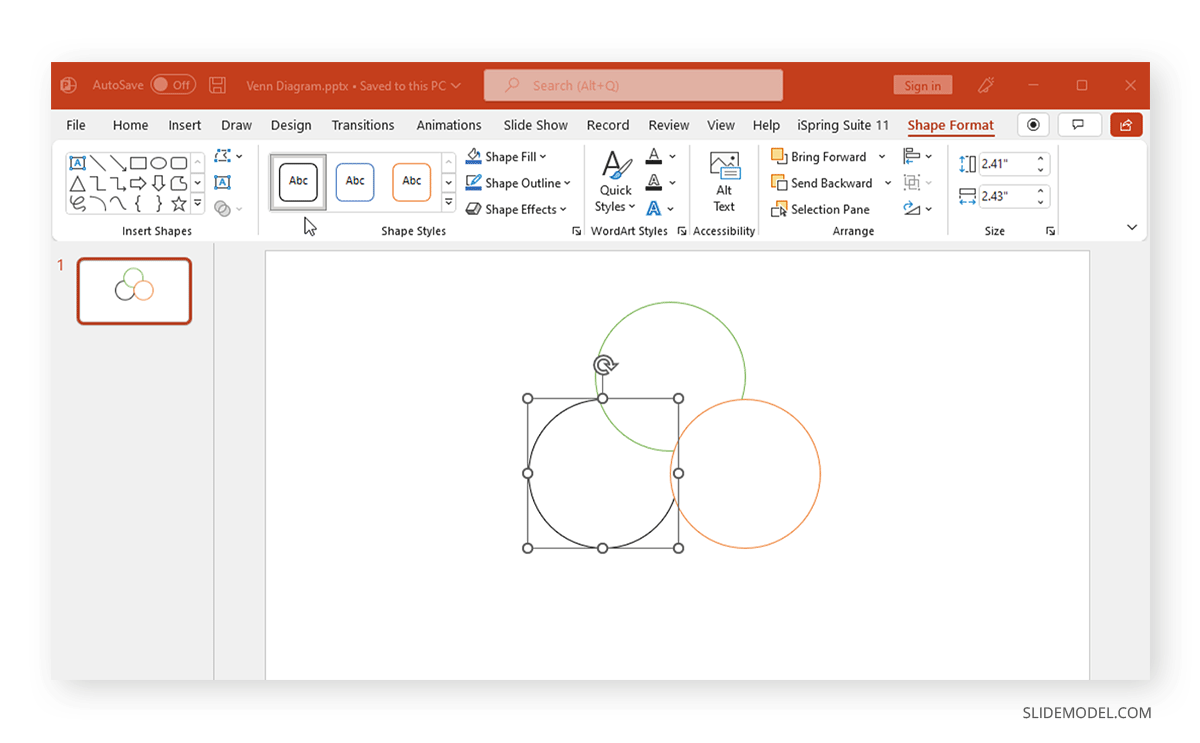
Add text via Insert > Text > Text Box to the added shapes.

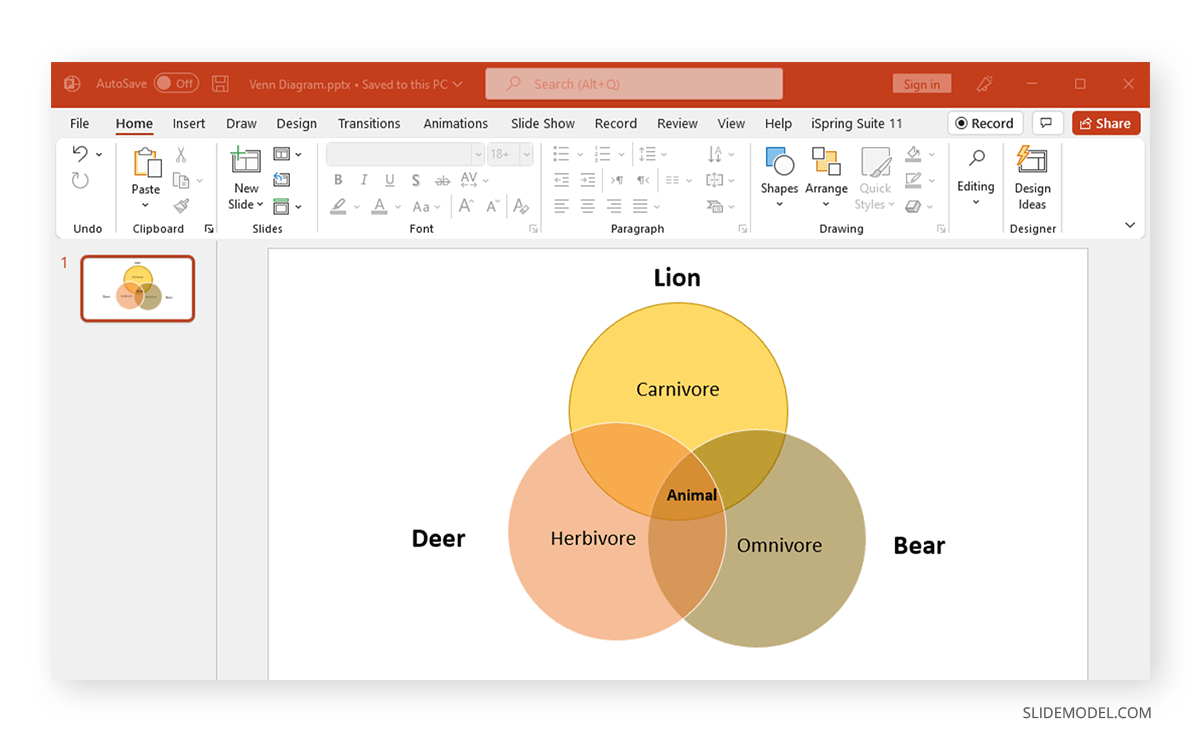
Below is an example of a Venn diagram created using PowerPoint Shapes.
3. Using SlideModel’s Venn Diagram PowerPoint Templates
You can create simple to complex Venn diagrams using SmartArt Graphics and Shapes in PowerPoint. However, using readymade presentation templates can enable you to save time in designing your presentation slides and add visual appeal to your slide deck.
How to create a venn diagram in PowerPoint from existing templates? If you are someone who does not like to spend several hours designing PowerPoint slides, SlideModel provides a wide range of Venn Diagram PowerPoint Templates that can be customized to match your needs.
Things to Consider When Creating Venn Diagrams in PowerPoint
Constructing a Venn model might seem like a simple task. The diagram can face various issues if the sections aren’t carefully constructed. Let’s take a look at a few things you should consider when visualizing sets in the form of Venn diagrams.
1. Decide What to Compare
Before you begin constructing your Venn diagram, it might be best to pause and consider what you intend to create. A design made in haste without considering complex relationships isn’t the best approach. Before beginning the visualization process, you can also brainstorm with your team or write down the sequence and relationships.
2. Make Sure the Relationships are Accurately Depicted
A broken chain or inaccurate depiction of relationships can be one of many issues that can make your diagram redundant. A careful review of the illustration during and after completing your model can be one way of ensuring that the Venn design is accurately constructed. To get ideas, also consider looking at sample designs or using readymade PowerPoint templates to make your job easy.
3. Use Diagram Titles Correctly
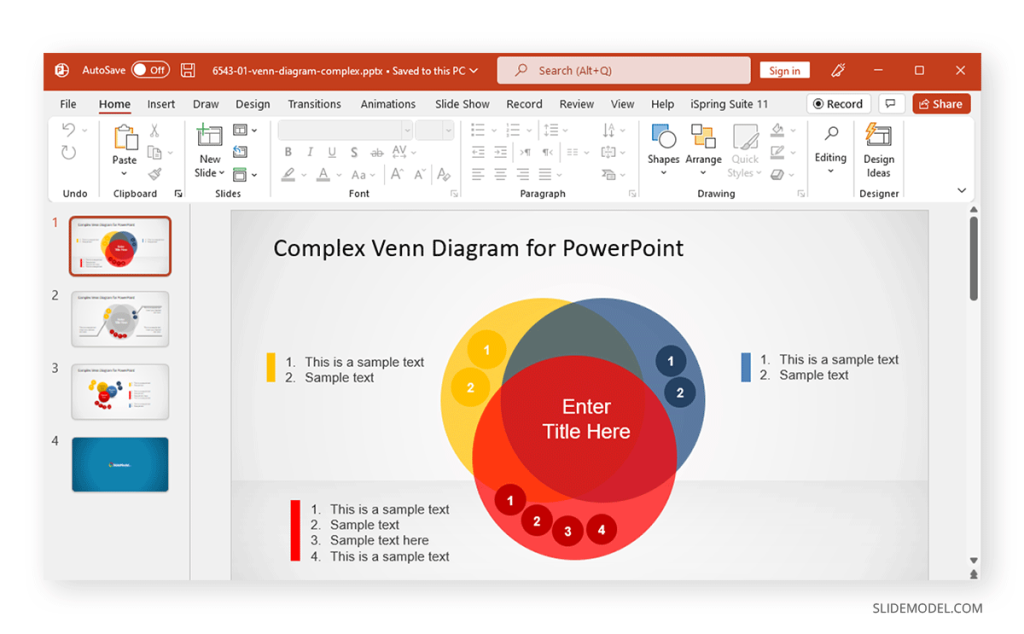
You should place a title at the top of the diagram to describe it and use labels that can accurately define the relationships in your illustration. Using too many bits of text within the illustration can be confusing; therefore, you can also draw lines and incorporate elements to help accommodate text to help better explain sets. Such as in the case of the complex Venn diagram templates given above.
4. Be Mindful of the Middle of the Diagram
The intersection of a Venn diagram appears where two or more sections overlap. This is the place where you need to define the relationship between sets. Not being mindful of the intersection can result in an inaccurate depiction of sets. At the end of the day, it might be the most important part of your illustration.
FAQs
Why should I use Venn Diagrams in PowerPoint presentations?
Venn diagrams simplify complex data, enhance audience engagement, effectively compare data, offer versatility across topics, and give your presentation a professional look, making it easier for your audience to comprehend key insights.
How do I create a Venn Diagram using SmartArt in PowerPoint?
Go to Insert > SmartArt > Relationship and select a Venn diagram style such as Basic Venn, Radial Venn, or Linear Venn. You can then add text and customize the diagram’s color, size, and other aspects through the SmartArt Design tab.
Can I create a Venn Diagram using PowerPoint shapes?
Yes. You can manually create a Venn diagram by inserting circles via Insert > Shapes > Oval. Customize the shape size, colors, and transparency using the Shape Format tab, and add text using Insert > Text Box.
What should I consider when creating a Venn diagram in PowerPoint?
Be clear about what you’re comparing, ensure relationships are accurately depicted, use proper titles and labels, and focus on the intersection of the diagram to avoid misrepresentation of the data.
How can I make sure the relationships in my Venn Diagram are correctly represented?
Review your diagram during and after its creation to ensure the sets and intersections accurately depict the relationships you want to visualize. You can also use PowerPoint templates as a guide to avoid mistakes.
How do I customize the colors and appearance of my Venn Diagram in PowerPoint?
Use the SmartArt Design or Shape Format tabs to change colors, adjust transparency, resize the diagram, and add effects to customize the appearance according to your presentation’s theme.
Where should I place the most important information in a Venn Diagram?
The most important information often lies in the intersections of the diagram, where two or more sets overlap. This is where the relationships between the sets are most clearly represented.
Final Words
Venn diagrams have many uses, from depicting the Set Theory in mathematics to making business models and market segments, depicting relationships to explain scientific concepts, explaining linguistics, etc. Venn diagrams can help make complex concepts easier to explain and grasp without constructing illustrations that might appear confusing and difficult to follow visually. However, when constructing your Venn diagram, you should not get carried away by its mere simplicity. This can have pitfalls that can result in making models that can break the chain of logical relationships you intend to visualize.
A simple method for making your Venn diagrams appear properly formatted is to use PowerPoint templates as a guide to ensure that your sets are cohesive and properly represented. Designs made using ready-made templates can also enable you to share them offline or online, using several PowerPoint-supported formats or by saving them as an image file. Alternatively, if you are a Google Slides user looking for this solution, please refer to our article on how to make a Venn Diagram in Google Slides.