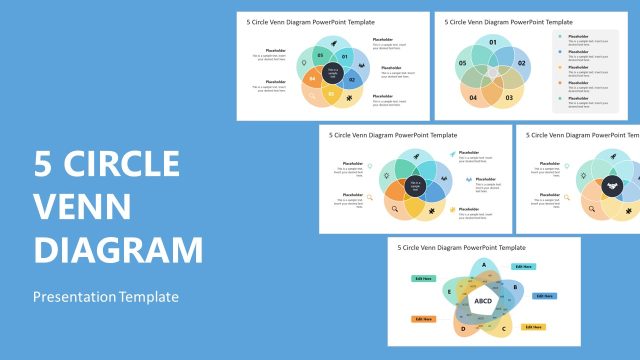
Simple Flat Venn Diagram PowerPoint Template
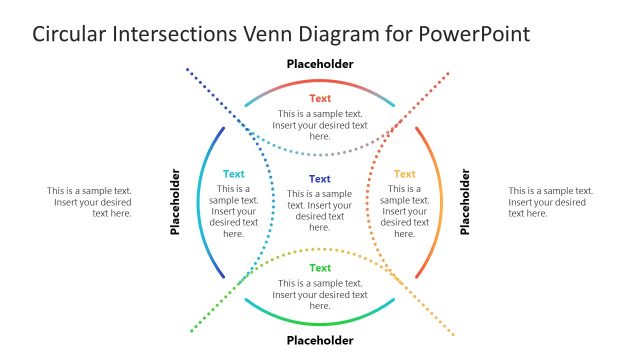
Simple Flat Venn Diagram PowerPoint Template – A useful presentation to show correlation between groups of data. It is a collection of unique design of slides to decorate a presentation. The PowerPoint visually displays the intersecting of circles as a pictorial representation of mathematical data. The Venn diagram is an exceptional tool to compare information and explain the similarities within the groups and sets. These are basically overlapping circles which show the logical relationship between two or more set of items. This mathematical concept is widely implement in mathematics, statistical analysis, logical reasoning, science, technology and business. Therefore, this PowerPoint is an instructive template for teachers to explain the mutually exclusive and inclusive elements. Also, the business professionals can display product analysis, customer segmentation and further concepts.
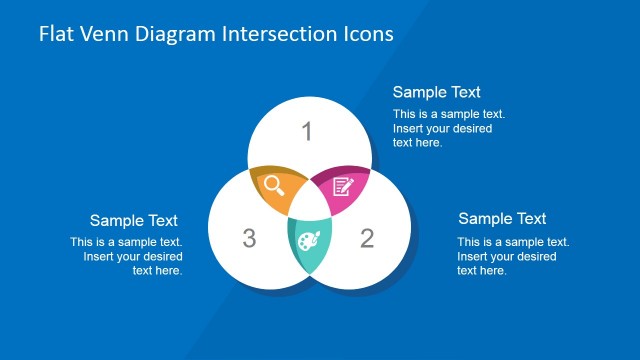
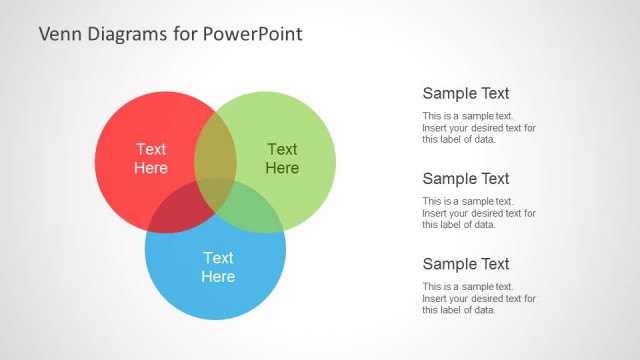
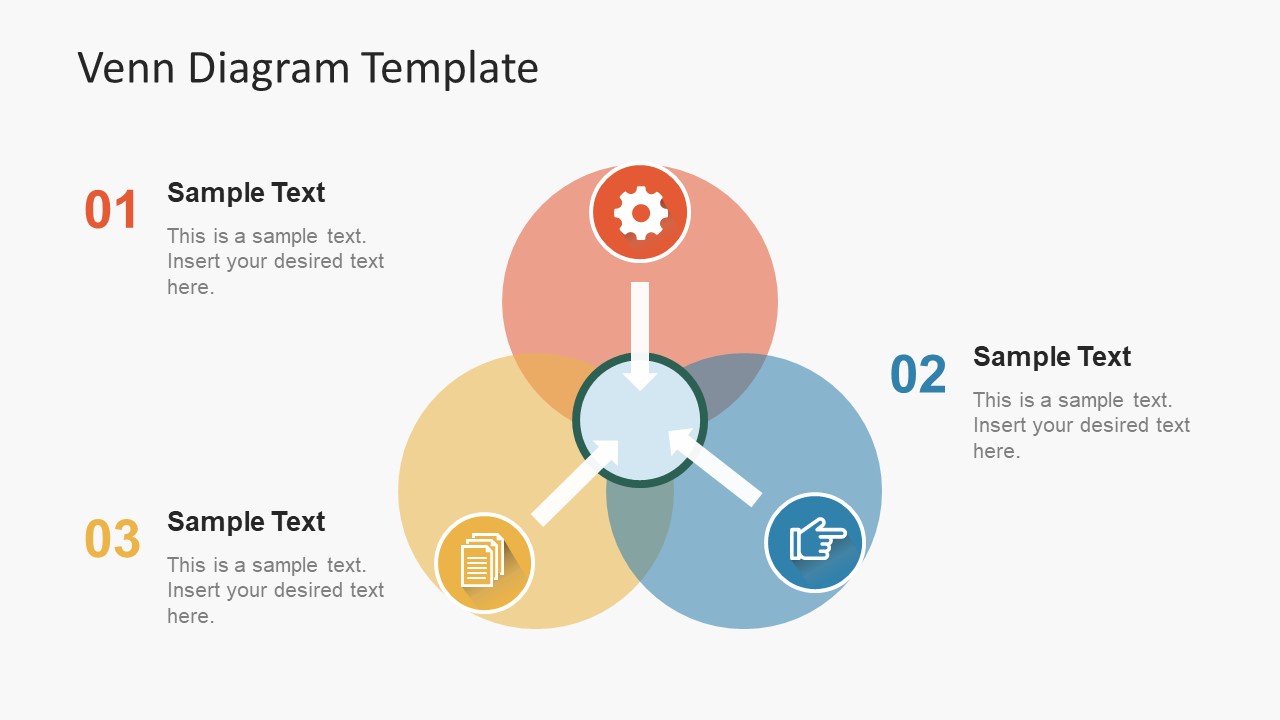
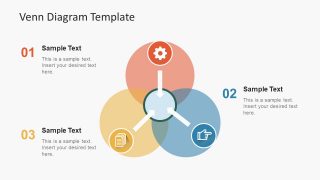
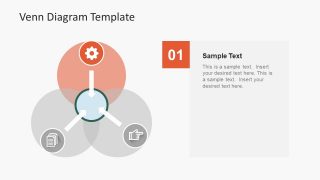
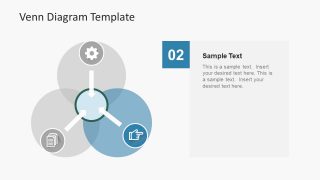
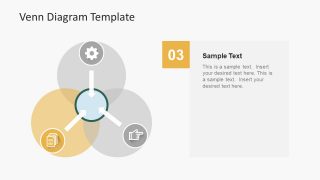
A Simple Flat Venn Diagram PowerPoint Template has several subsequent slides highlighting all three sections. The circles representing individual groups also contain icons. Such as, gear, documents and hand direction to differentiate each section. However, the circle in the middle shows the intersection of all three groups. The first slide contains small text placeholders to add title and captions numbered. Whereas, the next three slides have an image and text layout where the presenter can add the details for each set.
Check our article of how to use Venn Diagram Templates in your presentation to know more about this diagrams and their professional applications.
Venn Diagram template is an editable PowerPoint enabling users to modify features like colors and size. Also, add or subtract elements or copy it in another presentation as necessary. The users can change colors in shape fill option, or resize the items without affecting the image quality. Similarly, right click the image and select format shape. The toolbar which appears on the right helps customize transparency value or many other options. Additionally, add more objects like pictures, icons, SmartArt or charts in insert menu. This visually engaging Venn diagram PowerPoint is design to attract audience’s attention.


You must be logged in to download this file.
DOWNLOAD- Category
- Diagrams
- Rating


 Loading...
- Size
- 16x94x3
- Item ID
- 7539-01
- Colors
Subscribe today and get immediate
access to download our PowerPoint templates.