Venn Diagram templates for PowerPoint and Google Slides
Download creative & 100% editable Venn diagram templates for your presentations, compatible with major versions of Microsoft PowerPoint and Google Slides. Use the editable Venn Diagram templates to illustrate the relationships between and among sets or groups of objects that are sharing something in common (intersection of the circles or ovals).
Download Venn Diagram Templates for PowerPoint.
Create Venn Diagrams with the help of attractive diagram slides which are easy to customize using PowerPoint. With these templates you can easily craft professional Venn Diagrams using a variety of designs and even depict your models in various steps to better explain your diagrams to an audience. You may refer to Venn diagram ideas to find creative ways to use Venn Diagrams in your presentations.
Featured Templates
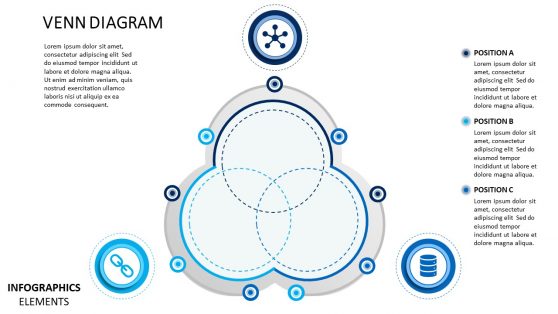
Venn Diagram Material Design for PowerPoint
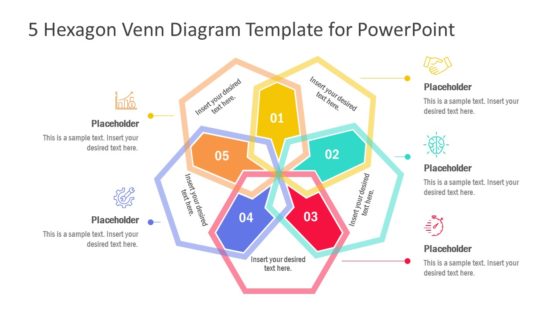
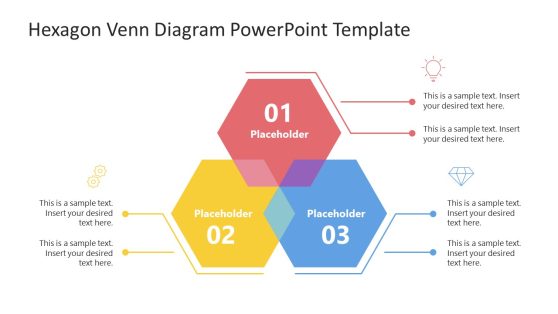
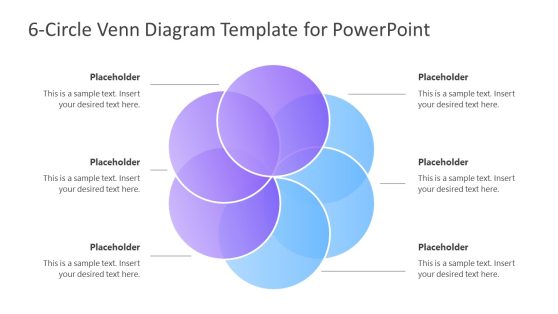
5 Hexagon Venn Diagram PowerPoint Template
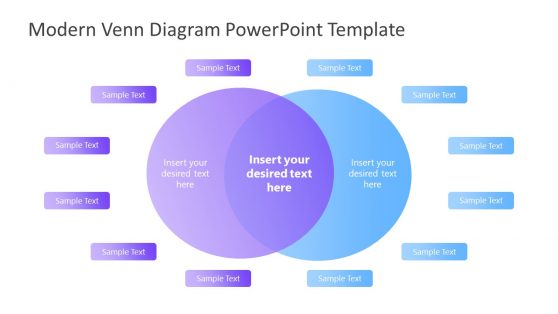
Gradient Venn Diagram for PowerPoint
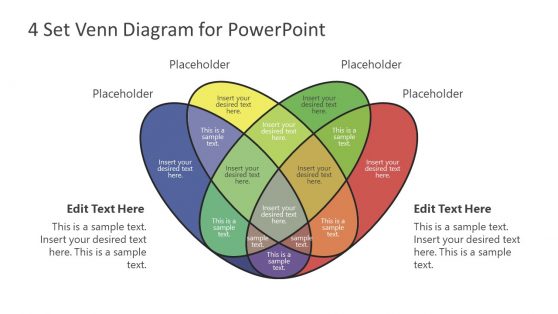
4 Set Venn Diagram for PowerPoint
Latest Templates


Project Assignments PowerPoint Template
Venn Diagram PowerPoint Template
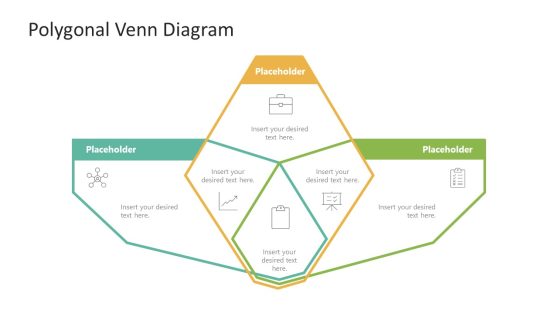
Polygonal Venn Diagram
The Venn diagram illustrates the mathematical method of logic known as set theory. It shows the relationship between two or more groups against overall data sets.
Venn diagrams are useful in situations like the comparison of competing companies to illustrate inclusive offers as overlapping parts of a circle. The pictorial representation of intersection is used in many fields including logics, statistics, business, education, science, and research.
You can download SlideModel PowerPoint templates for Venn Diagram to present similarities and differences between two or more categories. The catalog includes a range of designs for all three types of Venn diagrams. You can choose a template according to the type of relationship you want to present. These templates are easy to edit in MS PowerPoint, Google Slides, and PowerPoint Online.
What is Venn Diagram?
A Venn diagram illustrates overlapping shapes, usually circles to visualize common values among a finite group of things. The parts that overlap (intersect) have commonality while the parts that do not overlap do not have the same characteristics or values. Venn diagrams are used to compare or contrast two or more concepts.
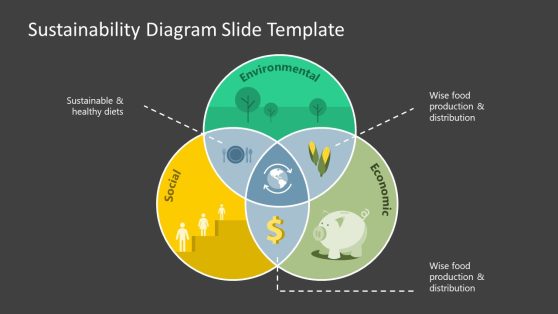
Consider the example of social, economic, and environmental factors to find an ideal office location. There are three types of Venn diagrams, Basic, Linear, and Stacked to display different overlapping properties.
What is a Venn Diagram PowerPoint template?
The PowerPoint collection of SmartArt includes basic Venn diagram templates. However, it limits the formatting options including fonts, colors, shapes, and animations.
In PowerPoint, the Venn diagram template makes mathematical and non-mathematical comparisons visually attractive. The similarities and differences displayed in the diagram are more effective than describing plain text. The Venn Diagram PowerPoint template keeps the presentation simple and interesting.
How can a Venn Diagram PowerPoint template be used in a presentation?
The variety of template designs let users choose the design to demonstrate different types of logical relationship. The Venn diagram PowerPoint templates are easier to edit and adjust according to the presentation theme.
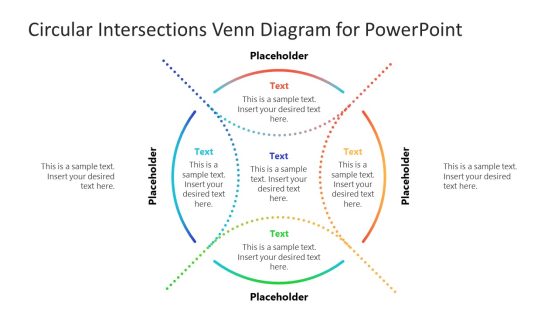
You can showcase similar traits or characteristics for informative comparison or as a decision-making tool. Use text placeholders or clipart icons to represent common values. Enter the unique values in non-overlapping areas that are not common among groups.
Alternatively, discover our step-by-step on how to make a Venn Diagram in PowerPoint.
Where do I find a Free Venn Diagram Template?
At SlideModel, we aim to provide the necessary tools to create professional presentations with no hassle. In our Free Templates section, you can find a Free Venn Diagram Template ready to be used for your next presentation.