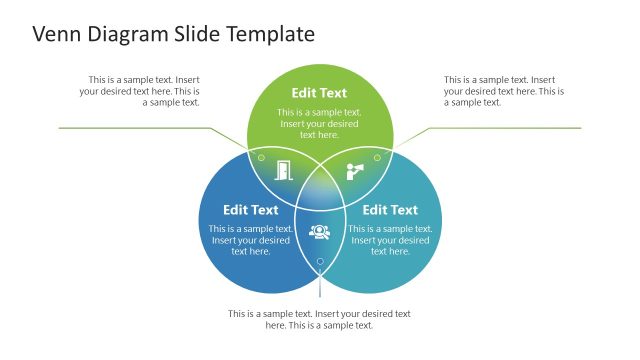
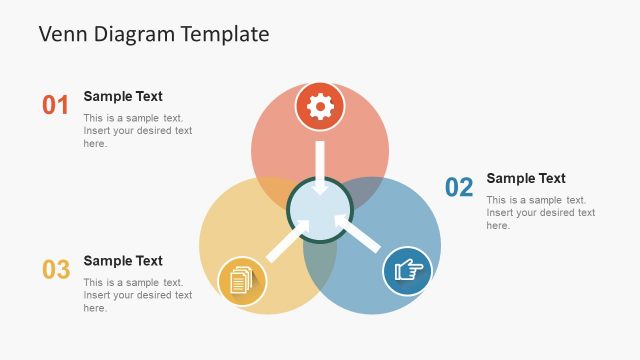
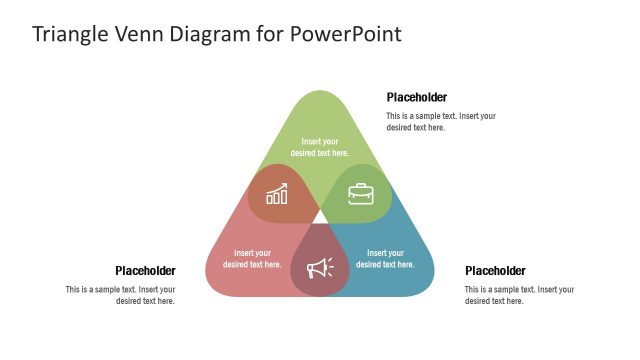
The Rhombus Venn Diagram PowerPoint Template is a simple layout of two overlapping shapes. It is an alternative diagram design of circle Venn diagrams. Using this diagram, you can display a comparison of two groups in creative diagram design. The Venn diagram in PowerPoint outlines the contrast of similarities and differences. It is a useful diagram template in the field of chemistry, socio-economic, research, and more.
The Rhombus Venn Diagram PowerPoint Template offers two versions of diagram designs. The slide with labels contains placeholders in rhombus shape to add subheadings. You can display the title of groups in labels and use inner placeholders to present the values of each group. This Venn diagram in PowerPoint also contains clipart icons to visualize the basis of the group. Take an example of comparing service subscriptions. You can display the common benefits of both plans in the overlapping part and highlight the differences in the non-overlapping area.
The slide of multiple text placeholders shows the commonality using graphics. The two bold sections for contrasts are suitable for any task. The diagram is helpful for reporting purposes. In project planning, for example, a Venn diagram in rhombus shape can highlight the relationships of tasks for optimizing schedules. Learn more about other Venn diagram ideas to use in your presentations.
The editable Venn Diagram PowerPoint Template is an ideal presentation tool for teaching. Educators use visuals to engage students in the discussion. This template provides a creative design to organize information using two versions of the rhombus Venn diagram. Alternatively, learn how to make a Venn Diagram in PowerPoint.
What’s inside this template
Example presentation scenarios
- An educator can use the labeled rhombus Venn diagram to teach similarities and differences between two theories, placing shared ideas in the overlap and unique traits in each outer diamond.
- A business analyst can compare two service packages with the callout version, using the numbered side labels for plan names and the center area for common benefits.
- A project manager can explain task dependencies with the text-dense rhombus Venn layout, separating responsibilities by team while showing shared work in the intersection.
- A consultant can present client option analysis by using the internal placeholders to list criteria, tradeoffs, and overlapping value between two strategic choices.
Features
- 100% editable presentation template
- Compatible with Microsoft PowerPoint and Google Slides
- 16:9 aspect ratio slides
- Scalable vector shapes, icons and illustrations
- AI-Ready for Microsoft Copilot and Claude
- Instant access and download
Frequently asked questions
Q: How should a presenter decide what belongs in the overlap versus the outer rhombus areas?
A: Use the center overlap only for points that are genuinely true for both groups. Keep differences in the left and right rhombus areas, and avoid repeating the same idea in multiple places. The layout works best when each text placeholder contains a short phrase, so the audience can compare at a glance.
Q: Who is this rhombus Venn diagram best suited for?
A: This template is best for presenters who need a quick two-option comparison, such as educators comparing concepts, consultants contrasting choices, or product teams explaining plan differences. The first slide supports a high-level discussion with callouts, while the second slide gives more room for detailed evidence inside each rhombus.
Q: Why use rhombus shapes instead of a standard circular Venn diagram?
A: The rhombus metaphor makes the comparison feel more structured and directional than a circle-based Venn diagram. The sharp edges create clear left, right, and center zones, while the yellow and dark gray contrast directs attention to the shared intersection. This helps audiences separate commonality from difference quickly.


Rhombus Venn Diagram PowerPoint Template
2-slide presentation template with rhombus Venn diagrams for group comparison and overlap analysis
The Rhombus Venn Diagram PowerPoint Template is a 2-slide comparison diagram for showing two groups, their differences, and their overlap. It includes a labeled rhombus Venn layout and a text-heavy rhombus Venn variant with icons and placeholders for educators, analysts, consultants, and business teams in Microsoft PowerPoint and Google Slides.
- Category
- Diagrams
- Rating

 Loading...
- Aspect ratio
- 16:9
- Item ID
- 21008-01
- Colors
 Microsoft PowerPoint
 Microsoft Copilot
 Claude for PowerPoint
Other formats supported
Subscribe today and get immediate
access to download our PowerPoint templates.