When your team looks to upscale its operations, improve efficiency, or teach new methodologies, processes are revised to determine whether they remain relevant or pinpoint potential bottlenecks. Process mapping shines among the different tools organizations can use due to its universal language interpretation in terms of conventions and symbols. Thankfully, this breaks the language barrier in multicultural teams, hence the reason for its rapid adoption when aiming to depict processes in a fast, visual manner.
In this article, we will discuss process mapping, common term mixups in relation to business process mapping, the types of process maps, and some suggested PPT templates to speed up your creative process.
Table of Contents
- What is Process Mapping?
- What is Business Process Mapping?
- What is the Difference Between Process Mapping and Business Process Mapping?
- Types of Process Maps
- The Symbology of Process Maps
- How to Create a Process Map
- Recommended Process Mapping PowerPoint Templates
- Final Words
What Is Process Mapping?
Process mapping is a technique for visually documenting the steps, sequences, and interactions involved in completing a specific task or process. The main objective of process mapping is to create a clear and concise map that helps individuals understand how a process functions from start to finish. Process maps go beyond mapping the steps in a process; they require identifying the roles involved and including the decision points so organizations can understand the activity flow, pinpoint inefficiencies, and identify opportunities for improvement.
We can find process maps in various formats, such as flowcharts, swimlane diagrams, and value stream maps, each serving different purposes and providing varying levels of detail. These visual tools are valuable for improving communication, training new employees, and supporting continuous improvement initiatives.
What Is Business Process Mapping?
Business Process Mapping is a technique for visualizing a business process’s steps, tasks, and activities. It creates a detailed diagram or map that illustrates the flow of work, the roles and responsibilities of individuals or teams, and the sequence of events required to complete the process.
The scope of business process mapping encompasses several key areas:
- Documentation: Business process mapping involves thoroughly documenting every process step, from start to finish. This includes identifying the tasks performed, the individuals or teams involved, the inputs and outputs of each step, and the decisions made along the way.
- Analysis: By mapping out processes, organizations can analyze the current state of their operations. This analysis helps identify bottlenecks, redundancies, and inefficiencies that hinder performance.
- Design and Redesign: Business process mapping is not only about documenting existing processes but also about designing new ones or redesigning current ones to improve efficiency. This can involve rethinking workflows, reallocating resources, and implementing best practices.
- Compliance and Standardization: Mapping processes helps ensure compliance with industry standards, regulations, and internal policies. It promotes consistency and standardization across the organization, reducing the risk of errors and non-compliance.
What is the Difference Between Process Mapping and Business Process Mapping?
While process mapping and business process mapping are often used interchangeably, the two have distinct differences.
Scope
Process Mapping: Typically focuses on mapping out a specific task or series of tasks within a particular area or department. It provides a detailed view of a singular process, highlighting the steps, interactions, and decision points involved.
Business Process Mapping: It comprehends a broader scope, often covering multiple processes across different departments or the entire organization. It aims to provide a comprehensive view of how various processes interconnect and contribute to achieving business objectives.
Purpose
Process Mapping: Aim to understand and improve individual processes. It is often used for troubleshooting specific issues, training employees, or documenting standard operating procedures (SOPs).
Business Process Mapping: Focuses on aligning processes with the organization’s strategic goals. It optimizes overall business performance, ensures process alignment with corporate objectives, and facilitates large-scale process re-engineering efforts.
Complexity and Detail
Process Mapping: Generally more detailed and specific, providing in-depth documentation of a particular process. It includes granular details such as individual steps, roles, and decision points.
Business Process Mapping: This may vary in detail but often provides a higher-level view to illustrate how various processes integrate and interact within the business ecosystem. It concerns the big picture and overall process flow across the organization.
Tools and Techniques
Process Mapping: Common tools include basic flowcharts, swimlane diagrams, and simple flowcharts using tools like Microsoft Visio, Microsoft PowerPoint, Google Slides, or even pen and paper.
Business Process Mapping: Often involves more sophisticated tools and methodologies, such as Business Process Model and Notation (BPMN), value stream mapping, and specialized BPM software like SAP Signavio or Smartsheet.
Types of Process Maps
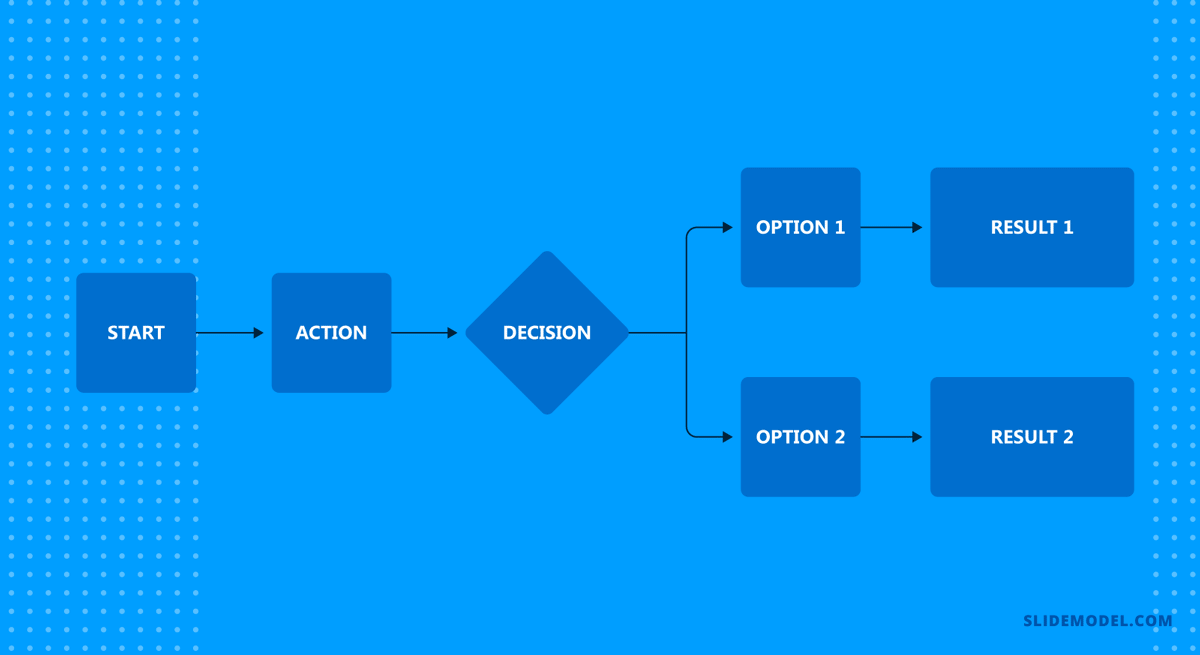
Flowcharts
Flowcharts are versatile diagrams representing the sequential flow of activities in a process. They use standardized symbols such as rectangles (for tasks), diamonds (for decisions), and ovals (for start/end points) to provide a clear visual representation of a process from start to finish. Ideal for both simple and complex processes, flowcharts are widely used in business process documentation, analysis, and improvement efforts.
Check our article on how to make flowcharts to gain a deeper understanding of this tool.
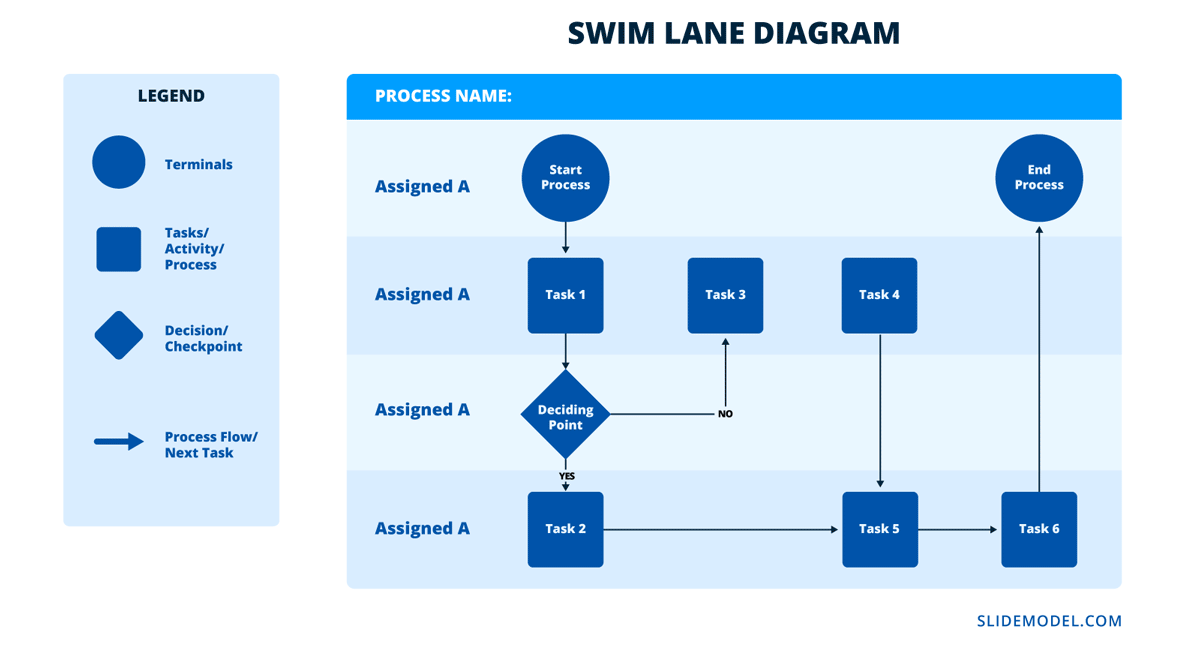
Swimlane Diagrams
Swimlane diagrams enhance traditional flowcharts by adding lanes representing different departments, roles, or individuals involved in a process. This layout clarifies responsibilities and handoffs, making it easier to identify inefficiencies and improve team collaboration. Swimlane diagrams are handy for processes that span multiple organizational functions.
In our guide on making swimlane diagrams, you will find detailed information on improving your slides. Also, check our collection of swim lane PowerPoint templates.
SIPOC Diagrams
Suppliers, Inputs, Processes, Outputs, Customers, or SIPOC diagrams, provide a high-level overview of a process by identifying its key components. This type of map is helpful in the initial stages of process improvement projects, such as Six Sigma, as it helps teams quickly understand the scope and context of a process before delving into detailed mapping and analysis.
Our guide on how to make a SIPOC Diagram can give you more insights about using this tool.
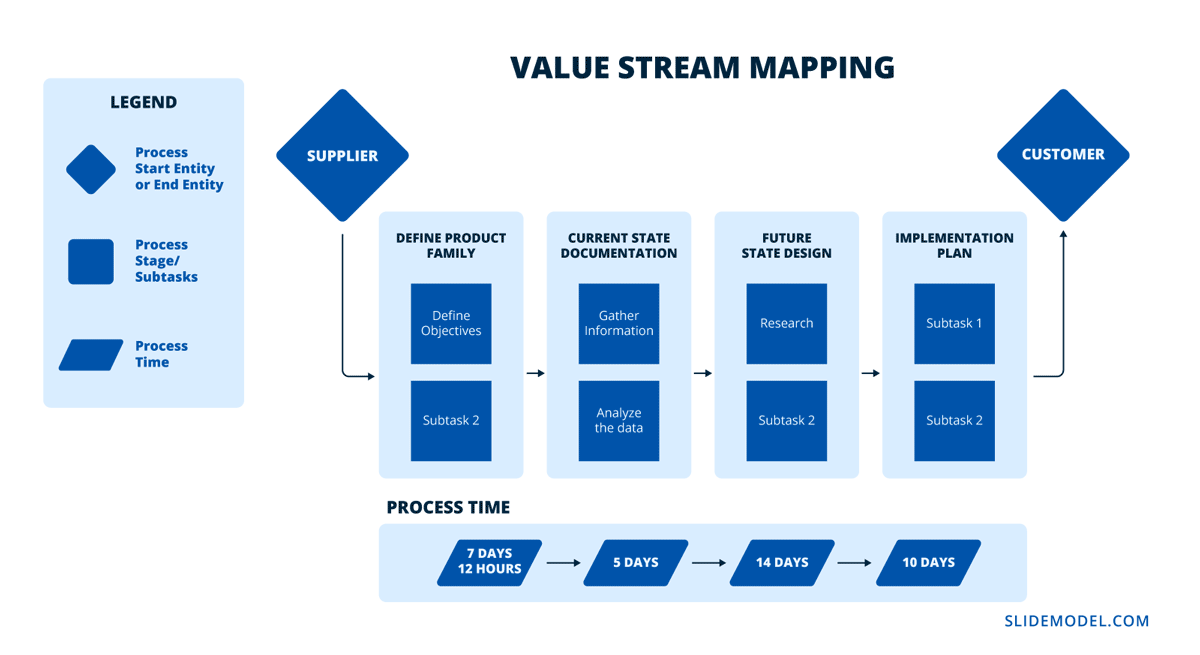
Value Stream Maps
Value stream maps are a lean management tool used to visualize the flow of materials and information needed to bring a product or service to the customer. By identifying value-added and non-value-added activities they help organizations streamline operations, reduce waste, and enhance overall efficiency. They are especially valuable in the manufacturing and service industries.
Check our guide on value stream mapping to learn more about this tool.
Bonus: Gantt Charts
Gantt charts are bar charts that represent project schedules. They outline tasks, duration, and dependencies, providing a visual timeline for project planning and tracking. While not a traditional process map, Gantt charts are essential for project management, helping teams coordinate efforts and meet deadlines and spotting potential project overlaps that can hinder the organization’s operational performance.
Learn more about Gantt charts and check our complete collection of Gantt Chart PowerPoint templates.
Bonus: Fishbone Diagrams
We considered it important to mention a complementary tool to process mapping: fishbone diagrams. Also known as Ishikawa diagrams, these maps are used to identify the root causes of a problem. They categorize potential causes into major categories (such as people, processes, materials, and environment), providing a structured approach to problem-solving and quality improvement. Fishbone diagrams are widely used in quality management and process improvement initiatives.
Discover why fishbone diagrams can help you improve your processes now.
The Symbology of Process Maps
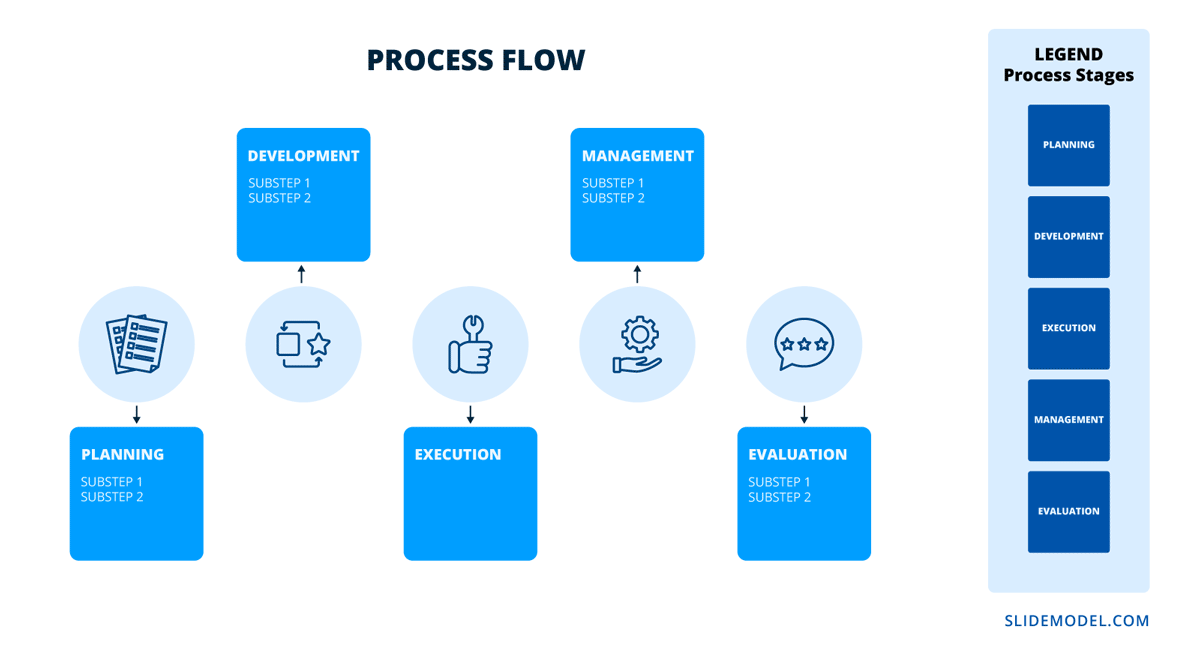
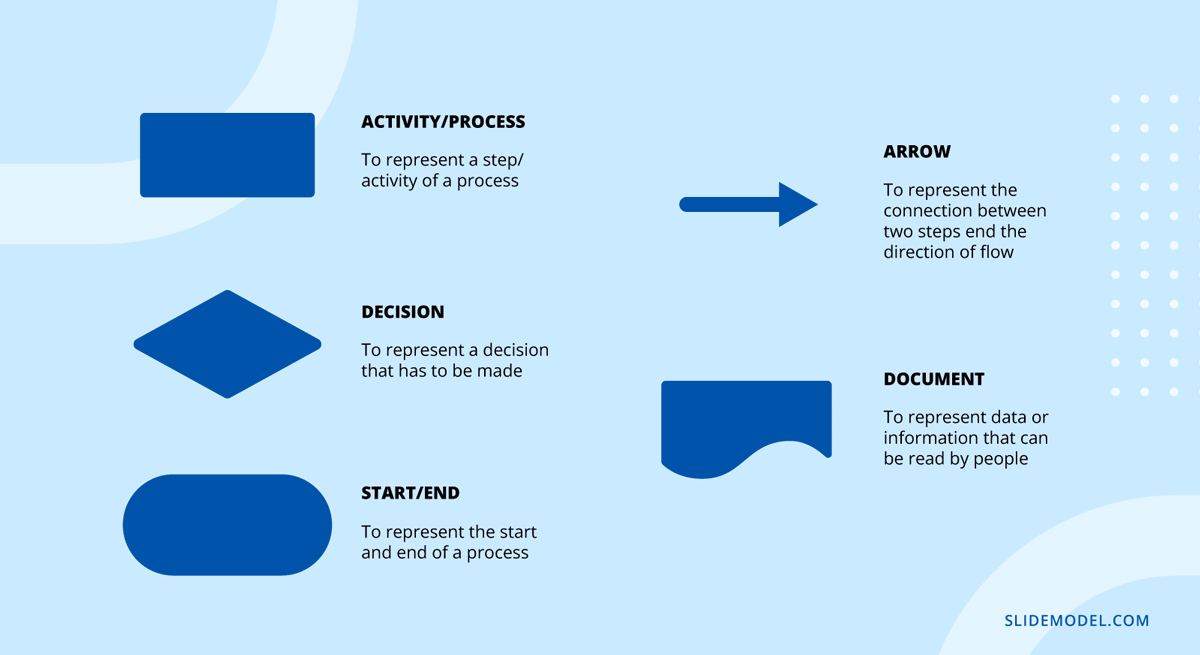
Process mapping examples often stand out due to their easy-to-recognize shapes and harmonious color palette. As a matter of fact, a process map requires a symbology to represent the stages of processes, which are as follows.
- Oval: Start and end points.
- Rectangle: Process steps or activities.
- Diamond: Decision points.
- Arrow: Flow direction.
- Circle: Connectors or continuation points.
How to Create a Process Map
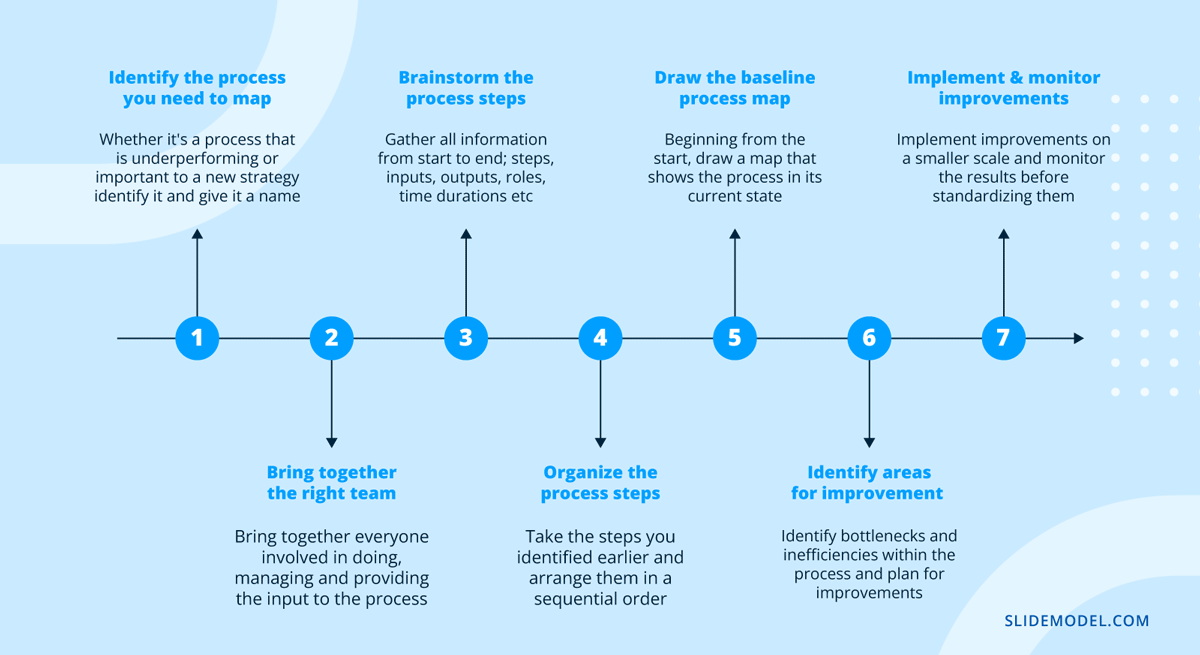
We can summarize the process map creation process in five steps.
Identify the Process
Begin by identifying the specific process you want to map. This could be a core business process like order fulfillment, a support process like employee onboarding, or any other operational activity that needs improvement. An important factor is to be aware that the selected process is significant enough to warrant mapping but not so complex that it becomes unmanageable.
Then, define what you hope to achieve by mapping this process. Objectives could include improving efficiency, reducing costs, enhancing customer satisfaction, or ensuring compliance with regulations.
Define the Boundaries
Clearly define where the process begins and ends. The start point could be initiating a task (e.g., receiving a customer order), and the endpoint could be completing that task (e.g., delivering the product to the customer).
If the process is too large, limit the scope to manageable portions. This helps keep the mapping focused and detailed, preventing it from becoming overwhelming.
Gather Data
The data collection process requires multiple approaches, such as interviews, observations, questionnaires, and reviewing existing documentation. To gather firsthand information, engage with people directly involved in the process.
Document each step in the process, including who performs it, what tools or systems are used, and any inputs or outputs. Capture decision points, interactions, and the flow of information or materials. Note down key performance indicators (KPIs) and metrics related to the process, such as time taken for each step, error rates, and costs. This data will be valuable for analysis and improvement.
Draft the Map
Start drafting the process map using standardized symbols and notation. For example, use rectangles for tasks, diamonds for decision points, and arrows for flow direction. Arrange the steps in the correct sequence, ensuring the logical flow of activities from start to finish. Be detailed but avoid unnecessary complexity.
Indicate who is responsible for each step. This can be done using swimlane diagrams or simply noting the roles next to each activity.
Review and Validate
Share the draft map with stakeholders, including those who perform the process and those who oversee it. Their feedback is crucial for ensuring the map accurately reflects reality. Check for accuracy and completeness. All steps must be correctly represented, roles accurately assigned, and decision points clearly depicted.
Look for any discrepancies or gaps in the process. Stakeholders can provide insights into parts of the process that may not be well-documented or understood. Based on the feedback obtained, you can refine the map before sharing it with all involved team members.
Keep in mind the recommended steps here apply to any kind of process map. If your intent is to create a business process map, follow the steps shown in this infographic.
Recommended Process Mapping PowerPoint Templates
This section lists our selection of the best process mapping PowerPoint templates to help you speed up your presentation design workflow. Each of these templates is entirely repurposable so that you can create high-level documents from these slides.
1. SIPOC Process Mapping PPT Template
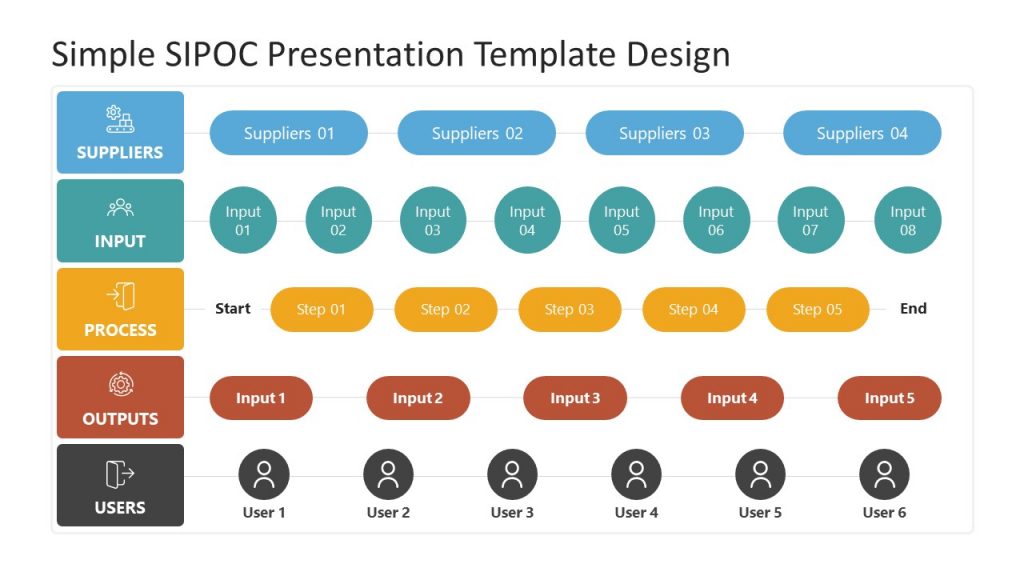
Work with a SIPOC Diagram in a format akin to typical sample process maps you can find online. With vivid colors and two color theme options, you can create an effective process map with this template.
2. 6-Step Swimlane Process Map PowerPoint Template
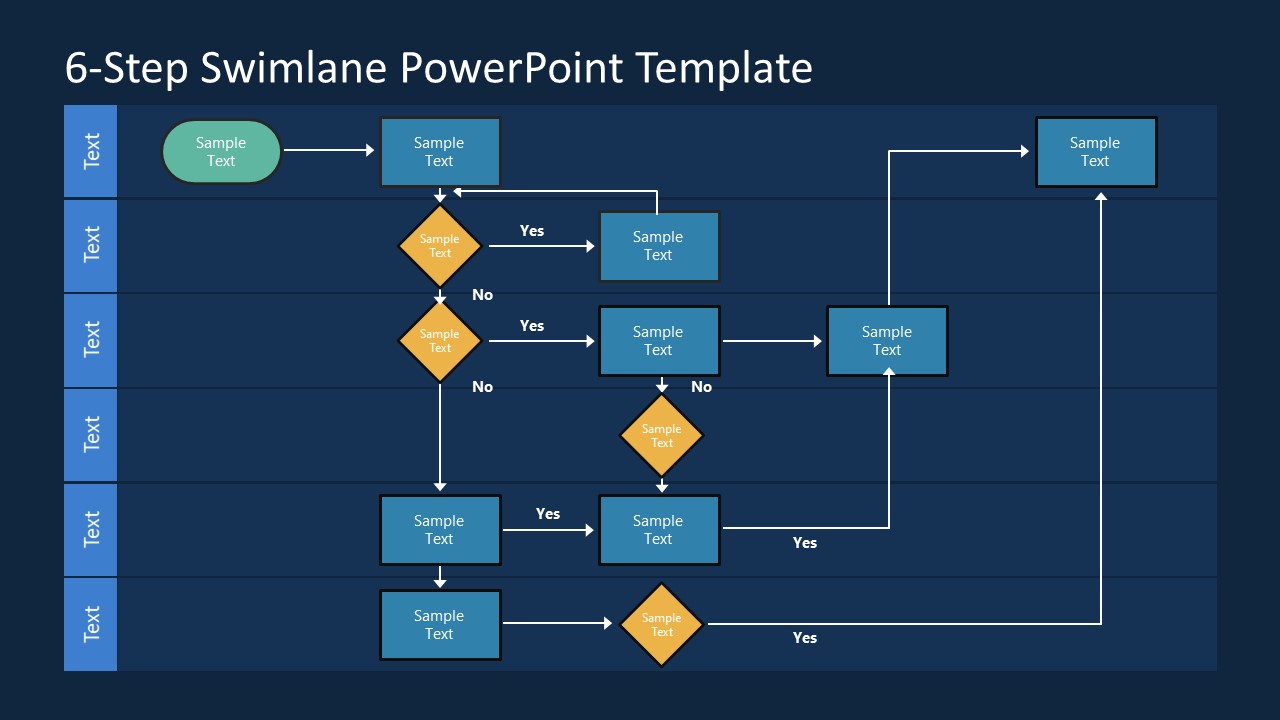
Represent elaborate processes with this swimlane template containing six stages to describe the action at each decision stage. Ideal for depicting manufacturing production processes, management protocols, customer service escalation processes, etc. Two theme options to choose from.
3. Customer Service Swimlane Template for PowerPoint and Google Slides
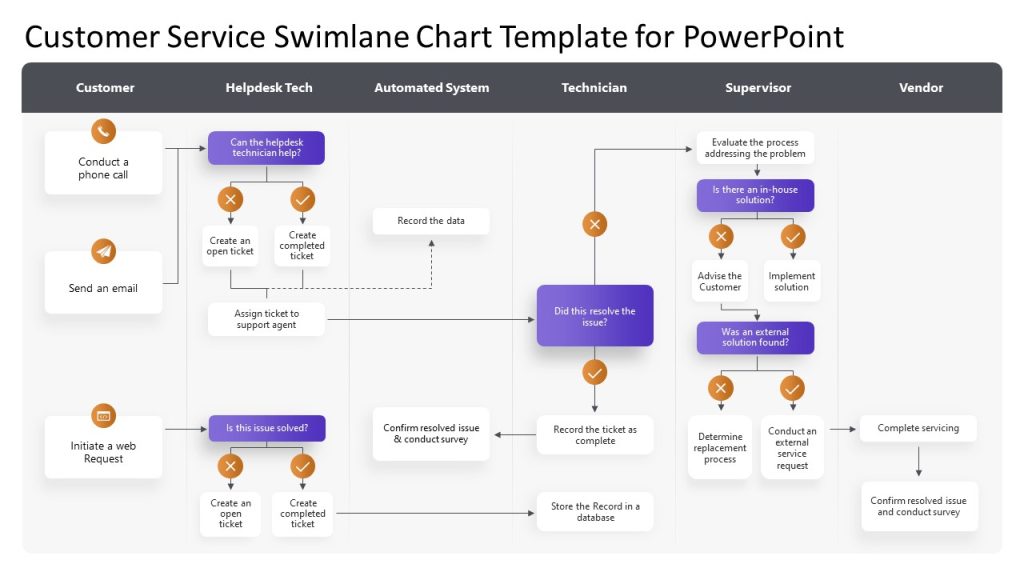
If you are looking for an ideal customer ticket escalation template, this process map is your safest bet. Tailored for customer service professionals, it’s a great asset for training new employees on the company’s protocol for conflict resolution.
4. Order Process Mapping Swimlane Template
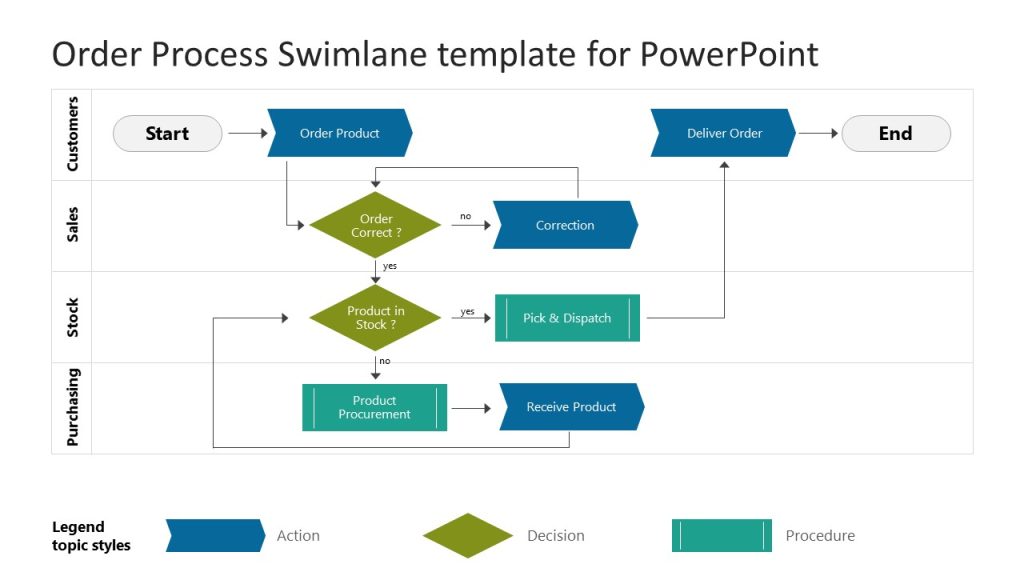
This specific swimlane template is an excellent example of process mapping for the e-commerce industry. It showcases the process from order placement to delivery of goods, with each stage of the internal processes.
5. Business Process Mapping PPT Template
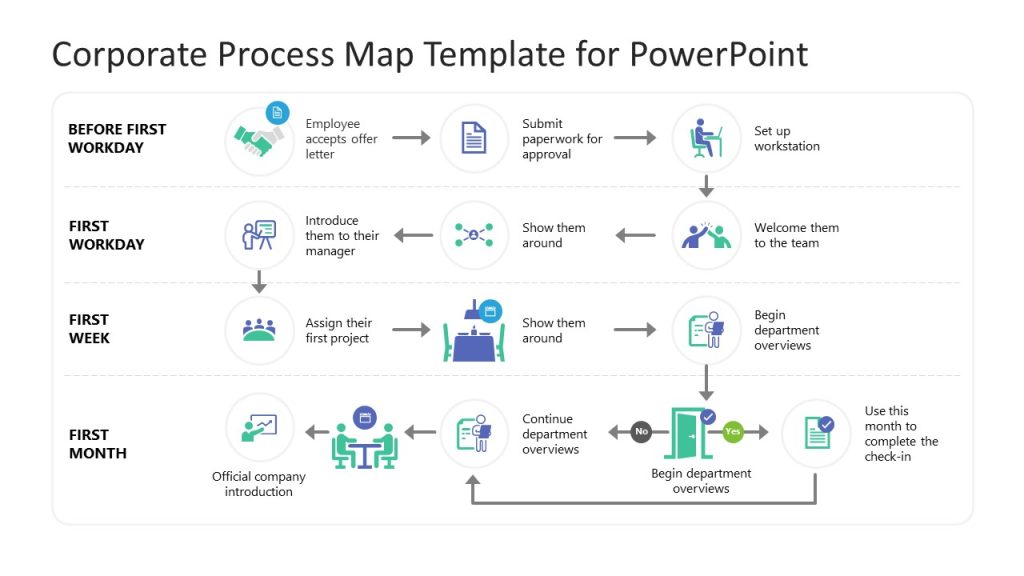
A fine case of a sample process mapping slide without the typical symbology, opting instead or more eye-catching icons to engage the audience. This process map slide deck is best suited for business process mapping cases.
6. Hand-drawn Flow Chart Process Map PPT Template
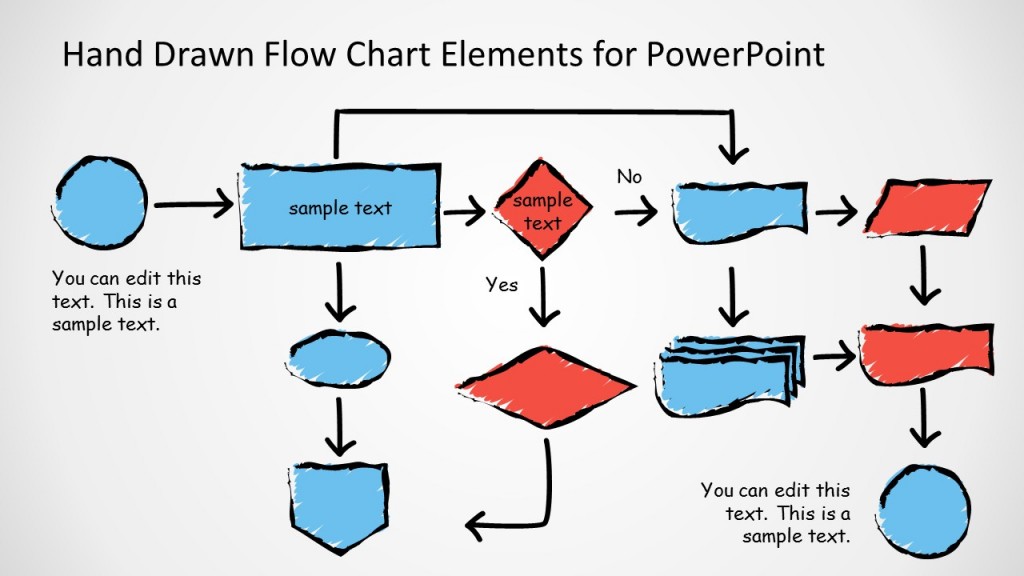
We conclude this list with a handmade flowchart template, which can be a great solution for in-team meetings when crafting a flowchart to explain a process.
Final Words
As we can see, process maps are versatile tools that can fit into a vast range of solutions for process design, management, and improvement. We hope this article has cleared the most common misconceptions on process mapping as well as delivered tools for success. See you next time!