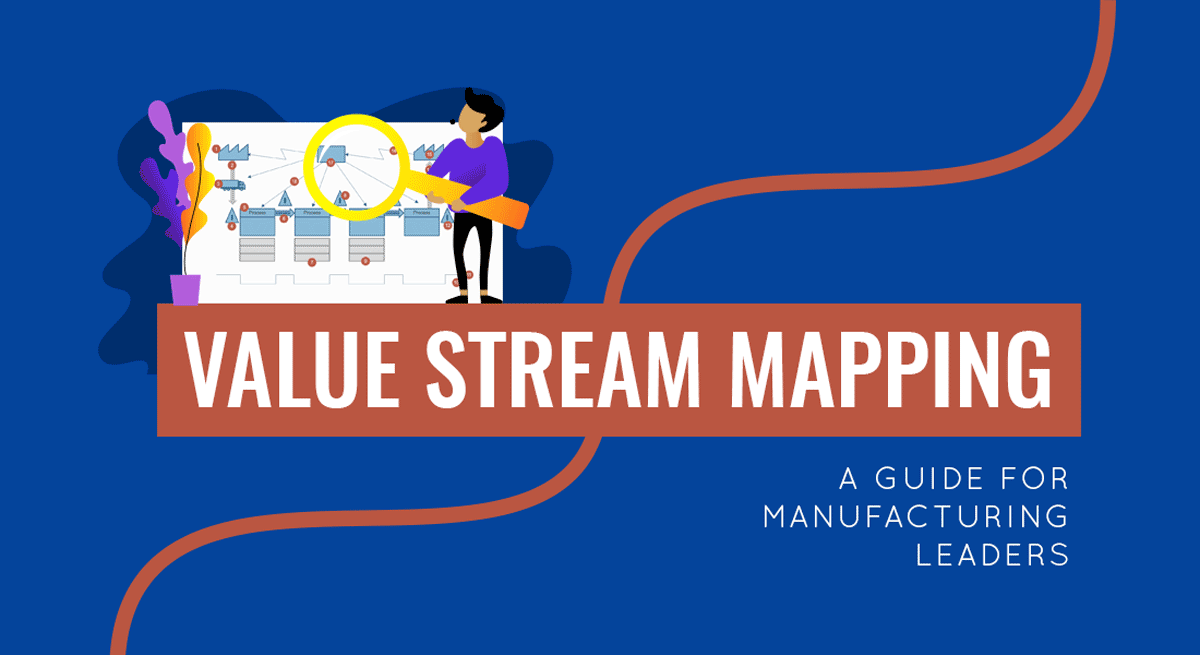
It doesn’t matter whether you manufacture electric batteries for vehicles or toy trucks. The manufacturing processes will have very similar steps, processes, and areas of waste. If you are struggling with the latter, value stream mapping may help you locate actionable ways to become leaner.
What is Value Stream Mapping (VSM)?
Six Sigma defines Value Stream Mapping the following way:
Value stream mapping (VSM) is a Lean manufacturing or Lean enterprise technique used to document, analyze, and improve the flow of information or materials required to produce a product or service for a customer.
The goal of VSM is to identify how different participants in the manufacturing process contribute to the creation of value.
According to Lean methodology, “value” is any information, material, or service a customer would pay for. Value stream mapping, in turn, is a tool for identifying different value streams within an organization, plus understanding what processes and actions positively or negatively contribute to value production.
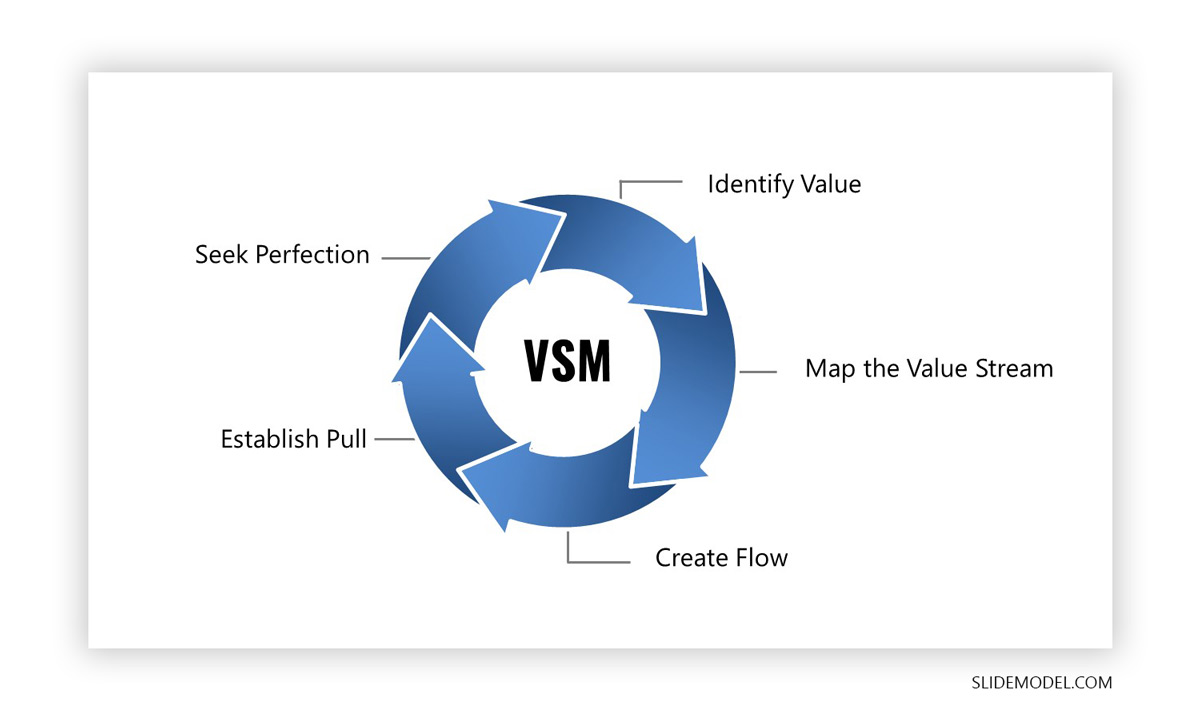
In essence, value stream maps are created to help organizations implement the five main principles of Lean.
Another advantage of a value stream map is that it’s far more comprehensive than traditional process maps as you can fit in a more significant number of checkbox processes and connections between them, as illustrated below:
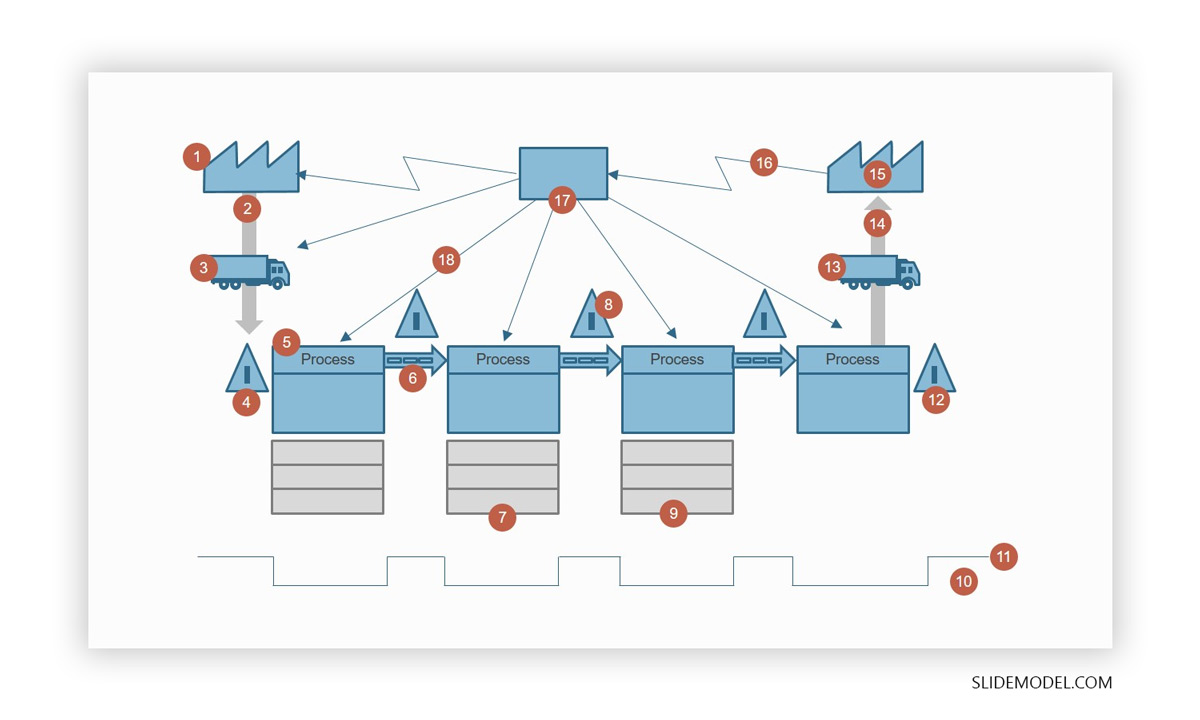
As you can see this value stream map slide, it covers a broad range of processes — from receiving raw materials from the supplier to delivery to the end-customer. Additionally, you can precisely see how information and material exchanges happen between different participants in the manufacturing process.
While VSM was originally proposed for manufacturing, this lean technique is now adopted by software development teams too since it allows to effectively illustrate all the process exchanges within both physical and digital production environments.
What is Value Stream Mapping Used For?
VSM allows the creation of an end-to-end system map of complex manufacturing processes—both physical and digital goods. In short, this lean technique helps identify production bottlenecks and process inefficiency and addresses miscommunication or overcommunication issues so that the organization can ship more quality products at a lower cost.
Departments that often use value stream mapping for processual improvements are:
- Manufacturing (primary user)
- Logistics
- Supply chain management
- IT services provisioning
- Software development
- Human Resources
The Benefits of Value Stream Mapping
The purpose of VSM is to help you gain more clarity into how information, materials, and value travels throughout your organization:
To find improvement opportunities, you can apply VSM to the entire production chain or just certain segments of it.
Okay, but do you have value stream mapping examples, showcasing the scope of potential improvements? Absolutely!
A 2020 case study of lean manufacturing implementation for a batch-type manufacturing industry company shows that:
- 74% fewer component defectives were observed after the implementation of lean manufacturing principles.
- On top, the productivity of people and the equipment they cooperate increased.
Another case study conducted with a printing company found that the implementation of lean manufacturing tools has led to:
- 8 second time reduction in printing one calendar with over 6h saved per month.
- Overall equipment effectiveness increased from 34.3% to 60%.
Sounds promising? Let’s take a look at how you too can harness value stream mapping process improvements.
How to Do Value Stream Mapping: a 6-Step Framework
The particular appeal of VSM is that it can be a paper and pencil tool or a simple value stream mapping template, created in PowerPoint or Google Slides. You don’t need to invest in any new software to create a basic value stream map.
What you should be mindful of, however, are the standard value stream mapping steps.
1. Learn the Common Value Stream Mapping Symbols
A value stream mapping symbol is a standardized icon for denoting a certain process on the map. Originally proposed by the Lean Enterprise Institute in their “Learning to See“ workbook, the following set of VSM symbols became an industry-wide standard:
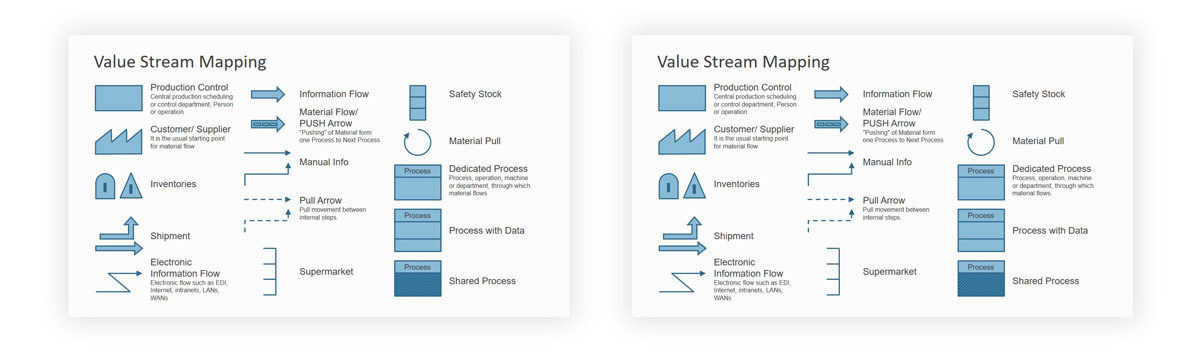
Conditionally, all value stream mapping symbols can be grouped into 4 categories:
- Processing symbols:
- Examples: Shared process flow, Customer/ Supplier, etc.
- Material symbols:
- Examples: Inventories, shipments, push arrow, etc.
- Information symbols:
- Examples: Production Kanban, Signal Kanban, electronic information flow, etc.
- General symbols:
- Examples: Idea, timeline, Kaizen Burst (more on this later), and others.
Treat VSM symbols as a shorthand for communicating various processes, events, and actors within your system.
2. Create a Simple Current State Map for the Selected Process
Rather than attempting to create an end-to-end map, start with one simpler process. For example, product delivery from the warehouse from the consumer.
Your first step is to document all actions you need to take to get from point A (product in the warehouse) to point B (product in consumer’s hands). For example, your steps may include:
- Packaging
- Printing shipping labels
- Physical labeling
- Giving the product to a shipping partner
- Creating a shipping notification in your system
- Sending a tracking code to a customer.
The above is a truncated version of a Product Flow — all the steps required to produce a product (from concept to delivery).
The next value stream mapping step is to indicate all important Information Flows — information exchanges that happen as the product travels through various manufacturing stages. Going back to the example above, your warehousing system is probably integrated with an inventory management system, so that your team knows to whom different orders belong and when/where they need to be shipped. On the other hand, you may not have a direct integration with your shipping partner. So you need to regularly communicate with them when orders are due for pick-up, what volume they should expect, and so on. Your fulfillment department will be likely responsible for that.
On a value stream map, you should depict each entity’s (fulfillment team & shipping partner) output as blocks and draw arrows to show how information should travel between them.
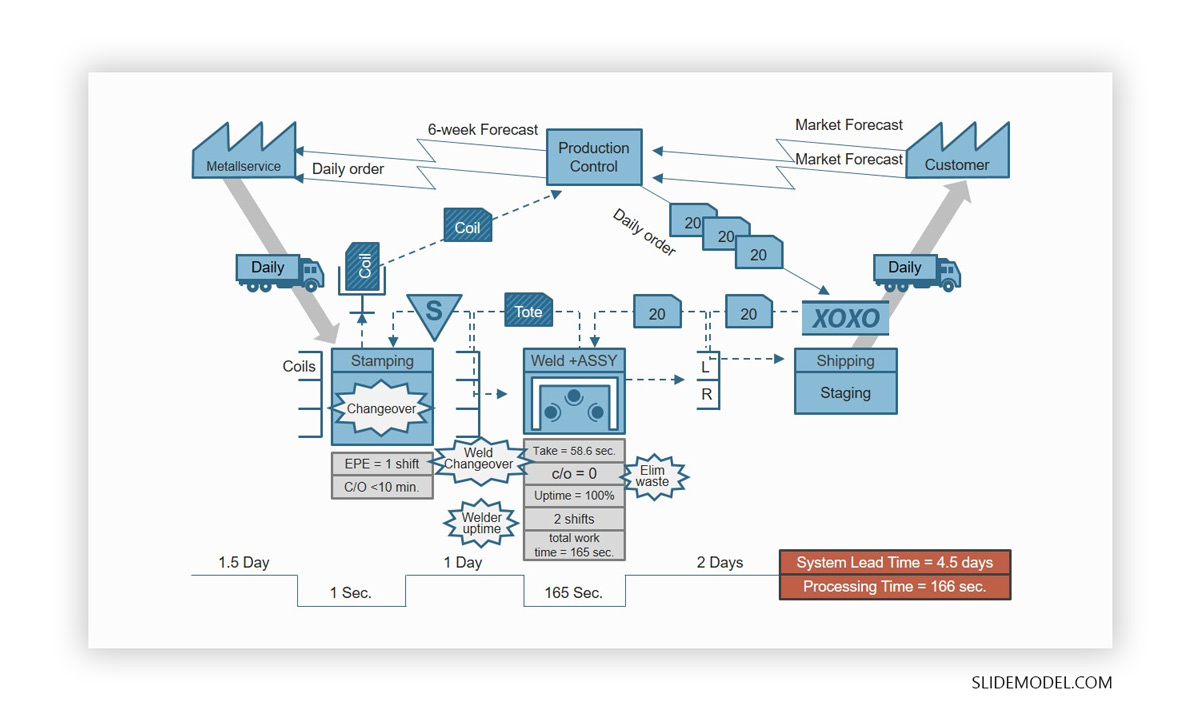
3. Collect Extra Data to Improve Your Map
Once you’ve mapped out the basic processes and connections between different production steps, let’s try and establish this value.
Specifically, you should look into finding current data for the following KPIs:
- Time Ladder indicates the average time a certain product stays blocked (e.g. in a queue or at the waiting gate) between different stages of the process.
- Cycle Time (C/T) measured per unit, stands for the time elapsed between the start and finish of the production cycle.
- Setup Time (S/T) represents the timeframe you need to prepare for any given step.
- Uptime (%) is a percent of the total time when the process/systems are in an active state (i.e. work to produce some value).
- Lead time measures the average time required for pushing the entire product through the lifecycle.
Once you’ve collected all the historical data points, add them to your value stream map template. This will be your ‘current state’ map.
4. Identify Waste Areas
Lean manufacturing recognizes 7 areas of waste in production. “Waste” denotes all actions that hinder, rather than facilitate value creation throughout the product life cycle. These areas include:
- Transportation: Moving raw materials or product parts from one location to another hardly adds value to end-product quality, cost, or efficiency of production. Consider how you could optimize your supply chain management with digital technologies or by reducing the geographical discrepancy of suppliers.
- Inventory management: Holding too much inventory can majorly increase your operational costs, especially if you struggle to move it promptly. Reassess your distribution and marketing strategies if that’s the case or consider reducing the production volume of non-moving goods.
- Motion: Unnecessary physical movements and task switching also create waste. For example, if your warehouse employees need to walk to another room to get printing labels, that’s wasted time. You might want to consider re-arranging the work premises.
- Waiting: Ques and bottlenecks occur when one of the connected processes isn’t well aligned with the next one. For example, unnecessary approvals can increase waiting times between different manufacturing steps. See if you could improve your stakeholder management.
- Over-processing: Having too many standard operating procedures, for example, related to quality assurance, can slow down product flows. Determine if you really need too many checkpoints to ensure adequate product quality.
- Overproduction: Producing more than you can move is a wasteful behavior as you could spend those funds elsewhere.
- Defects: product re-works or scrapping are the obvious money-wasters. Is there any way you could reduce defect rates within every process on your map?
5. Schedule Kaizen Bursts
Once you’ve learned where waste occurs, you should start acting. Kaizen Bursts are a complementary team activity to VSM, aimed at resolving specific manufacturing challenges.
Scheduled over 3-5 days as a series of brainstorming events, the end-goal of a burst session is to address and eliminate a certain inefficiency. For example, you’ve found that a certain process has a very high setup time. So you’ve gathered the department manager and investigate the root cause of the problem. Together, you’ve found that high setup time is caused by outdated equipment with very limited throughput. After consulting with the engineer, you decide to retire the machine and order a replacement.
6. Design Future Value Map
The final state of value stream mapping is a ‘desired to-be-state’ map — a visual representation of the future system’s state that you’d like to achieve. List specific KPIs for each of the tracked measures (cycle time, lead time, etc.). Create an improvement roadmap, addressing the identified waste areas. And then confidently work towards achieving that ideal state!
Final Words
Value stream mapping is a simple, yet effective technique for identifying weak processual areas and figuring out the right course of improvements. The only slight drawback is that it doesn’t allow you to monitor the impact of changes you are making (or the progress on them). So it’s best to pair VSM with another project management technique (e.g. Kanban or Scaled Agile) to track the execution.