Overlapping definitions and complex hierarchies are often classified using diagrams that can clearly show the relationship between different sets. One of these models is the Euler diagram, which is often used for differentiating between sets to understand the relevant relationship between them. In this article, we shall explore what defines an Euler diagram and how to construct one.
What is an Euler Diagram?
An Euler diagram is a visual representation of the relationship between different sets and is used for understanding complex hierarchies and validating arguments. The diagram is used by presenting connections among sets using shapes. It is similar to a Venn diagram. However, unlike a Venn diagram, it only shows relevant relationships between sets. The Euler diagram provides a great way of explaining complex hierarchies and overlapping definitions while presenting only relevant information.
Euler diagrams depict closed shapes using a two-dimensional plane, each showing a category. The overlapping of these shapes demonstrates the relationship between sets. Euler diagrams are used across various fields, such as for the purpose of business analysis and concept modeling, mathematics, biology, etc.
History of the Euler Diagram
The use of the Euler diagram is attributed to Leonhard Euler, who was an 18th-century Swiss mathematician. He is considered one of the greatest mathematicians to have ever lived.
Euler made contributions in the field of mathematics, mechanics, optics, astronomy, and fluid dynamic. He is credited with the earliest use of the circular diagrams to explain relationships, which Euler used for the purpose of illustrating syllogistic reasoning with the help of closed curves. In the 20th century, the Euler and Venn diagrams were incorporated in the United States as a part of set theory instructions during the 1960s.
Why Use Euler Diagrams?
There are numerous uses of the Euler diagram across various fields. Some of the common reasons for using Euler diagrams are mentioned below.
Explain Complex Hierarchies
Euler diagrams are important for explaining complex hierarchies and overlapping definitions. By using an Euler diagram, you can represent sets and show relevant information in the form of relationships between sets.
Visually Organize Information
Euler diagrams can help visually organize information for analysis and study, as the sets can be clearly differentiated in a diagrammatic form.
Comparison of Relevant Information
Euler diagrams can help organize and visualize relevant information to help better understand and compare it. Such a diagram can enable breaking down information to identify where sets intersect and overlap.
Example of How to Construct an Euler Diagram
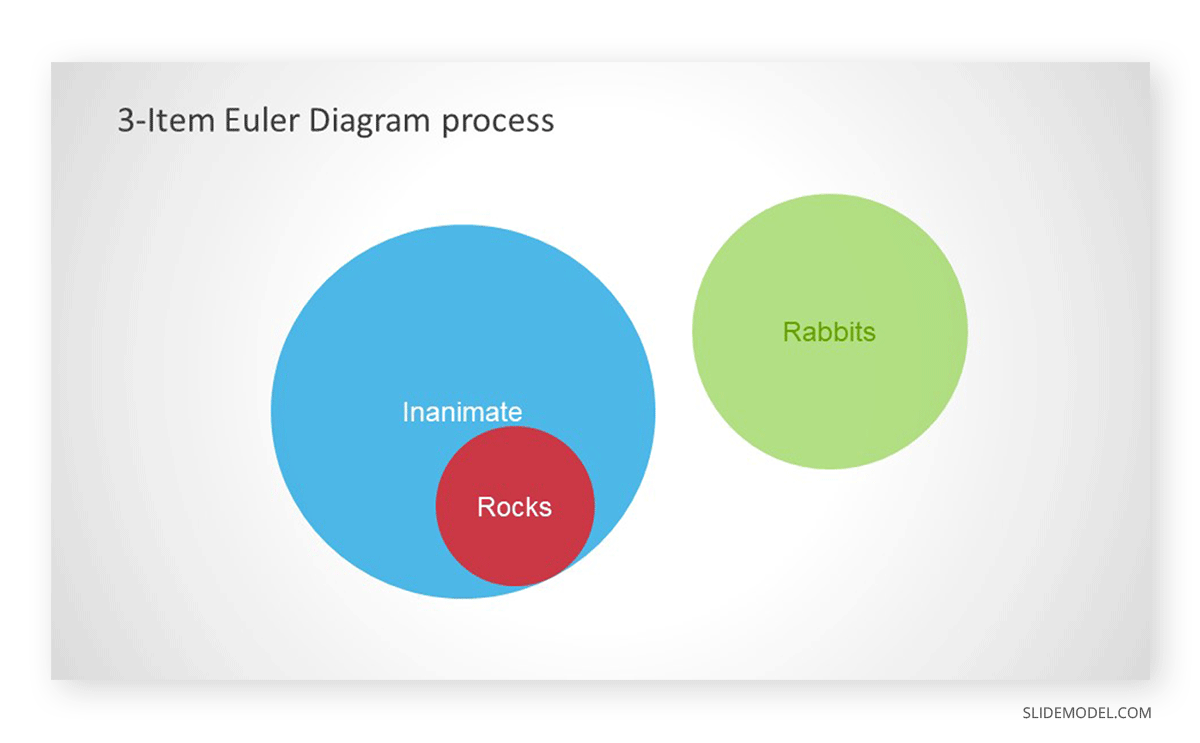
By following the example given below, you can construct an Euler diagram. We will draw an Euler diagram to represent this statement:
- All rocks are inanimate.
- No rabbits are rocks.
- No rocks are rabbits.
Step 1. Represent 3 Categories
In this example of an Euler diagram, we will construct 3 circles to represent 3 categories (rocks, rabbits, and inanimate).
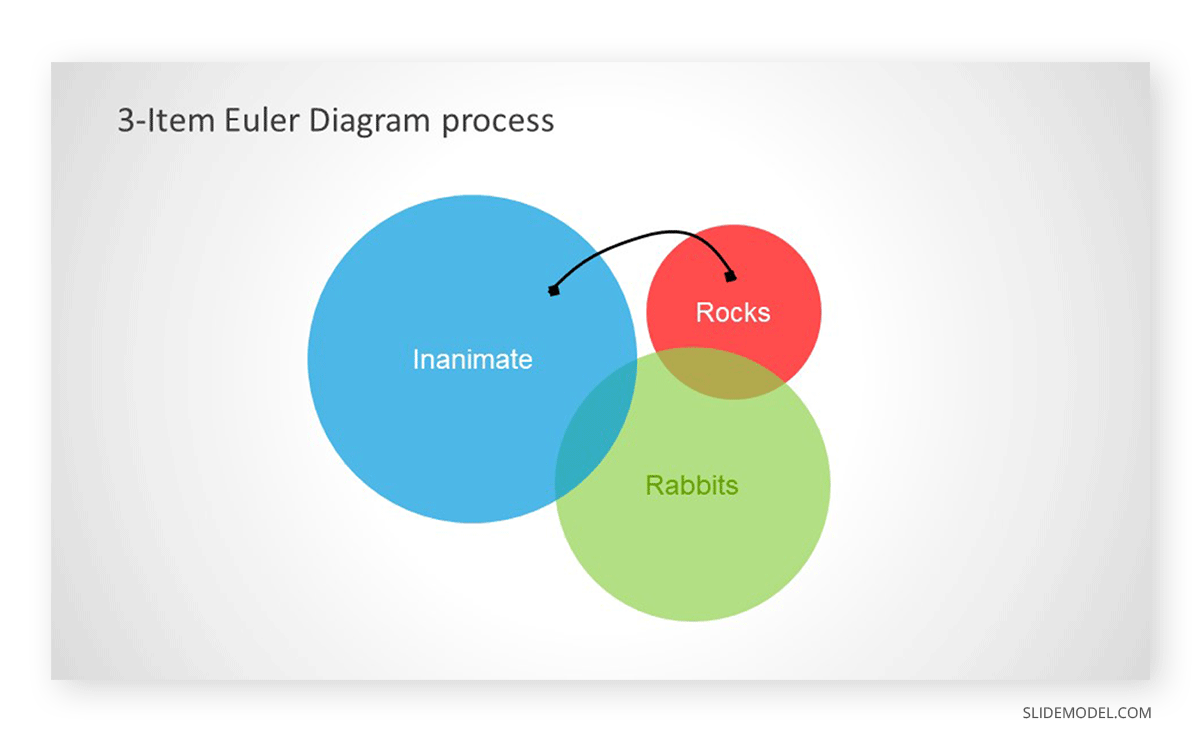
Step 2. Move the Corresponding Circle According to The First Statement
Read the statement above and move circles accordingly. Since ‘all rocks are inanimate,’ this means that the entire rocks’ circle needs to be inside the inanimate circle.
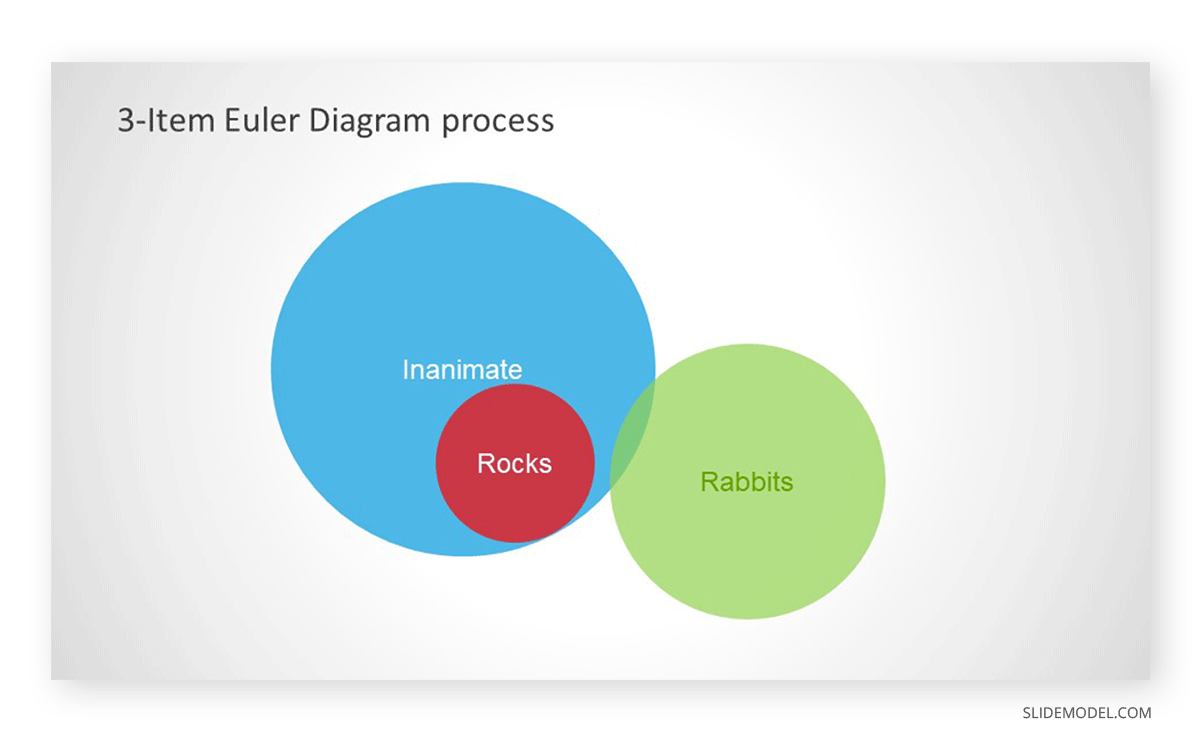
Step 3. Move the Corresponding Circle According to The Second Statement
Read the second statement and then move the corresponding circle to represent information. Since ‘no rabbits are rocks,’ this means that the entire rabbits’ circle will be outside the rocks circle.
Step 4. Move the corresponding circle according to the third statement
Read the last statement and move the circle accordingly. Since ‘no rocks are rabbits,’ the entire rabbits’ circle should be outside the inanimate circle. As this circle is already outside, we have correctly constructed the Euler diagram.
Differences Between Euler Diagram and Venn Diagram
While Venn and Euler diagrams can appear similar, there are a number of differences between them.
The difference in Representation of Relationships Between Sets
The most significant difference between a Venn and Euler diagram is that a Venn diagram represents all possible relations between sets. However, an Euler diagram shows only relevant relationships.
The complexity of Visual Representation
A Venn diagram becomes far more complex than an Euler diagram beyond three sets. This is because of the representation of all possible relations in a Venn diagram, unlike an Euler diagram which focuses on relevant relationships only.
Intersection Requirements
In an Euler diagram, only intersections that aren’t empty are represented. However, in a Venn diagram, each intersection between each set is represented.
Using Euler Diagrams (Real World Applications + Examples)
To better understand the use of Euler diagrams, let’s take a look at a few real-world applications and examples.
Analyzing Arguments with Euler Diagrams
Euler diagrams are used for analyzing and validating arguments. This is perhaps the most common reason for using Euler diagrams. By using deductive reasoning with the help of an Euler diagram, you can validate an argument by following a few simple steps. Other than the Euler diagram example mentioned earlier, the below video provides a few additional examples of how you can validate an argument by constructing an Euler diagram.
Euler Diagram for Concept Modeling
As mentioned earlier, one of the applications of Euler diagrams is for concept modeling. A conceptual model is a representation of a system where concepts are used to help understand and simulate subjects associated with the model. For example, Euler diagrams can help business analysts to understand the complexity of different relationships between various concepts.
Euler Diagrams in Education
Since Euler diagrams have mathematical applications, they are also commonly used to educate students, such as for solving math problems or to show the relationship between sets in a simplified manner. Explaining complex hierarchies using a simple diagrammatic representation.
Tools for Creating an Euler Diagram
Euler diagrams are so easy to construct that you can use a number of tools to construct them. There are a number of cross-platform and web apps available that can help you create Euler diagrams.
Adobe Photoshop/Illustrator
If you are good with using complex apps like Adobe Photoshop or Adobe Illustrator, you can construct an Euler diagram quite easily. Since both softwares use layers, it can also be easy to move around the shapes as you try to validate an argument or find relationships between sets.
Inkscape
Inkscape is a famous cross-platform application for making scalable vector images. You can also use Inkscape to draw diagrams. Inkscape also provides the utility of transforming shapes by moving, scaling, or rotating them. While Inkscape is a complex tool, with a bit of skill, it can help you create visually appealing Euler diagrams. Other than Windows and Mac, the app is also available for Linux and FreeBSD.
Microsoft Paint
One of the easiest methods of creating an Euler diagram is by using shapes in Microsoft Paint. Since Euler diagrams are usually constructed using circles, you can pick the circle shape in MS Paint to create an Euler diagram and label it using text. However, since moving shapes isn’t possible using layers in MS Paint, you might find it harder to use.
Google Drawings
Google’s drawing app available in Google Drive can be another good option for drawing an Euler diagram. The drawing app can be particularly useful for people who are good with freeform drawing. You can also export your drawings in PNG, JPG, SVG, and PDF format.
Google Slides and PowerPoint
If you find it difficult to construct Euler diagrams on your own, you can also use readymade PowerPoint templates or use shapes in PowerPoint or Google Slides to construct your diagram.

Since both platforms are extremely easy to use and allow moving around slide objects, you can also look to validate arguments as you find relationships between sets using a presentation slide. Diagrams constructed this way might also be easier to present compared to static images since you can also animate objects.
FAQs
How is an Euler Diagram different from a Venn Diagram?
– Relationships: A Venn diagram depicts all possible relationships between sets, while an Euler diagram only shows relevant ones.
– Complexity: Venn diagrams can become overly complex with more than three sets, whereas Euler diagrams simplify relationships by excluding irrelevant intersections.
– Intersection Requirements: Euler diagrams represent only intersections that are not empty, while Venn diagrams show all possible intersections.
What are the benefits of using Euler Diagrams over Venn Diagrams?
– Clarity: Simplifies representation by focusing only on relevant relationships.
– Ease of Understanding: Easier to interpret, especially with multiple sets.
– Flexibility: Better suited for complex hierarchies without unnecessary intersections.
Can Euler Diagrams be used for validating arguments?
Yes, Euler diagrams are excellent for validating arguments. By visually representing relationships between sets, one can use deductive reasoning to analyze and confirm logical statements.
Are there ready-made templates for Euler Diagrams?
Yes, many platforms like PowerPoint and Google Slides offer pre-made templates for Euler diagrams. These templates make it easy to create and customize diagrams for presentations and reports. Also, check our complete collection of euler diagram templates for presentations.
How do businesses use Euler Diagrams?
Businesses use Euler diagrams for:
– Concept modeling and analysis.
– Visualizing relationships between products, services, or stakeholders.
– Simplifying complex data for decision-making and strategy planning.
What skills are needed to create an Euler Diagram?
– Understanding relationships and logical connections.
– Basic drawing or software skills for diagram construction.
– Attention to detail for accurate representation of relationships.
Final Words
Euler diagrams have applications across various fields and can be a simple method for identifying relevant relationships between sets. While a Venn diagram can become too complex due to its limitation of incorporating all possible relations when depicting sets, the Euler diagram resolves this issue by focusing only on more specific information.
Euler diagrams are also great for validating arguments. However, the use of these diagrams in mathematics can be a bit complex. Therefore, if you are new to the concept, you can start with a basic diagram to validate an argument to better grasp the construction of such a diagram before moving on to visually deconstructing more complex hierarchies and relationships between different sets.