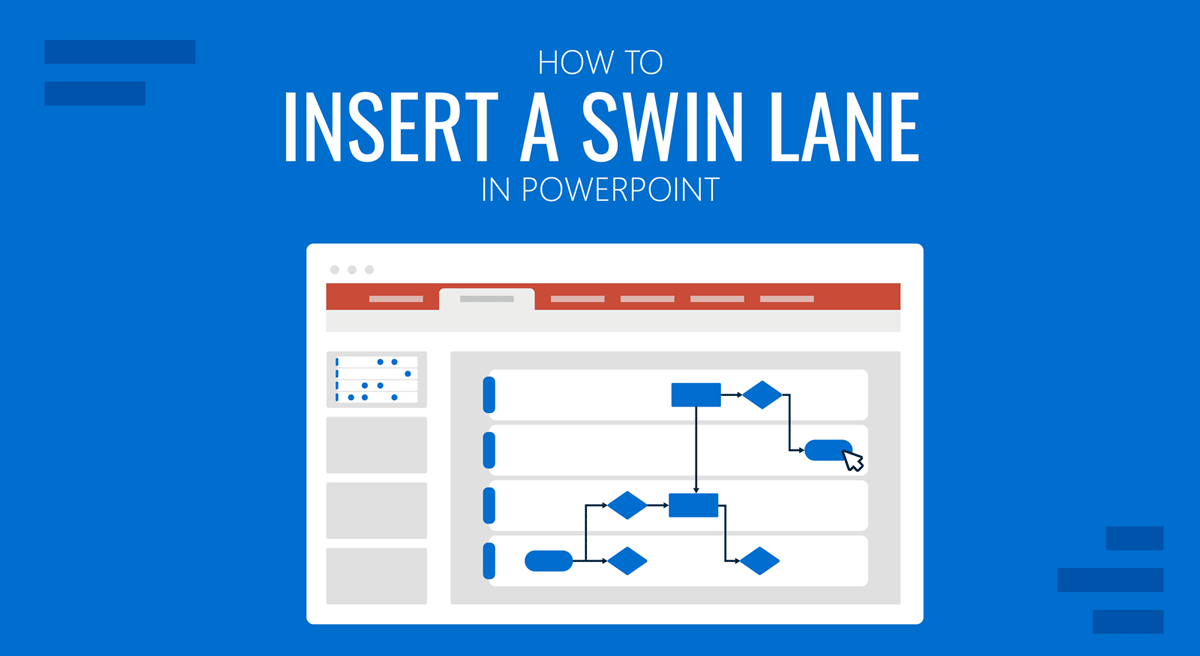
Flowcharts are commonly used for depicting processes and workflow. While a conventional flowchart can be a little complicated to explain in slides, you can create swimlanes in PowerPoint to make it easier for your audience to understand the diagram.
What is a Swimlane Diagram?
A swimlane diagram, also called a cross-functional flowchart, depicts a process from start to finish while categorizing it to visually distinguish departments and employees responsible for each set of actions. The difference between a regular flowchart and a swimlane diagram is that the latter makes it easier to identify responsibilities more clearly. This can help weed out inefficiencies and help improve processes.
What are the Benefits of Using Swimlane Diagrams in PowerPoint?
Enhanced Clarity
Swimlane diagrams make it easier to present complex processes by visually distinguishing responsibilities within different departments or teams. This clarity helps the audience understand who is responsible for each step of the process.
Improved Efficiency
By categorizing actions and responsibilities, swimlane diagrams can help identify inefficiencies and bottlenecks in a process. This makes it easier to streamline operations and enhance overall efficiency.
Effective Communication
Swimlane diagrams provide a structured way to communicate processes and workflows, making it simpler for team members to understand their roles and contributions.
Visual Appeal
PowerPoint allows you to format swimlane diagrams with colors, shapes, and labels, making them visually appealing and engaging for your audience.
How to Create a Swimlane Diagram in PowerPoint
Swimlanes can be arranged both vertically and horizontally. Below are a few simple steps that you can use to create a swimlane PowerPoint diagram.
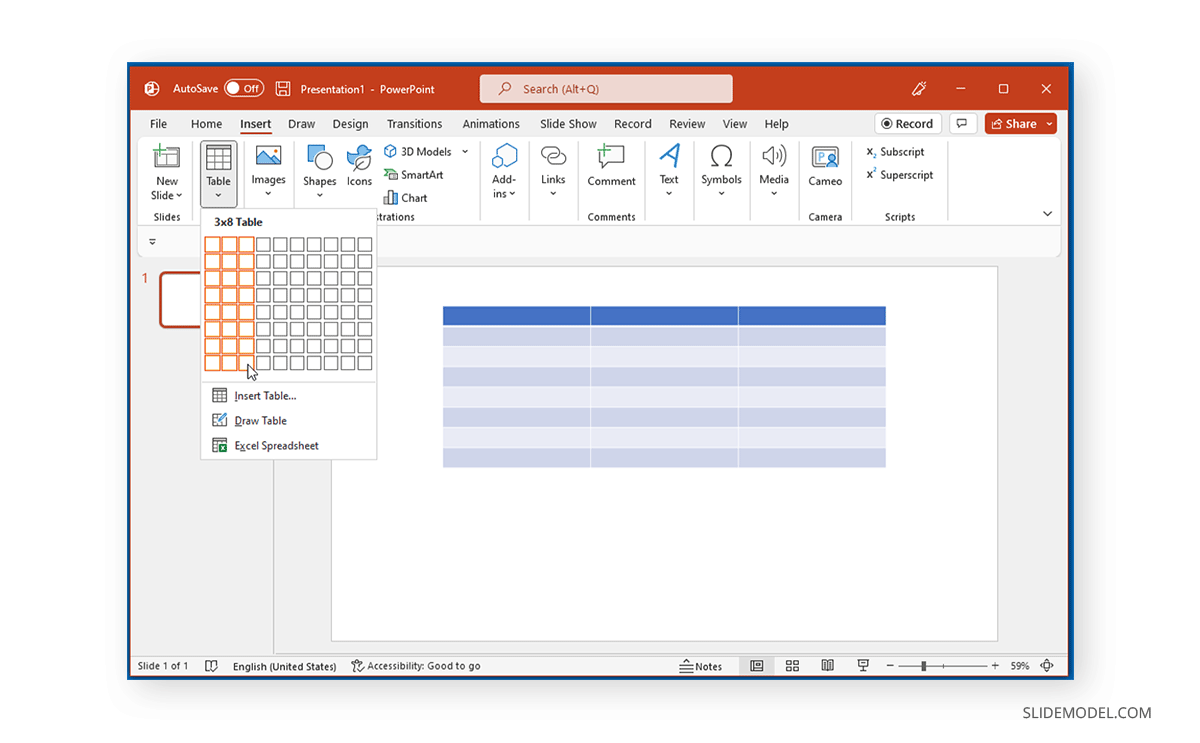
Step 1: Create a Table to Distinguish Categories
Insert a table via Insert > Table. Alternatively, you can also start with Insert > SmartArt and pick a suitable diagram to create your swimlane diagram. You can also draw a table using PowerPoint Shapes.
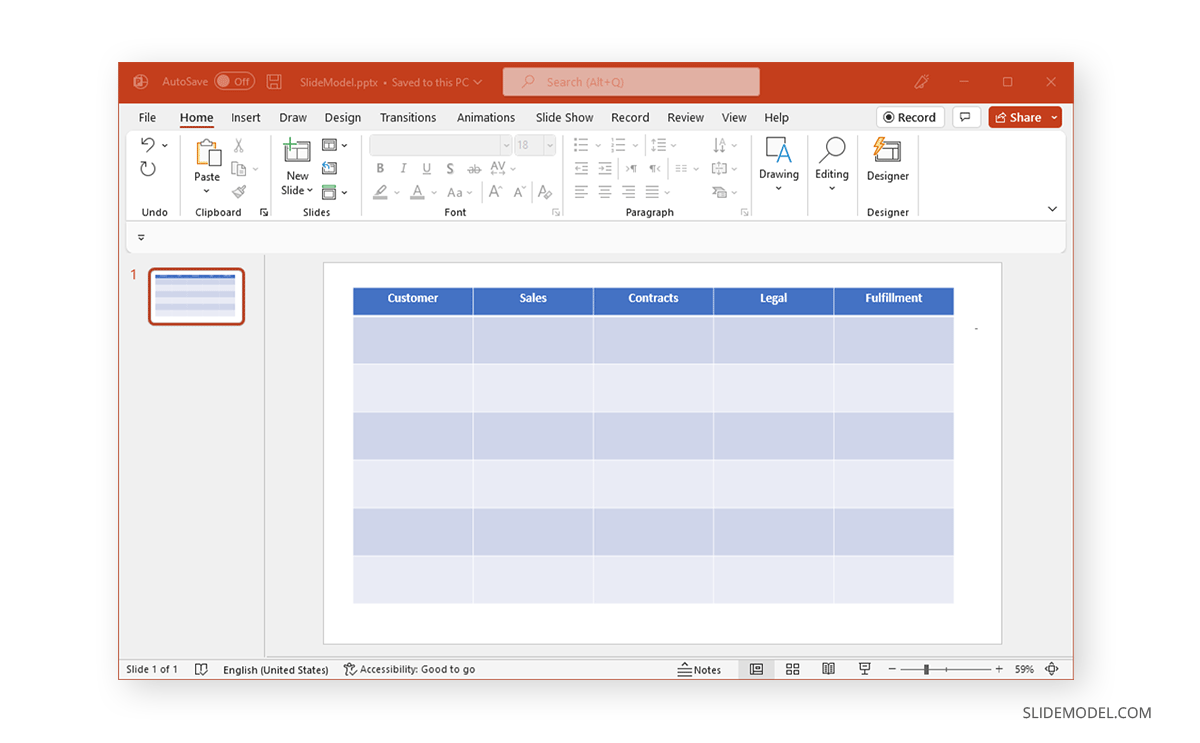
Step 2: Label Categories in the Diagram
Label the categories in the table. This will help you segregate different parts of your flowchart into categories to identify functions and responsibilities efficiently.
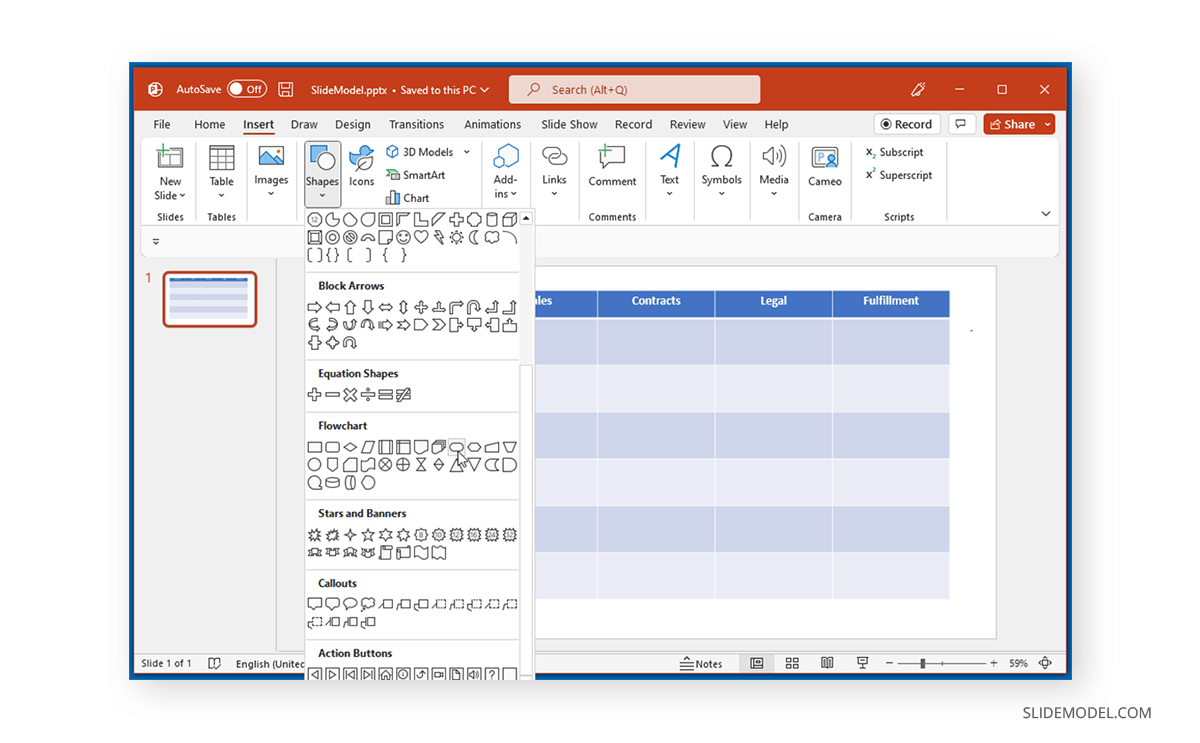
Step 3: Start Showing the Process using PowerPoint Shapes
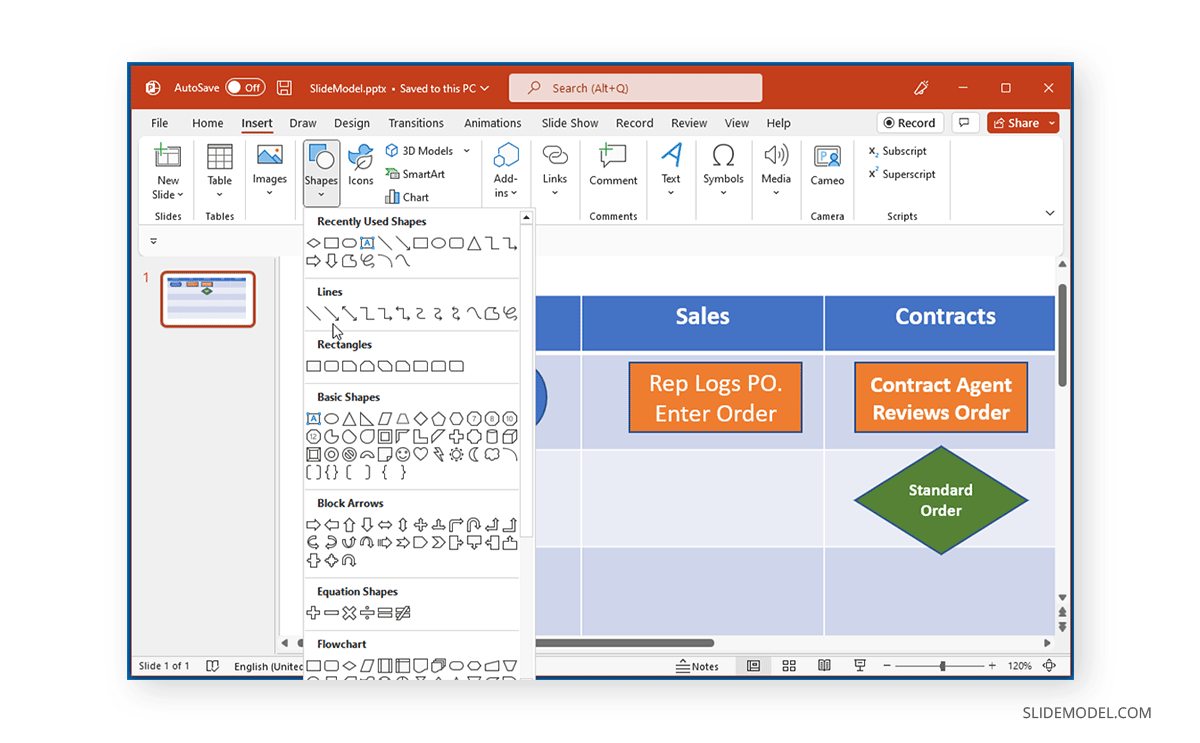
Go to Insert > Shape in PowerPoint and add flowchart shapes to build your diagram, such as a Terminal to show the start of your diagram or a Process to show a process. If you would like to learn about the various symbols used in flowcharts, see our post about how to make a flowchart.
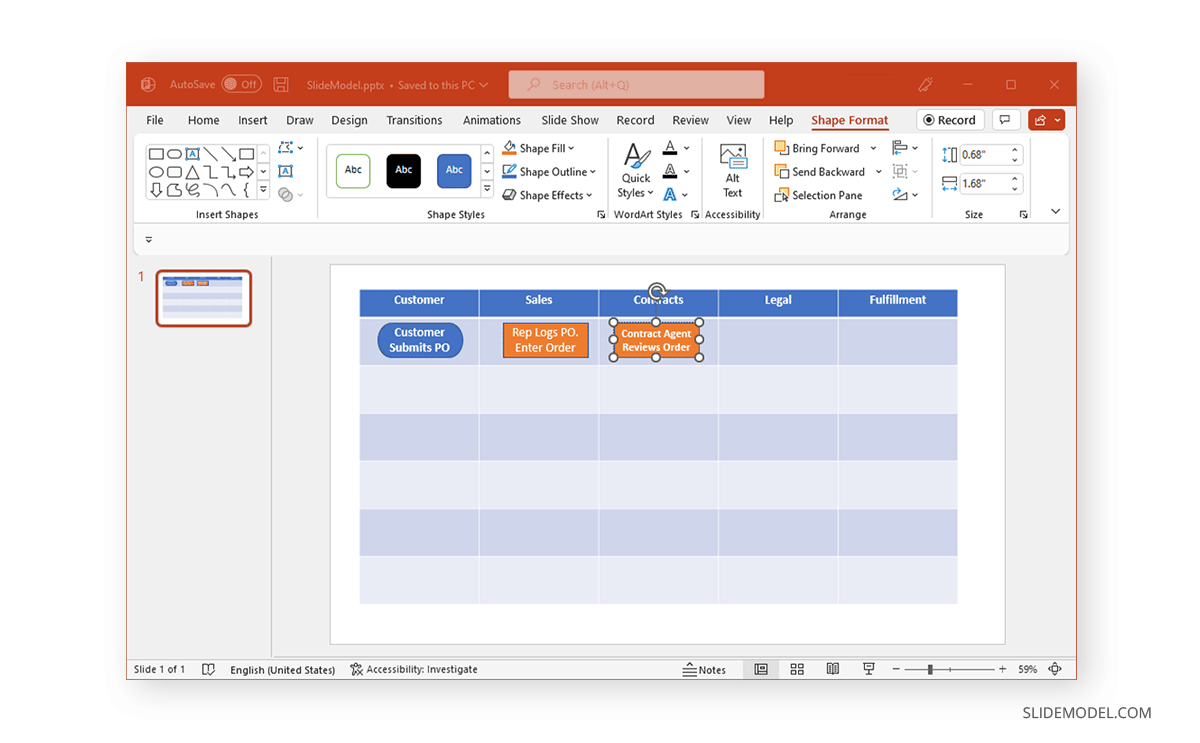
Step 4: Format Your Swimlane Diagram
Format your flowchart elements to make them easier to differentiate. Using Ribbon menu options, you can add text, change the color of your diagram objects, resize, and drag to position them according to need.
Step 5: Insert Flowlines to Indicate Steps
Insert flowlines to connect your diagram elements and indicate the steps in the process. You can add them via Insert > Shapes by selecting the line and arrow shapes.
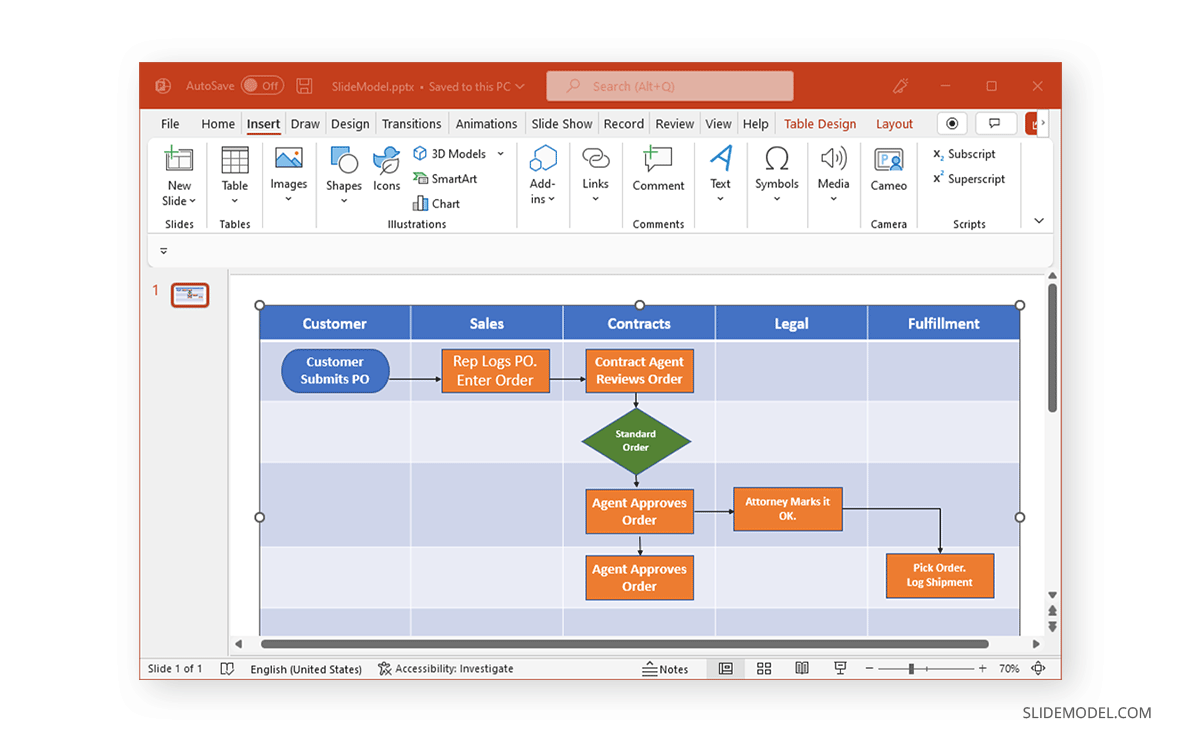
Below is an example of how you can build a swimlane diagram in PowerPoint using Shapes.
What Common Pitfalls Should I Avoid When Creating Swimlane Diagrams in PowerPoint?
- Overcomplicating: While swimlane diagrams can enhance clarity, they can also become overly complex if you try to include too much detail. Keep them focused on the key aspects of the process to prevent confusion.
- Inconsistent Formatting: Ensure that you maintain consistent formatting throughout your swimlane diagram. Inconsistent colors, shapes, or labeling can make the diagram harder to understand.
- Lack of Context: Always provide context and explanations for your swimlane diagrams. Don’t assume that your audience will immediately understand the diagram without some guidance.
- Ignoring Feedback: If you’re creating swimlane diagrams collaboratively, be open to feedback from team members. Ignoring valuable input can lead to inaccuracies or missed opportunities for improvement.
- Overlooking Templates: Creating swimlane diagrams from scratch can be time-consuming. Consider using pre-designed PowerPoint swimlane templates to save time and ensure a professional look.
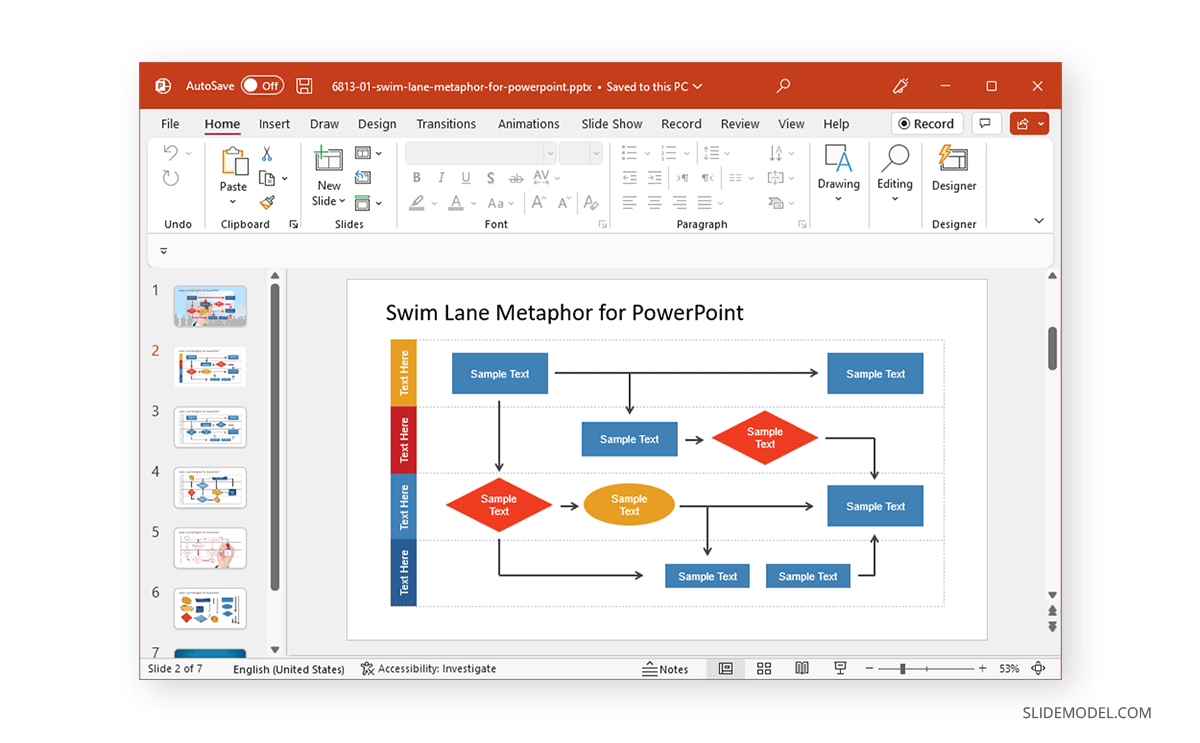
PowerPoint Swimlane Templates
While building a swimlane diagram from scratch can be difficult, using PowerPoint Templates or Google Slides Templates can help you avoid spending too much time on your diagrams. Using a PowerPoint Swimlane Template by SlideModel, you can easily edit the professionally designed layouts to create presentations with swimlane diagrams.
Swimlane diagrams can help depict business processes that involve multiple departments. Making it easier to identify not only the process but delays, inefficiencies, and places where deceitful practices are likely to occur. Unlike conventional flowcharts, swimlane diagrams are easier to read and present. However, making a PowerPoint Swimlane Template can be just what you need to make the most out of your diagram without wasting hours perfecting it.
Frequently Asked Questions (FAQs) About Inserting Swimlanes in PowerPoint
Can I use swimlane diagrams for any type of process or workflow?
Swimlane diagrams are versatile and can be used for various processes and workflows, especially those involving multiple departments or teams. However, it’s essential to ensure that using a swimlane diagram adds value and clarity to your specific presentation.
How do I ensure that my swimlane diagram is understandable to my audience?
To ensure understanding, provide context by explaining the diagram’s purpose and the meaning of each category and shape. Use clear labeling and maintain consistent formatting throughout the diagram.
Can I animate swimlane diagrams in PowerPoint to show the flow of the process?
Yes, you can add animations to swimlane diagrams in PowerPoint to show the flow of the process step by step. This can be helpful for emphasizing specific points during your presentation.
Are there any specific guidelines for choosing between vertical and horizontal swimlane diagrams?
The choice between vertical and horizontal swimlane diagrams depends on the layout that best suits your content and presentation style. Vertical swimlanes may work better for certain processes, while horizontal swimlanes may be more suitable for others. Consider your audience’s perspective and the flow of the process when making this choice.