Animated PowerPoint Charts Collection Template
The Animated PowerPoint Charts Collection Template is suitable to present business data. It is an elaborated presentation template containing data-driven chart slides for PowerPoint. The 18-slide charts PPT template is a fantastic slide template useful to promote a company’s products and services. It is a professional tool to compare relevant business information like the finances, resources, time quality management, etc. The professionals at the management level can use the charts and graphs as a part of their performance dashboard presentations. Every slide has a distinct layout of the process flowchart templates. They show the distribution of two or more variables per template. The PowerPoint chart templates are visually present facts. It ensures an impressive illustration of helpful information. At the same time, it shows the link between two or more components in one glance.
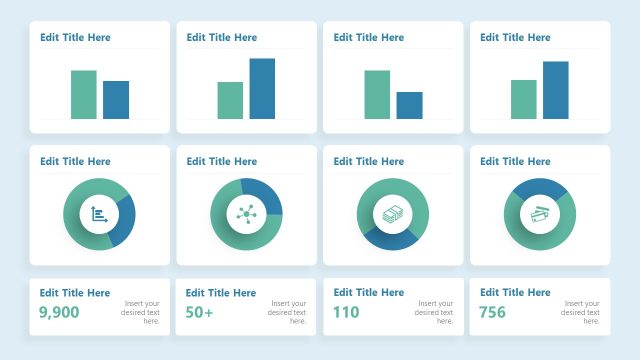
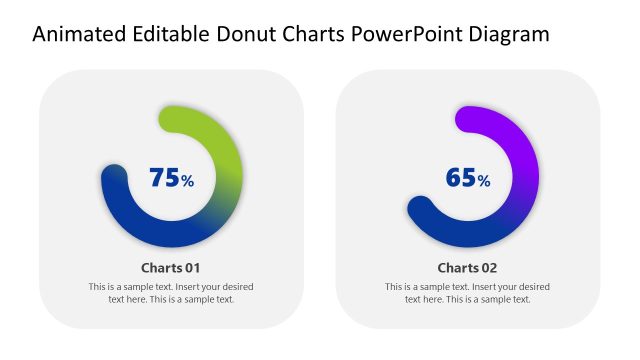
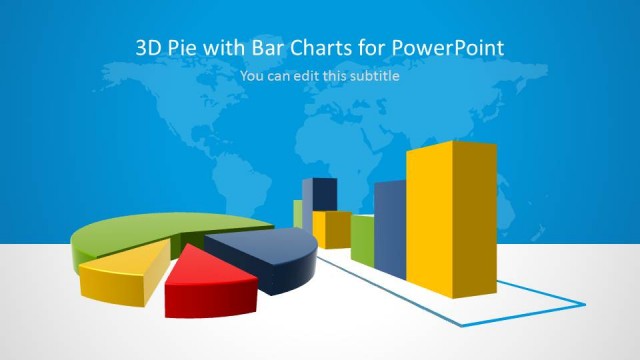
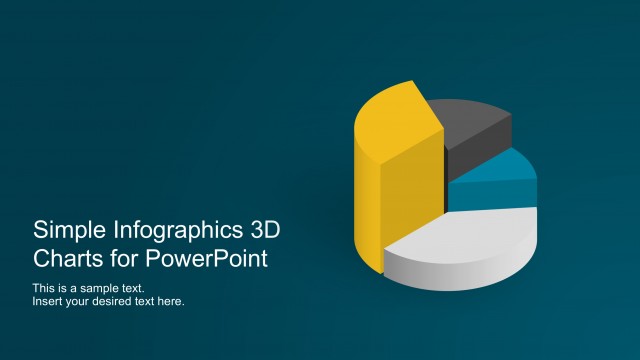
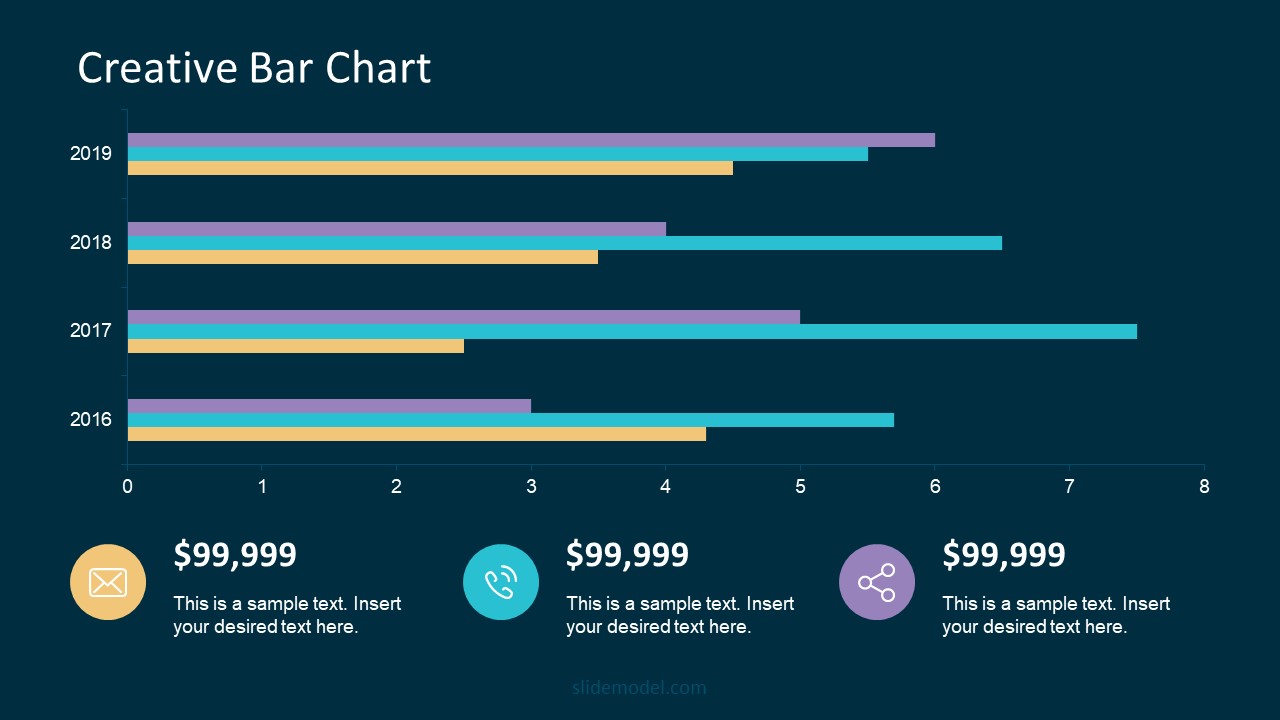
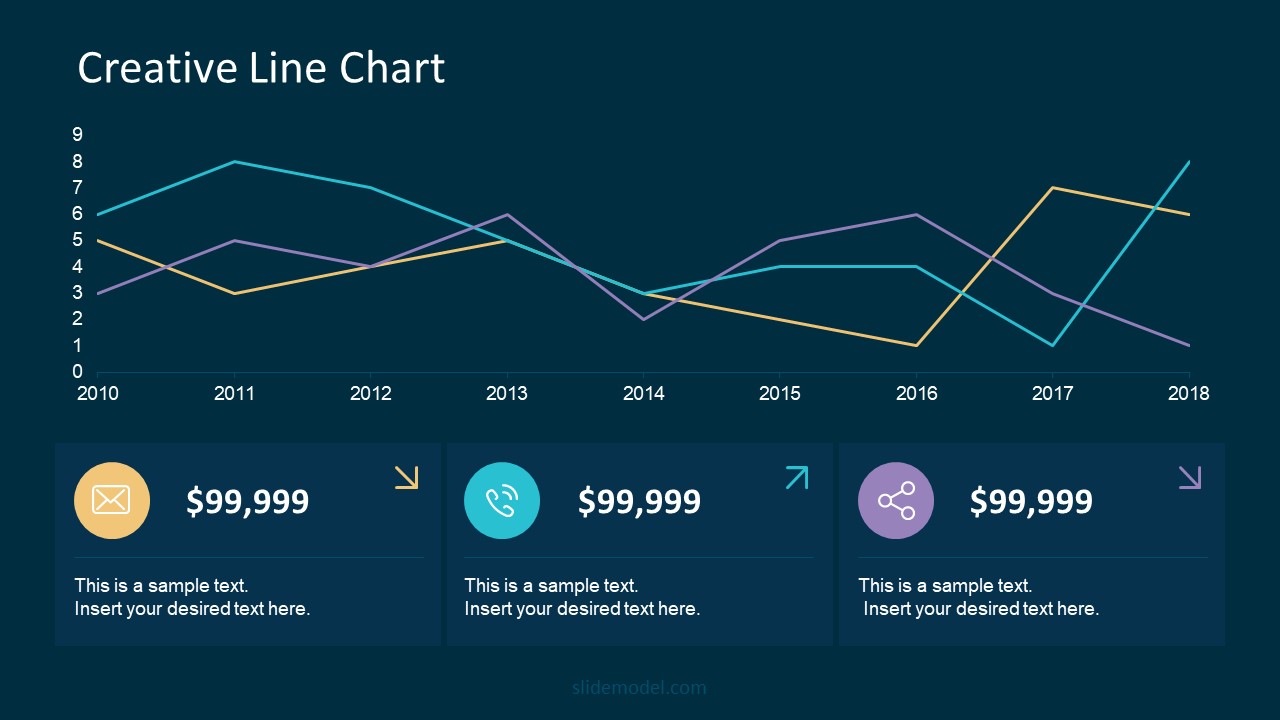
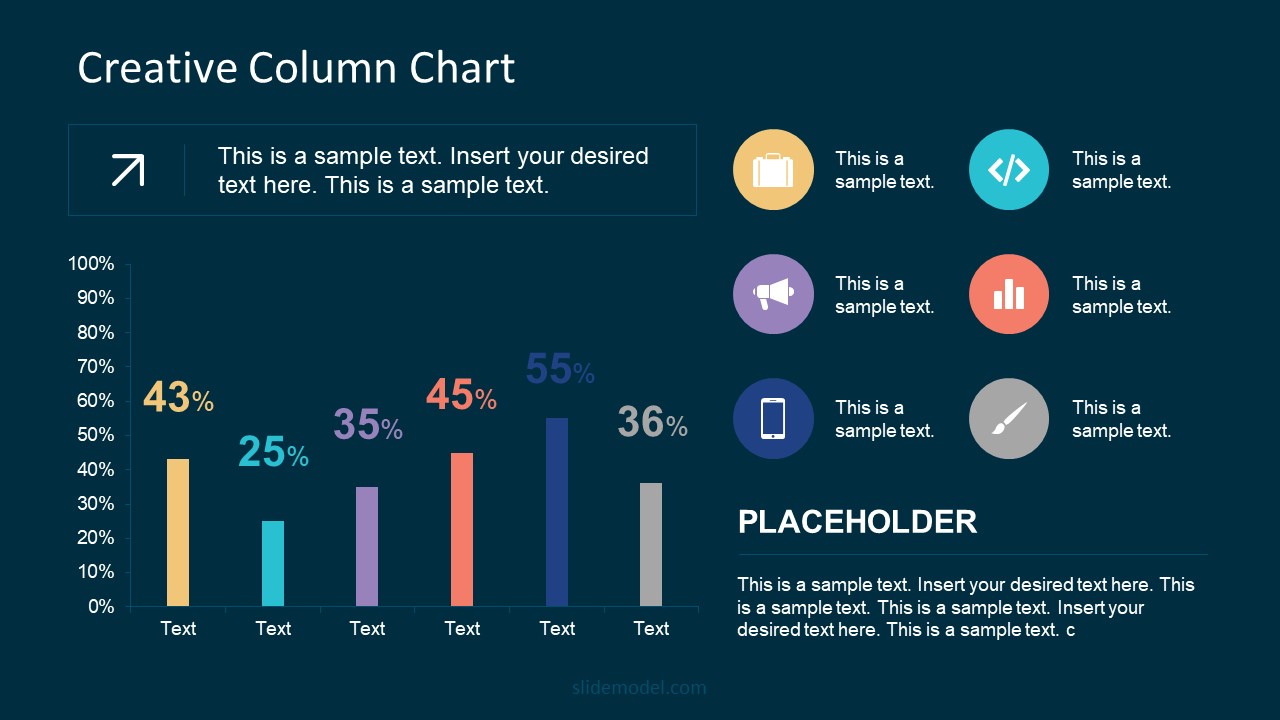
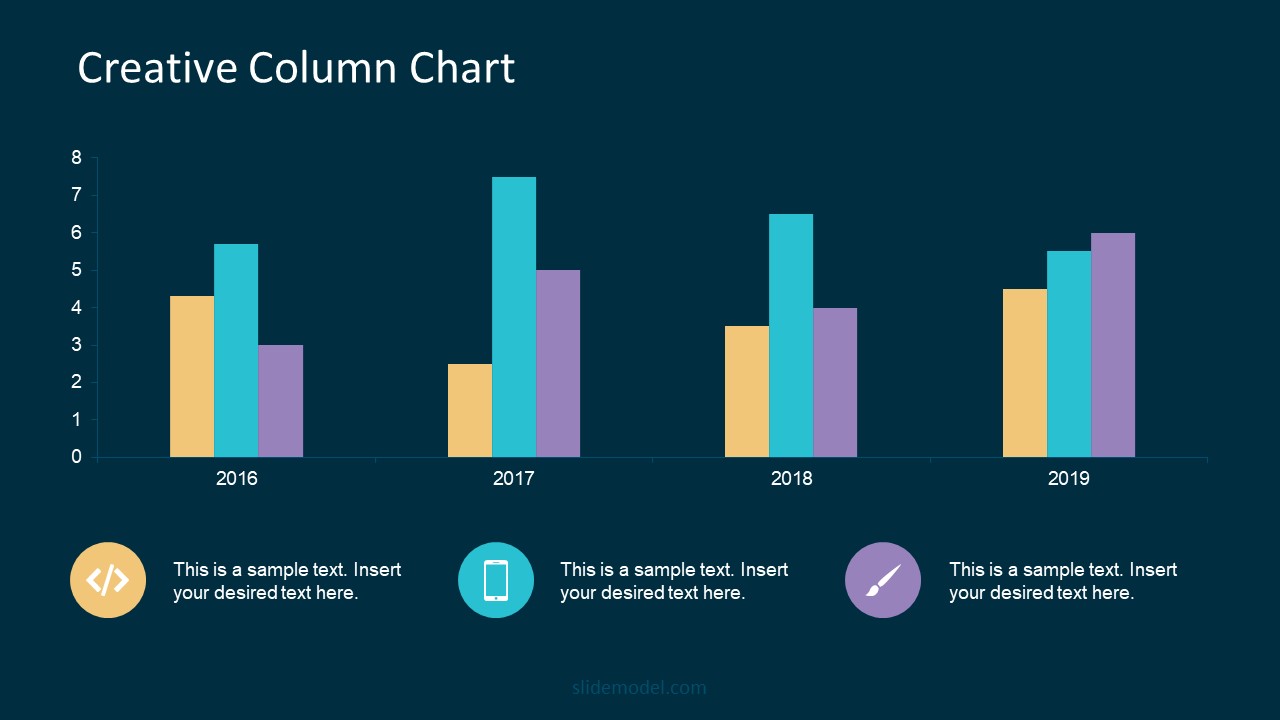
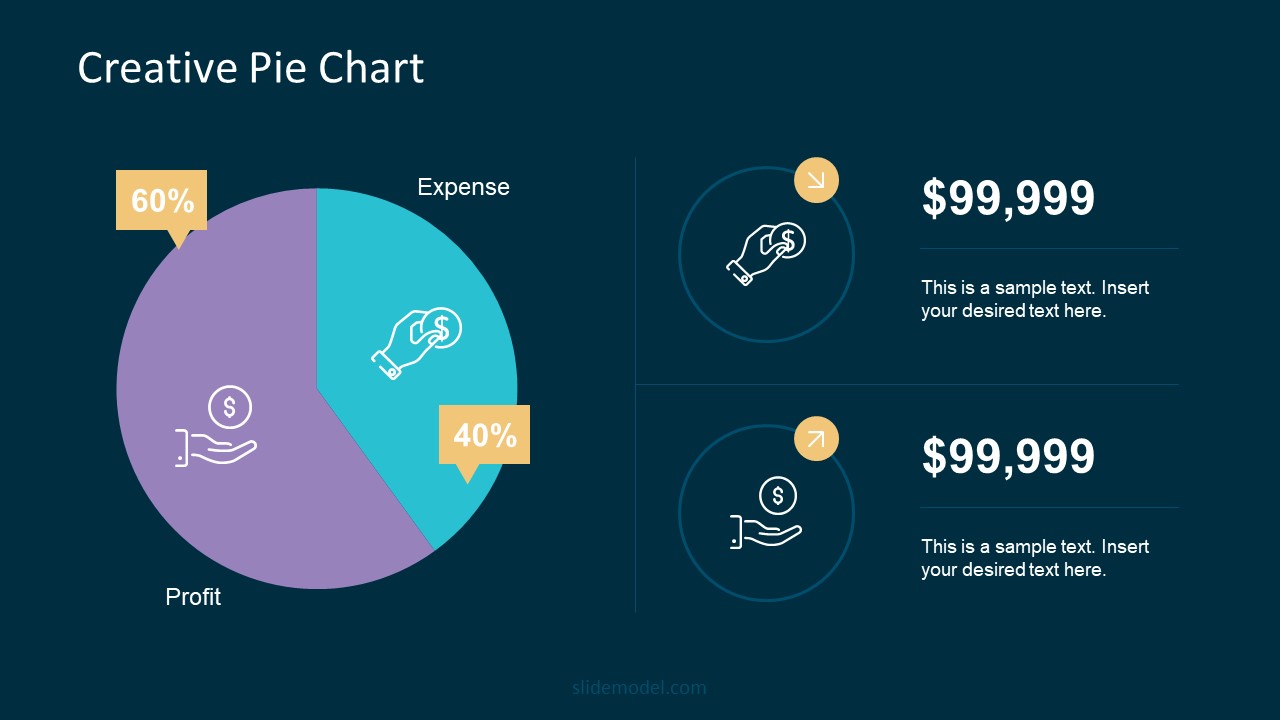
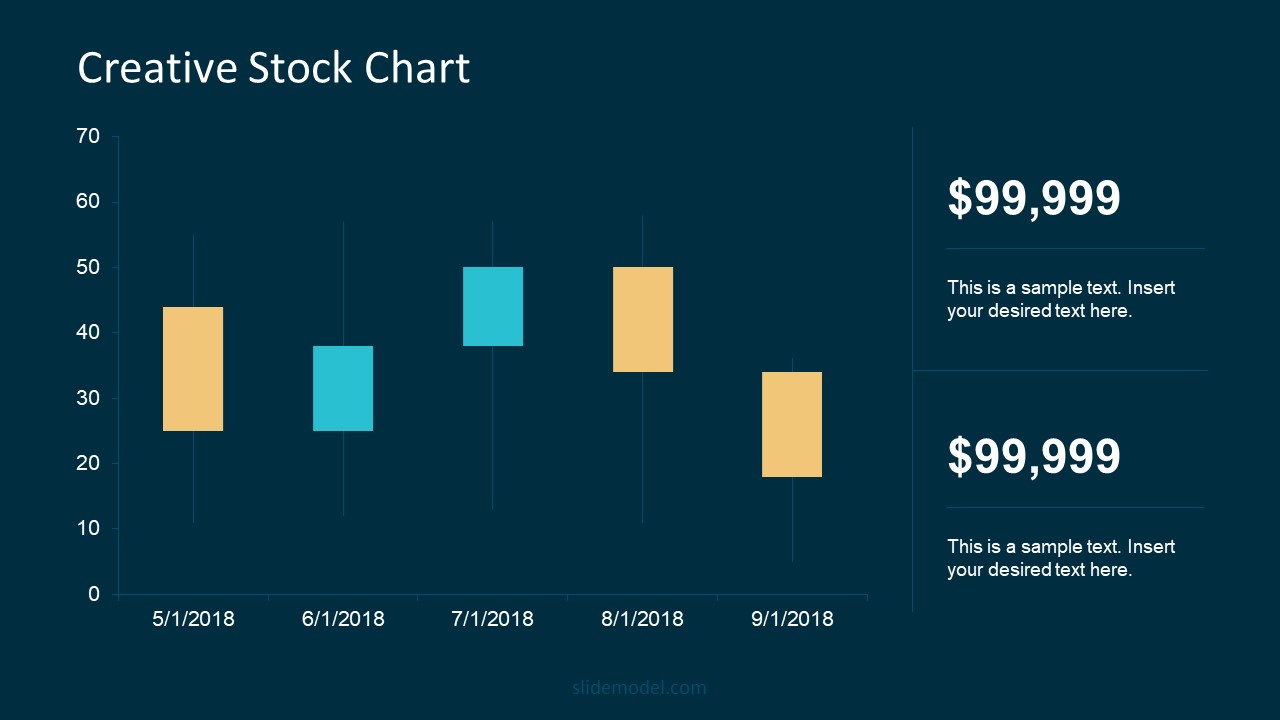
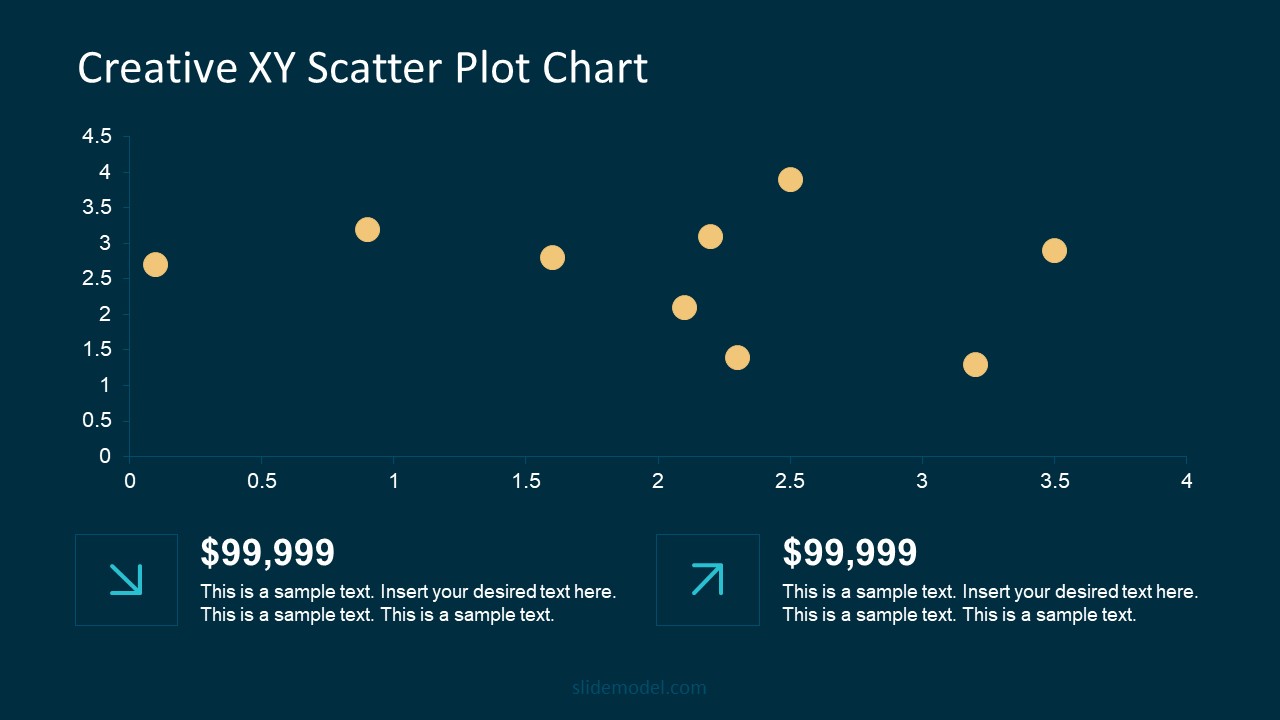
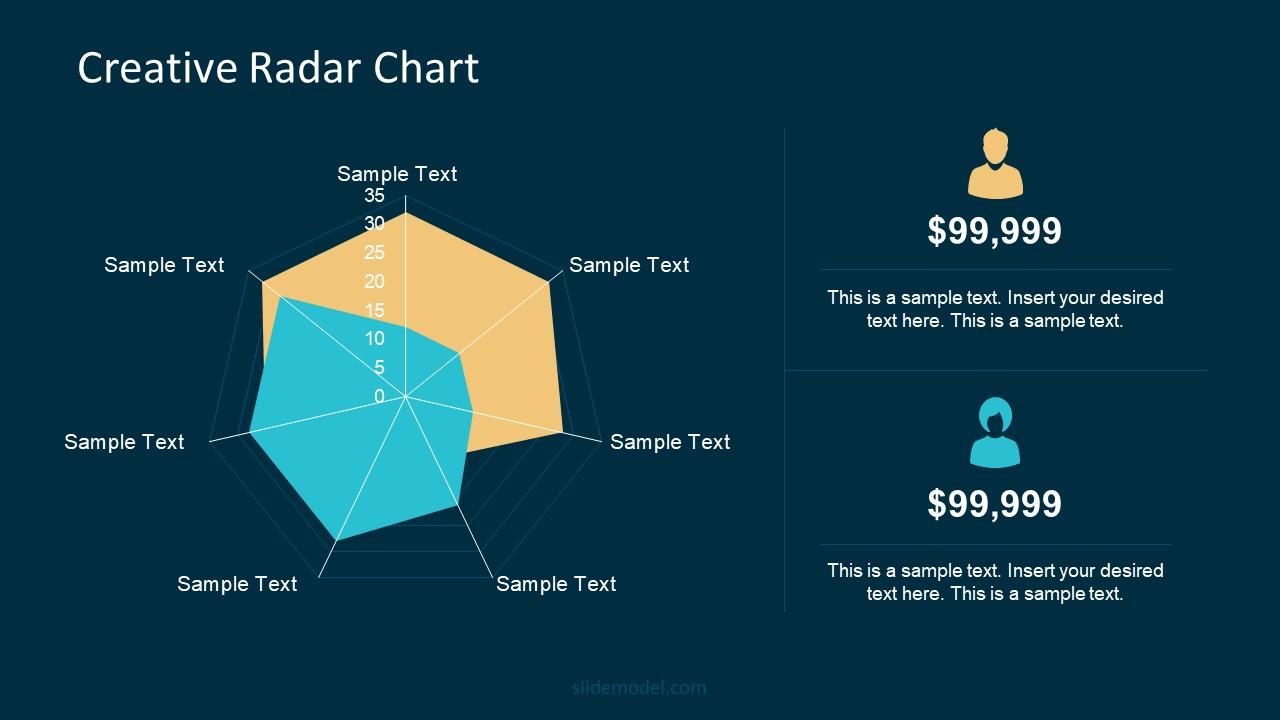
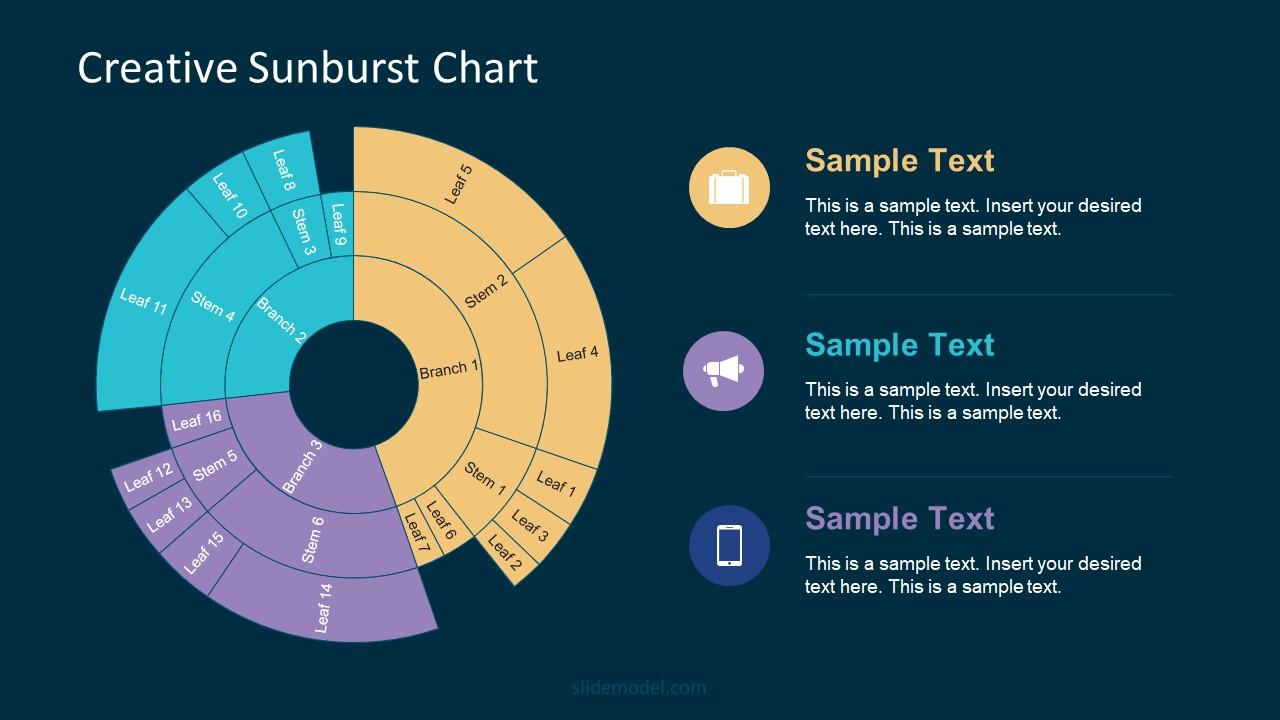
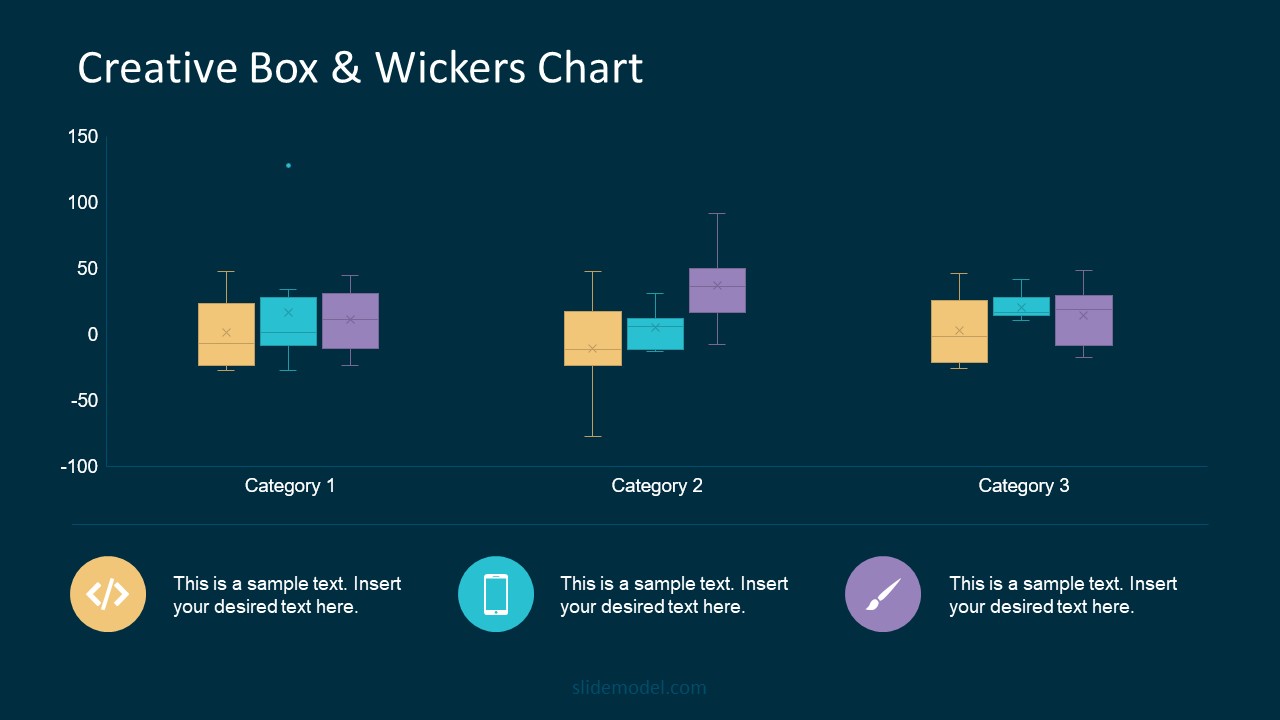
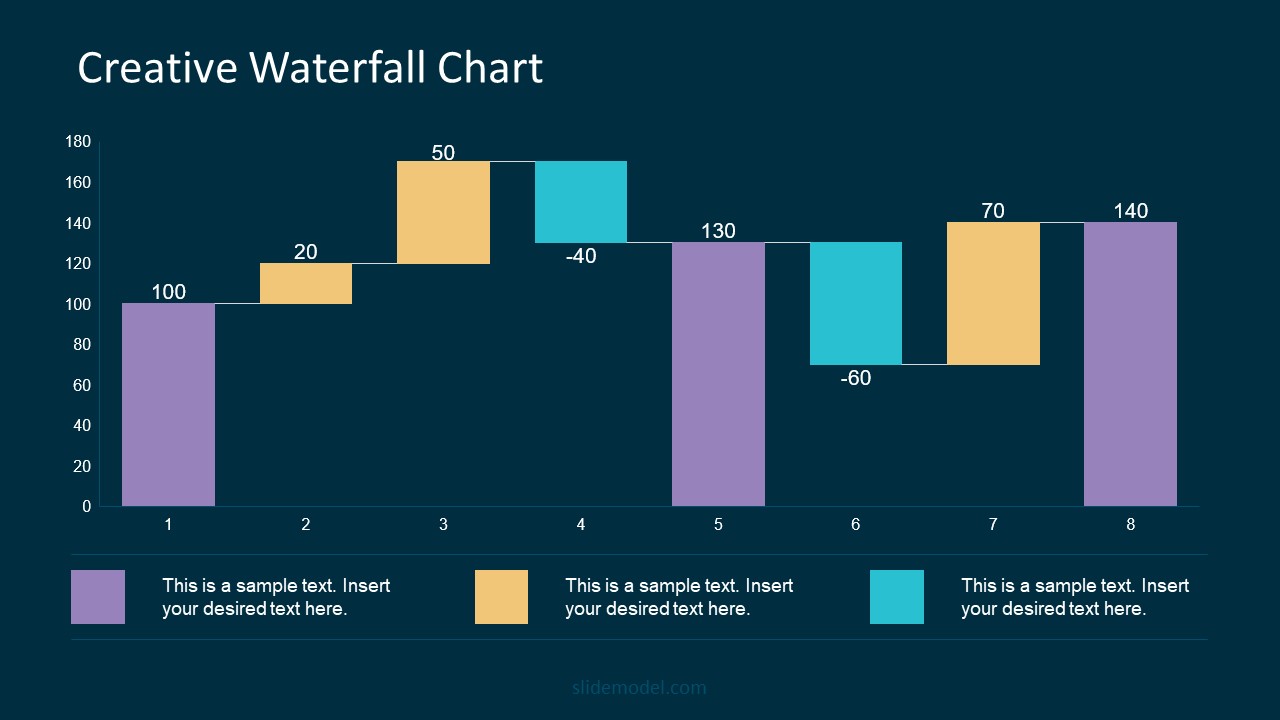
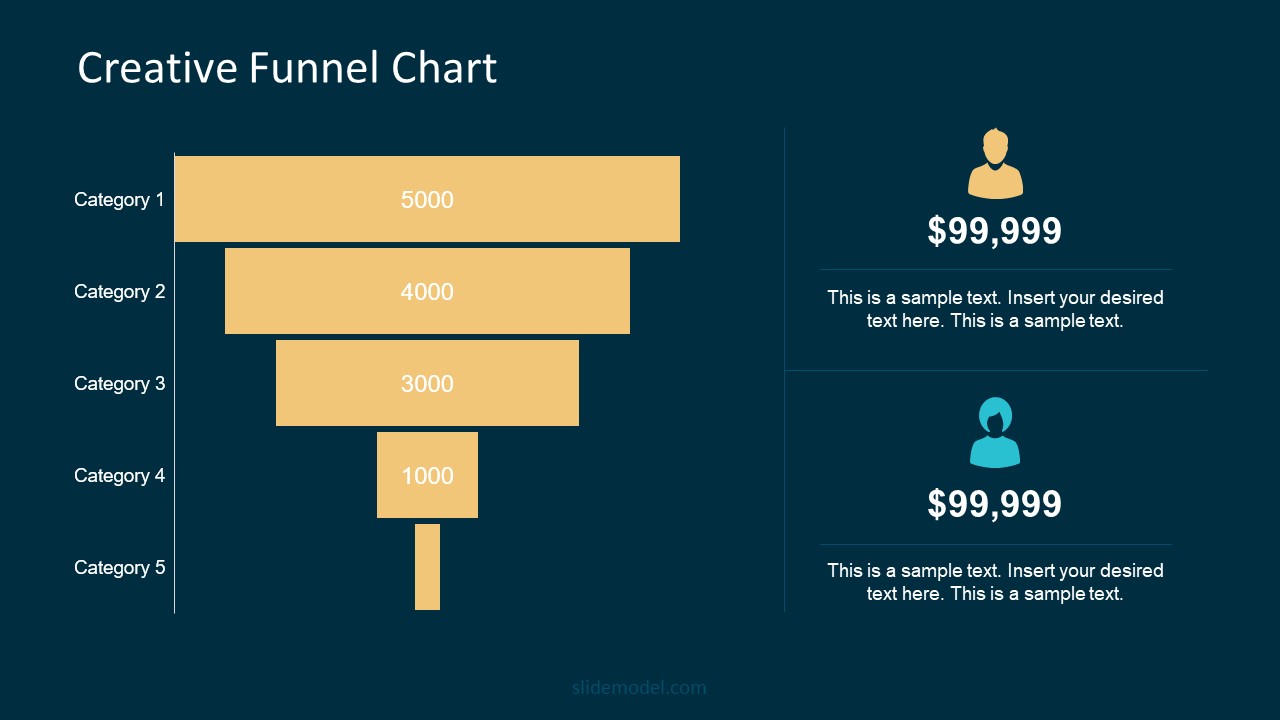
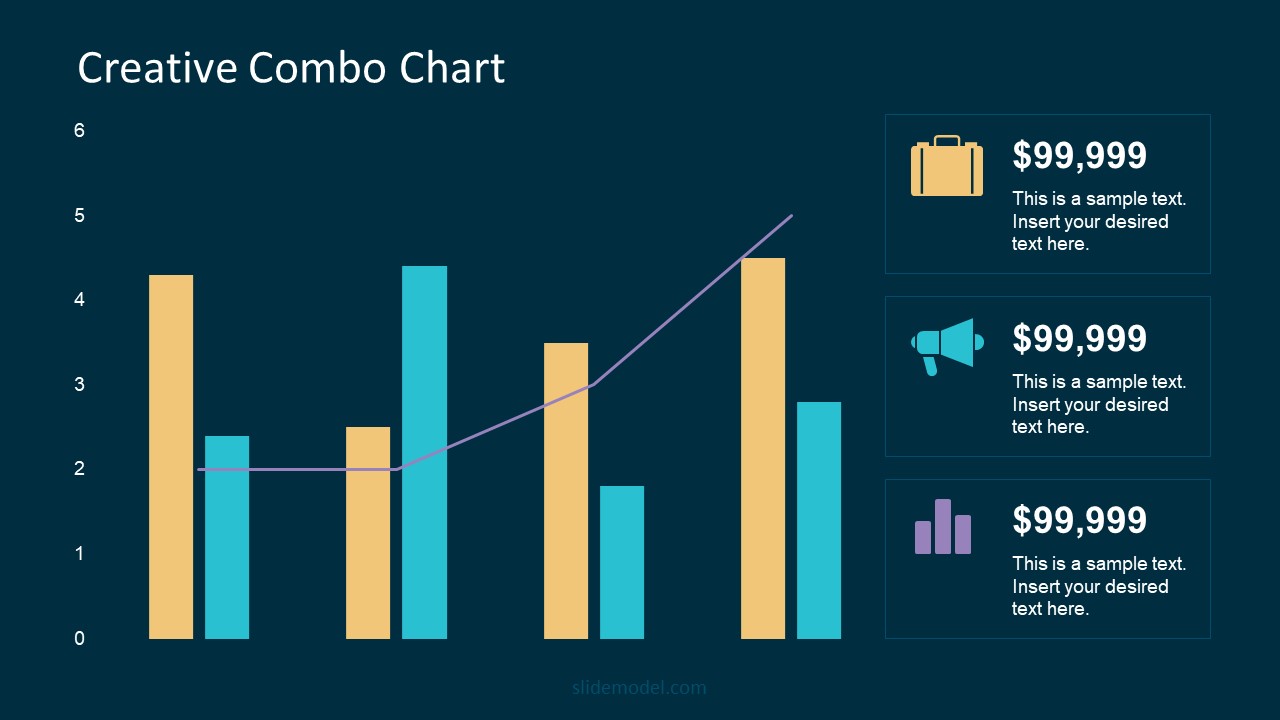
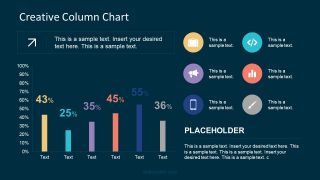
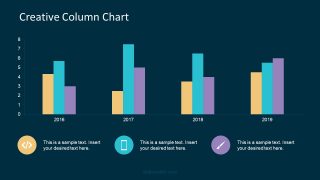
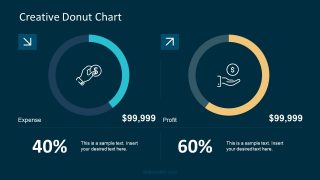
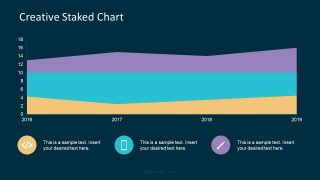
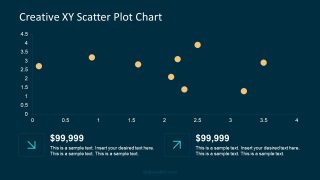
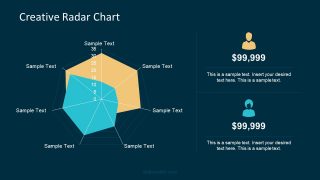
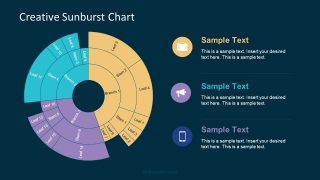
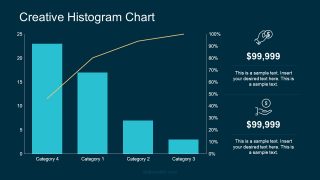
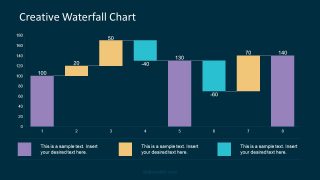
The Animated PowerPoint Charts Collection Template assists the users in presenting streams of data values. Special data-driven charts for PowerPoint assist the users in entering the values in a spreadsheet. They can also make changes in the spreadsheet as and when required, and the graphs automatically update. The animated PowerPoint charts collection shows various versions of multiple and single bars, lines, and stacked graphs. Moreover, it contains different combinations of pie, doughnut, radar, XY scatter, sunburst, waterfall, and funnel.
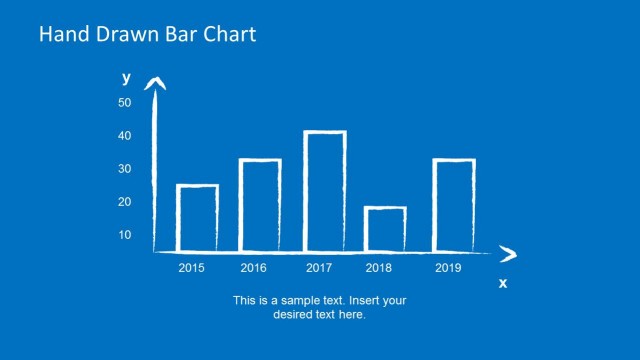
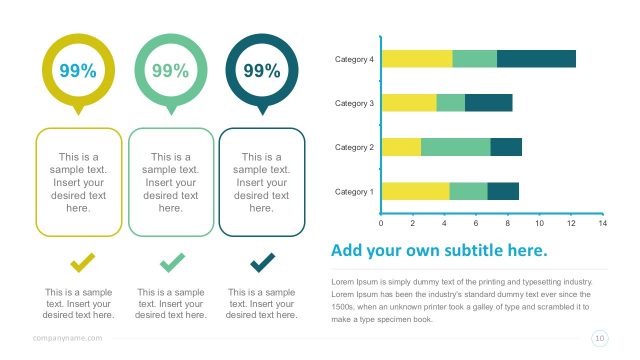
This collection various versions of Bar Charts, Line Charts, and Stacked Charts, as well as other powerful visual tools like Pie Charts, Donut Charts, Radar Charts, XY Scatter Plots, Sunburst Charts, Waterfall Charts, and Funnel Charts in PowerPoint.
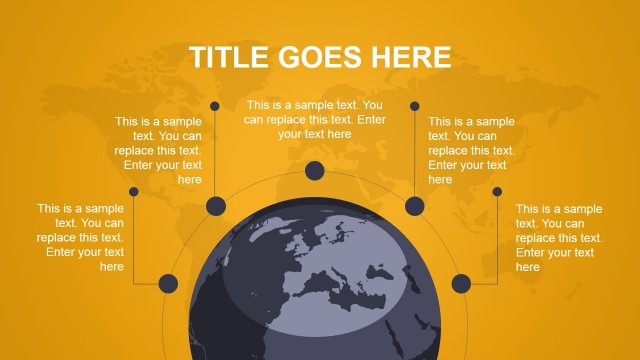
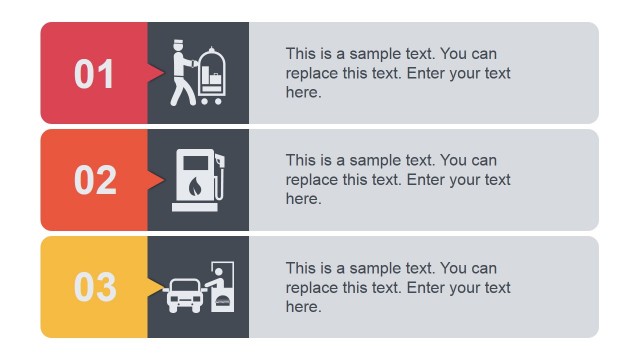
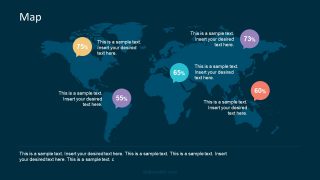
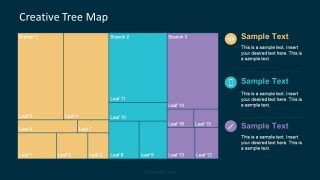
The animated chart in PowerPoint has few more business presentation slides. Such as the world map and creative tree diagram layout. All the slides provide clipart icons to represent the variables for charts in PowerPoint. It is a quite handy tool to show the number of work-related statistics. Like explaining the improvement in performance and coordination of employees. Demonstrating the reduced levels of risk involved in the project. Or, simply show the potential consumer market analysis on the map. The users can customize the chart designs from its tool menu bar. The feature allows changing the colors, size, transparency, patterns and much more. For more information, we have created an article about data presentations.


You must be logged in to download this file.
DOWNLOAD- Category
- Data & Charts
- Rating


 Loading...
- Size
- 16x9
- Item ID
- 7747-01
- Colors
Subscribe today and get immediate
access to download our PowerPoint templates.