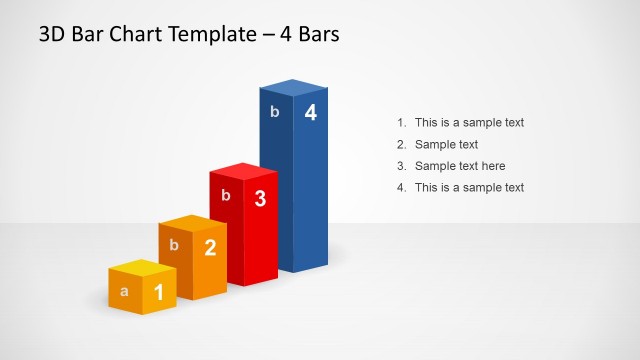
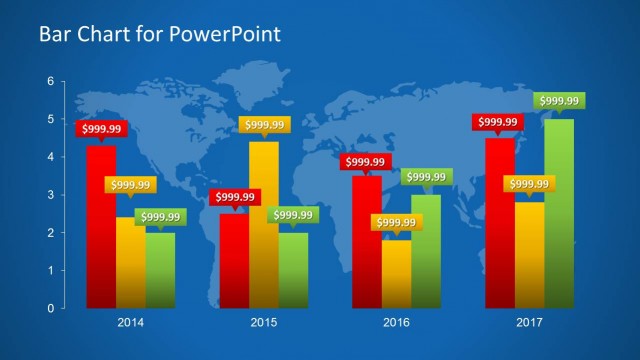
3D Growth Bar Chart for PowerPoint is a template drafted for financial development presentations. Designed with bars and dollar sign, it is a stunning visual aid that can effectively capture the attention of global audiences. This way, important details of the presentation will be easy to recall.
Financial development is very much related to business concepts. It means that there is growth and progress in a company. A bar chart can capture this quantitative data to a photographic report. These records are taken through a period of time. The financial aspect can refer to marketing improvements or profit that the business achieves every year. Showing the values through this PowerPoint template can allow the user to analyze the data deeper. Patterns and lapses that cannot be seen on flat records can emerge in the chart.
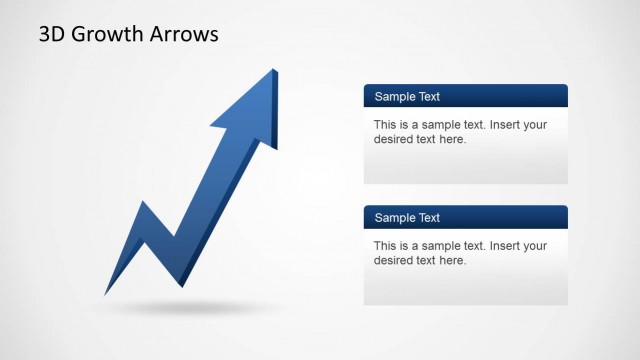
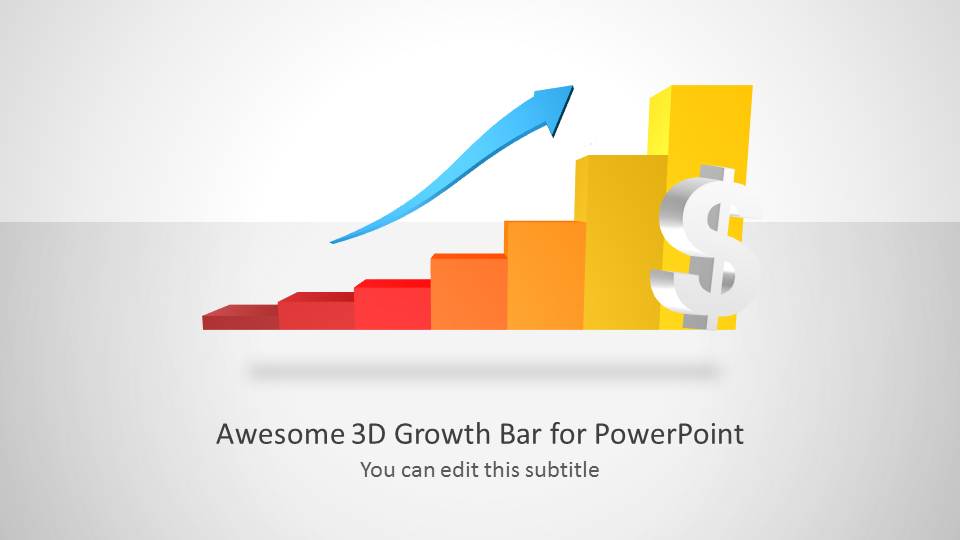
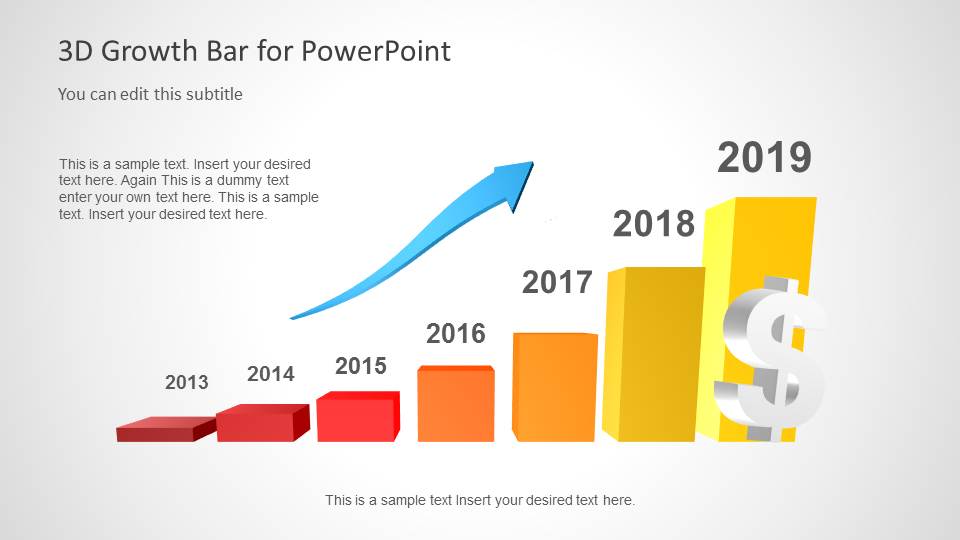
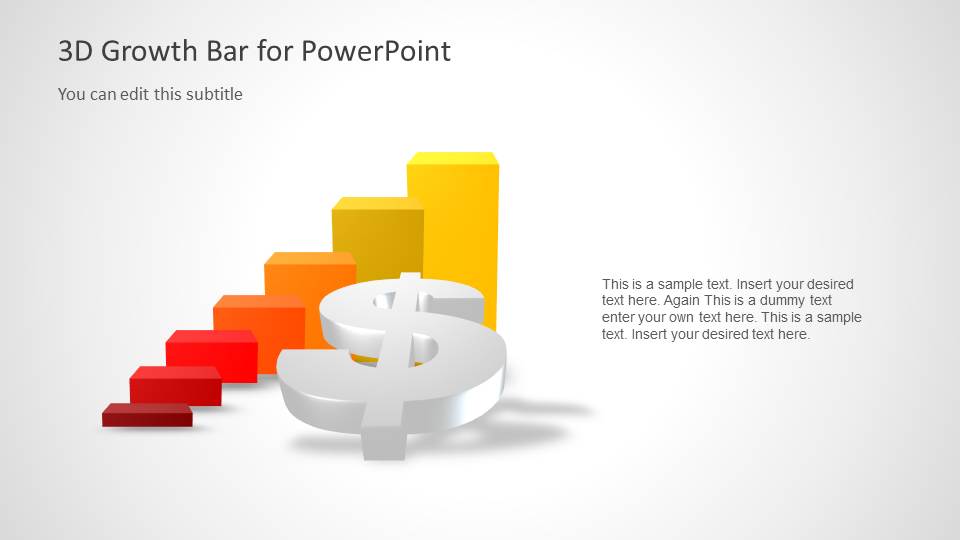
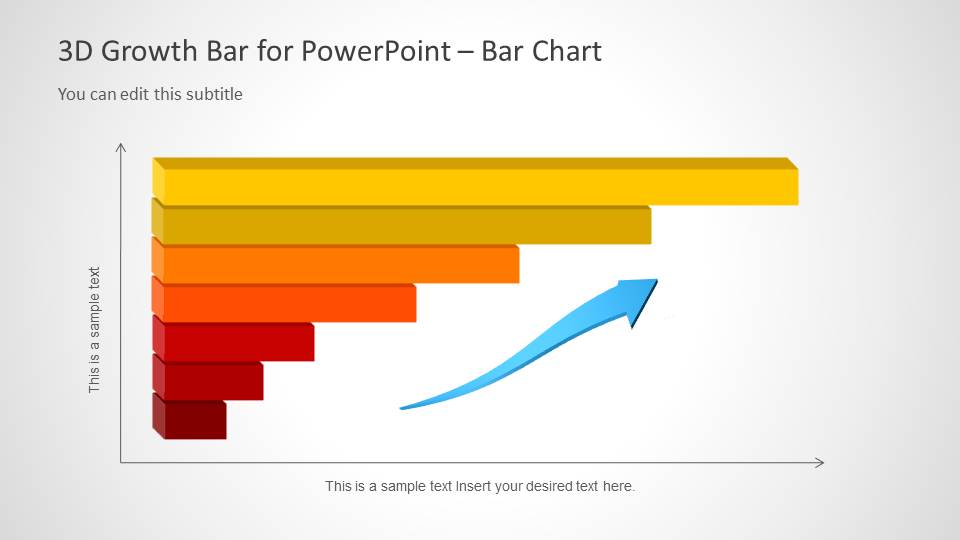
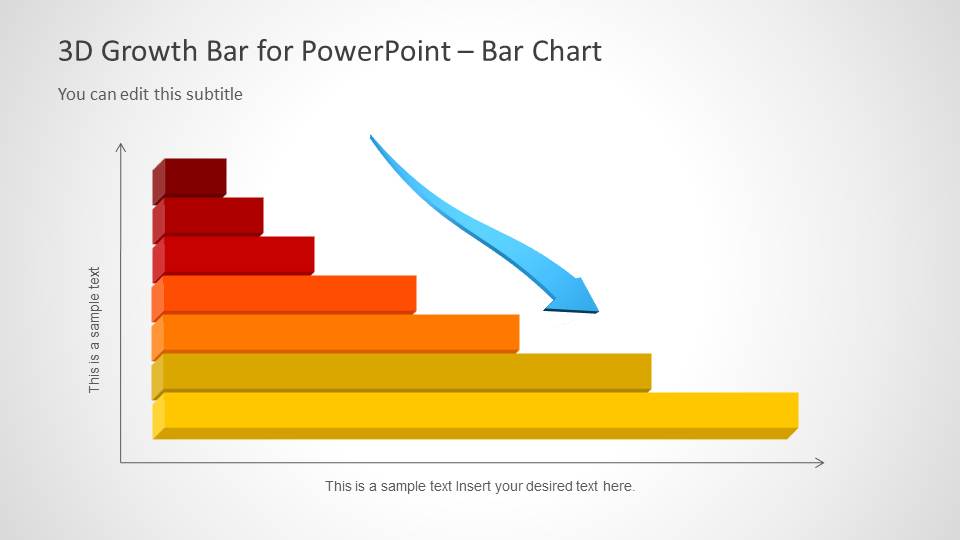
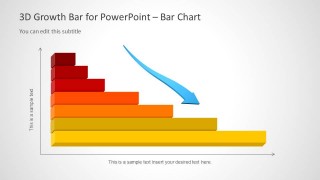
Some slides include an arrow that points at the direction of the progress. The PowerPoint object makes it is easier to identify whether the chart has a descending or ascending order. The dollar sign in the first 4 slides illustrate the involvement of money. The slide designs also feature a static title area. The user can always use this part to bullet important points. This bar graph template enables the presenter to have minimal text on the PowerPoint. Using the PowerPoint shapes menu, the user can quickly modify the shapes. Colors are fully customisable as well to suit the needs of the report.
This PowerPoint template is ideal for sales and marketing presentations. It has a flexible design so the user can personalize it to fit any business-related or financial concept. It is a modern touch to any professional setting.
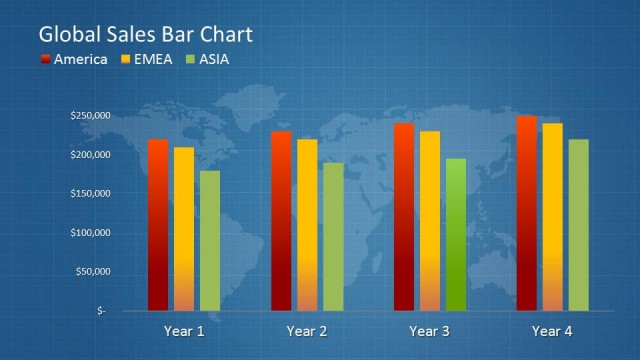
Advance through fancy visuals and meaningful layout of 3D Growth Bar Chart for PowerPoint. Global Sales Bar Chart Template for PowerPoint is another awesome design downloadable at the SlideModel gallery.
What’s inside this template
Example presentation scenarios
- A finance manager can present revenue growth over time using the year-labeled bar chart with the dollar symbol and upward arrow.
- A sales leader can compare territory or product performance with the horizontal ranked bar charts and explain which categories are leading or lagging.
- A marketing manager can summarize campaign improvement using the upswing trend chart with ascending columns and brief supporting text.
- An executive presenter can open a quarterly review with the cover slide and then shift to the perspective dollar-sign chart to frame financial progress.
Features
- 100% editable presentation template
- Compatible with Microsoft PowerPoint and Google Slides
- Scalable vector shapes, icons and illustrations
- AI-Ready for Microsoft Copilot and Claude
- Instant access and download
Frequently asked questions
Q: How should a presenter explain financial growth without letting the 3D bars distort the message?
A: Use the 3D bars to introduce direction and relative scale, then state the key takeaway in the title or subtitle. Avoid overcrowding the bars with detailed labels. If values matter, add a short text note beside the chart so the audience understands both the visual trend and the business meaning.
Q: Who is this template best suited for in a business review?
A: This template fits presenters who need to communicate financial momentum quickly, such as finance managers, sales leaders, marketing managers, or executives. The growth bars, dollar symbols, and arrows are strongest when the meeting goal is to show progress, ranking, or performance direction rather than a full analytical dashboard.
Q: Why use dollar symbols and arrows with bar charts instead of plain columns?
A: The dollar symbol makes the financial context immediate, while the arrows signal the direction of performance before the audience reads the supporting text. This visual metaphor works well for executive updates because it reduces interpretation time and turns a basic bar chart into a clear growth or decline statement.




3D Growth Bar Chart for PowerPoint
6-slide presentation template with 3D growth bar charts, dollar symbols, and trend arrows
3D Growth Bar Chart for PowerPoint is a 6-slide financial growth presentation template built around 3D bar chart visuals. It includes a cover, year-by-year growth chart, perspective dollar-sign chart, upswing trend chart, and horizontal bar comparisons for sales, finance, marketing, and executive reporting.


 Loading...
 Microsoft PowerPoint
  Microsoft Copilot
  Claude for PowerPoint
 Other formats supported
Subscribe today and get immediate
access to download our PowerPoint templates.