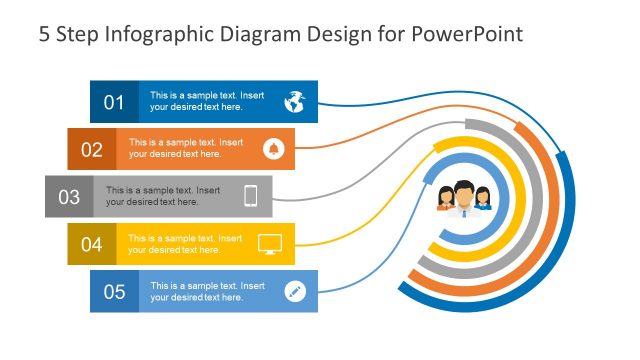
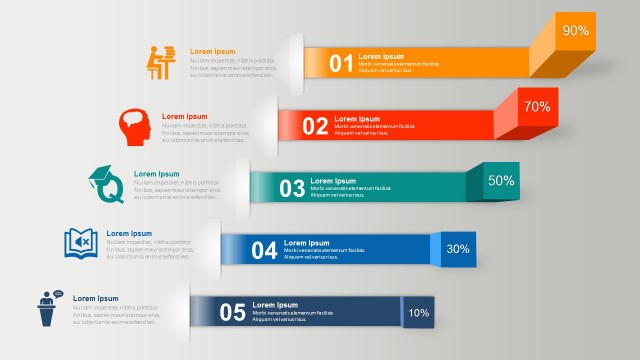
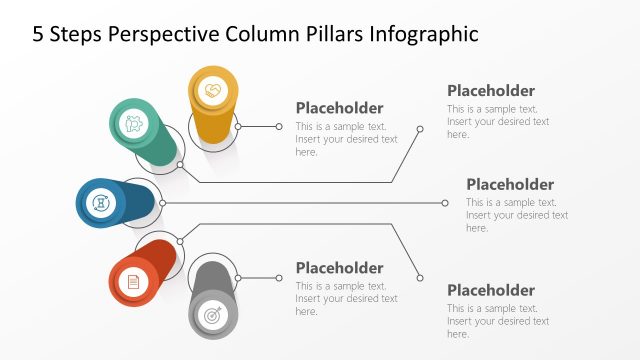
5 Columns Infographics PowerPoint Diagram
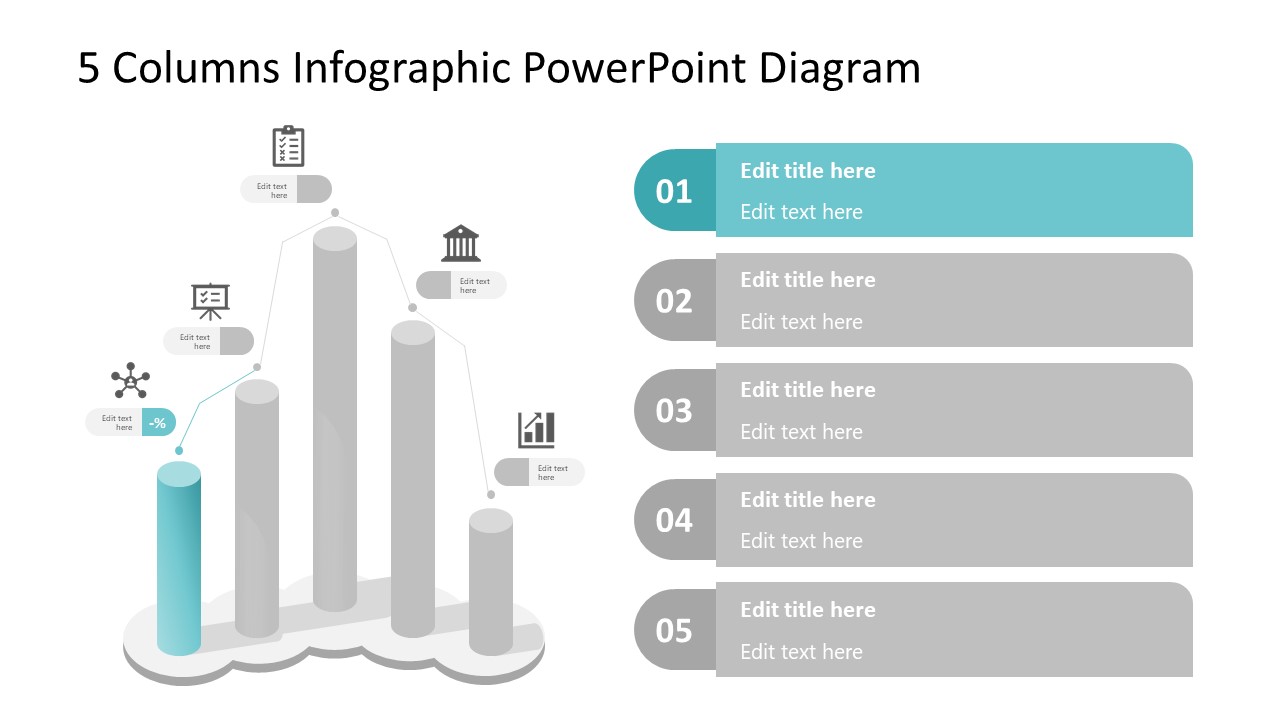
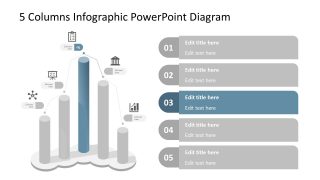
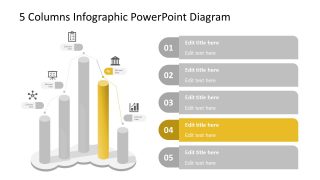
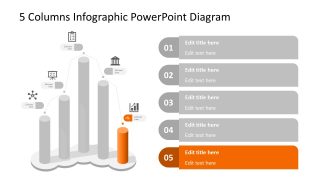
The 5 Columns Infographics PowerPoint Diagram is a creative template to present data values. It is a 3D bar chart template containing five tube-shaped columns. Each bar represents the range of attributes to measure an element. Take an example of product performance review, the five columns of infographic diagram can display the rating of product features. Each column of the infographic PowerPoint diagram contains clipart icons for a visual representation of data. The icons include star hub, slideshow, checklist, building, and trend chart. These graphics give visual meaning to the contents of the presentation that audience can remember more easily.
This bar chart template is designed to draw the audience’s attention towards data reports. The eye-catching graphics and colorful bars give a professional look and feel to the template. The bar charts are used in business presentations to compare different data groups or track the changes over time. You can use an infographic template to display KIPs of growth data in internal meetings. However, the multipurpose PowerPoint diagram template can present several ideas like customer segmentation, rankings, social statistics, and research reports.
5 Column Infographics PowerPoint Diagram consists of six slides. All slides have a bar chart template and bullet points section to describe textual content about each data group. The 4 additional slides of infographic diagram are useful for detailed presentations. If you have to discuss the changes in the product sales, use 3D bar chart template that communicates each point effectively.
The bar chart template in PowerPoint is an editable diagram of flat shapes. It provides flexibility for users to change colors, size, and the icons of diagram in a matter of minutes. The users can also change presentation theme from the design menu or change the background of the diagram. Also, check our article about data presentations.


You must be logged in to download this file.
DOWNLOAD- Category
- Diagrams
- Rating


 Loading...
- Size
- 16x9
- Item ID
- 40100-04
- Colors
Subscribe today and get immediate
access to download our PowerPoint templates.