Financial Chart Slides PowerPoint Template
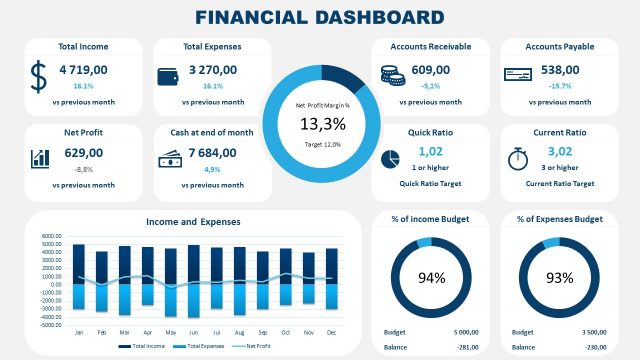
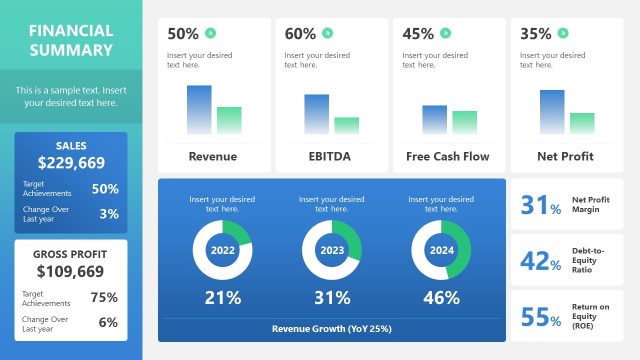
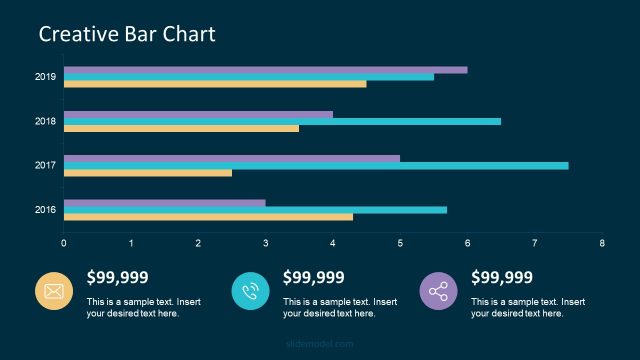
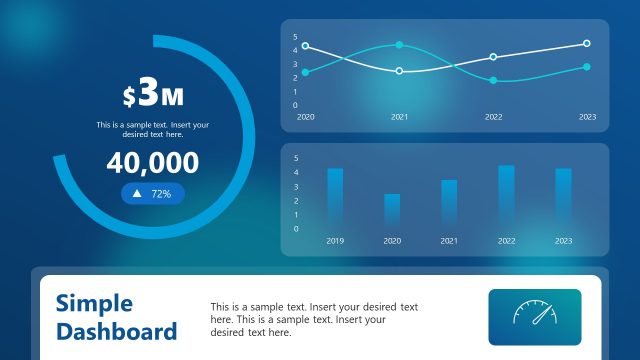
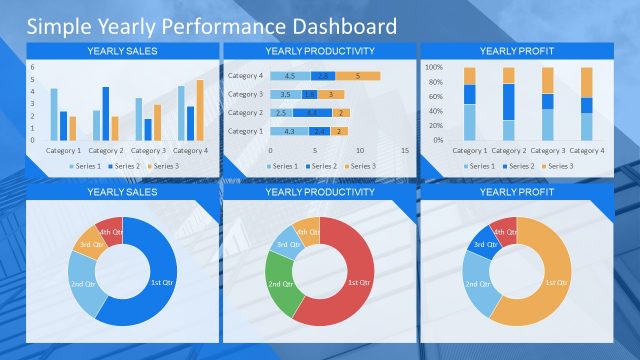
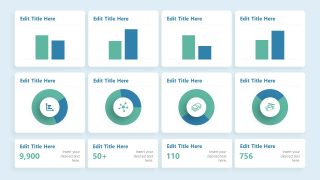
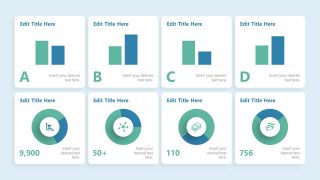
The Financial Chart Slides PowerPoint Template presents dashboard-styled financial performance slides. These are Data-driven PowerPoint templates charts use for reporting KPIs and data analysis. The slides include sets of four bar charts and donut charts financial PowerPoint templates. Bar chart presentation templates help compare values of two events such as profits from the previous and current year. The donut chart presentation templates PPT on the other hand show proportion such as rates and ratios. You can customize these sets of financial charts to present trends of four variables. Alternatively, use financial charts to analyze performance over time using creative timeline templates.
Financial data analysis is crucial to business success. It enables businesses to see trends of cost and relationships among variables such as budgets, expenses, liquidity, cash flow, and profits. The financial charts visualize these trends and help track various business and financial metrics. Financial reports in the form of data charts aid in explaining complex reports.
The Financial Chart Slides PowerPoint Template displays financial data to shareholders and executives for decision making. In fiscal year reporting, the presentation templates of financial charts summarize the company’s financial activities over the year. The financial charts in PowerPoint templates illustrate trends and relationships among variables in an engaging manner. The financial chart best PPT presentation templates help users to prepare a professional presentation using engaging data charts and discuss numbers.
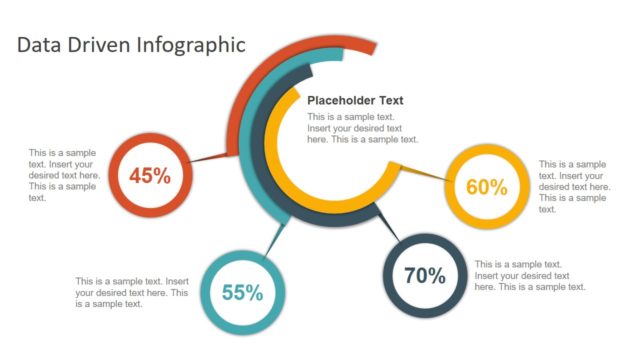
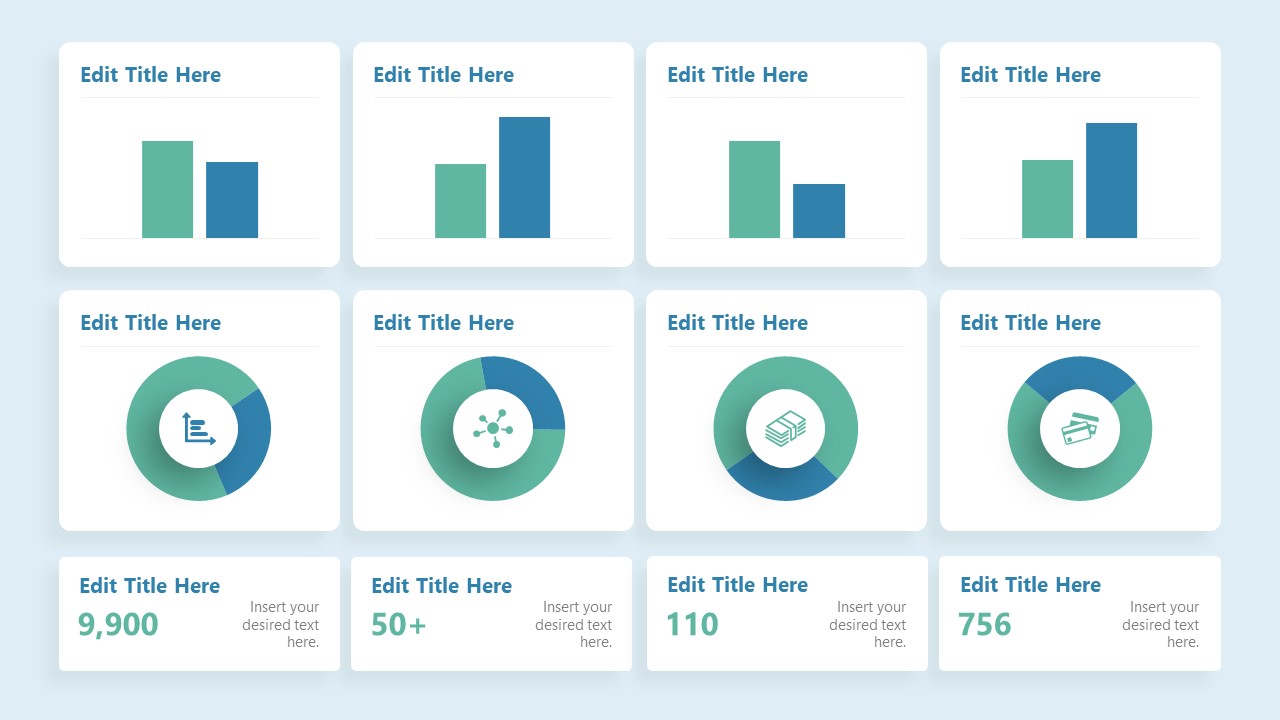
The data sets in data-driven finance PowerPoint templates are easy to edit on a spreadsheet. The other components of presentation such as colors, shapes, and PowerPoint themes can be tailored to user’s preferences. The modern data driven chart templates are quick to use and reuse for financial analysis presentations or in presentation dashboards created in PowerPoint. Business and finance icons in business presentation templates PowerPoint make data presentations more engaging for the audience. The editable PowerPoint templates of data charts are easy to modify by formatting custom charts. You can change the number of variables and modify styles from the formatting menu.
Alternatively, you can download other financial slides for presentations, and include them in pitch deck or investor presentations.

You must be logged in to download this file.
DOWNLOAD- Category
- Data & Charts
- Rating

 Loading...
- Size
- 16x9
- Item ID
- 20889-01
- Colors
Subscribe today and get immediate
access to download our PowerPoint templates.