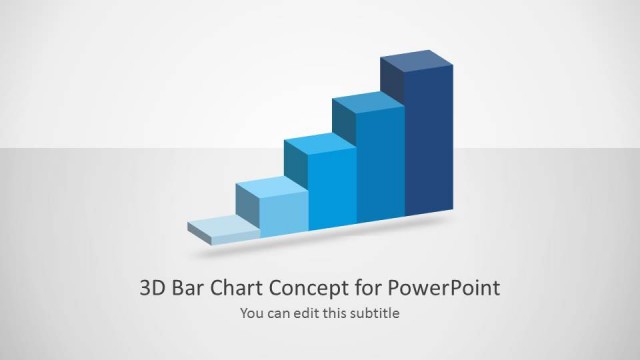
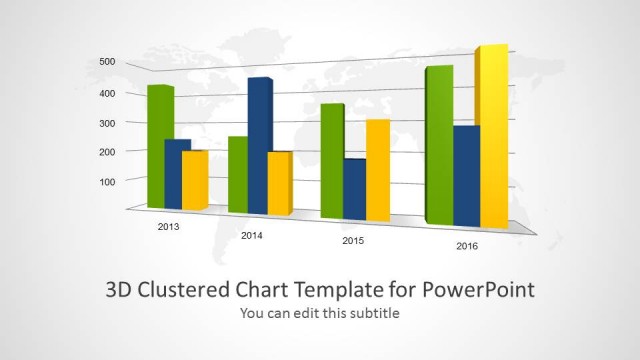
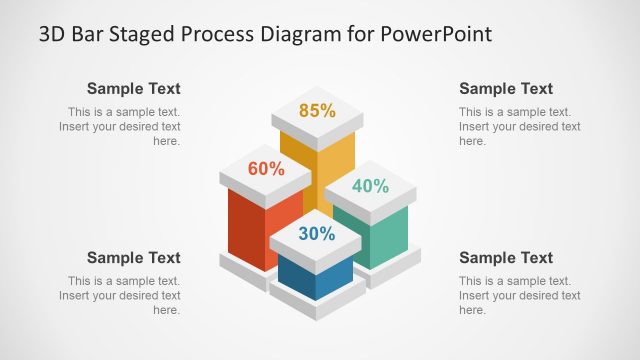
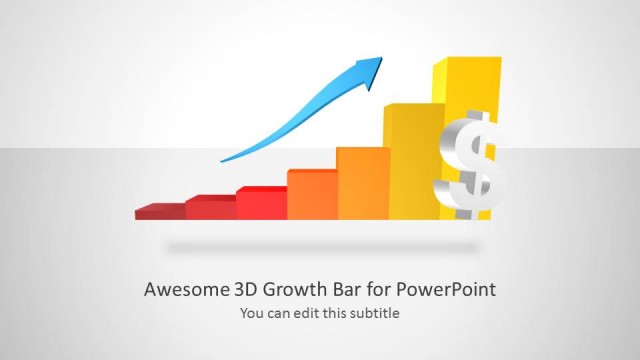
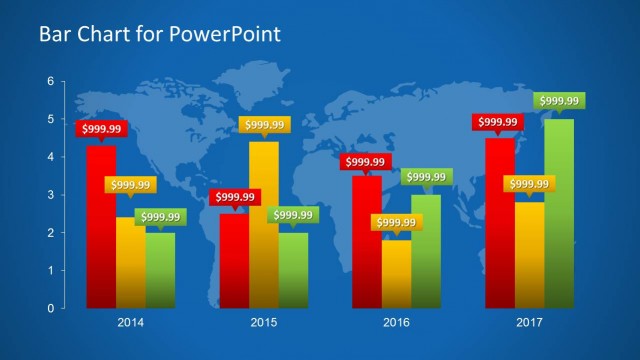
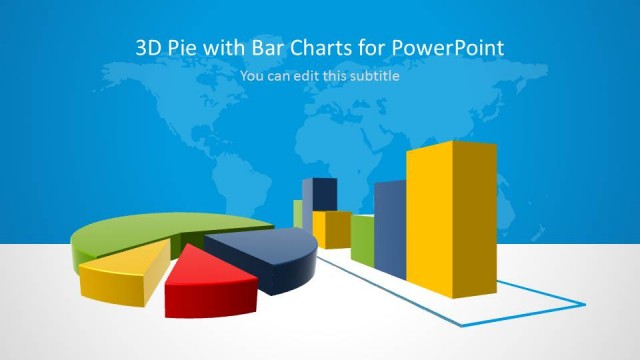
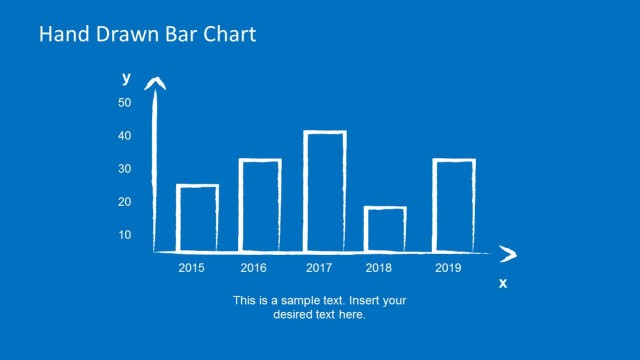
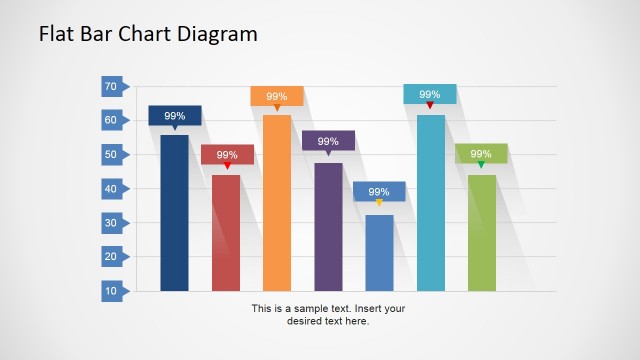
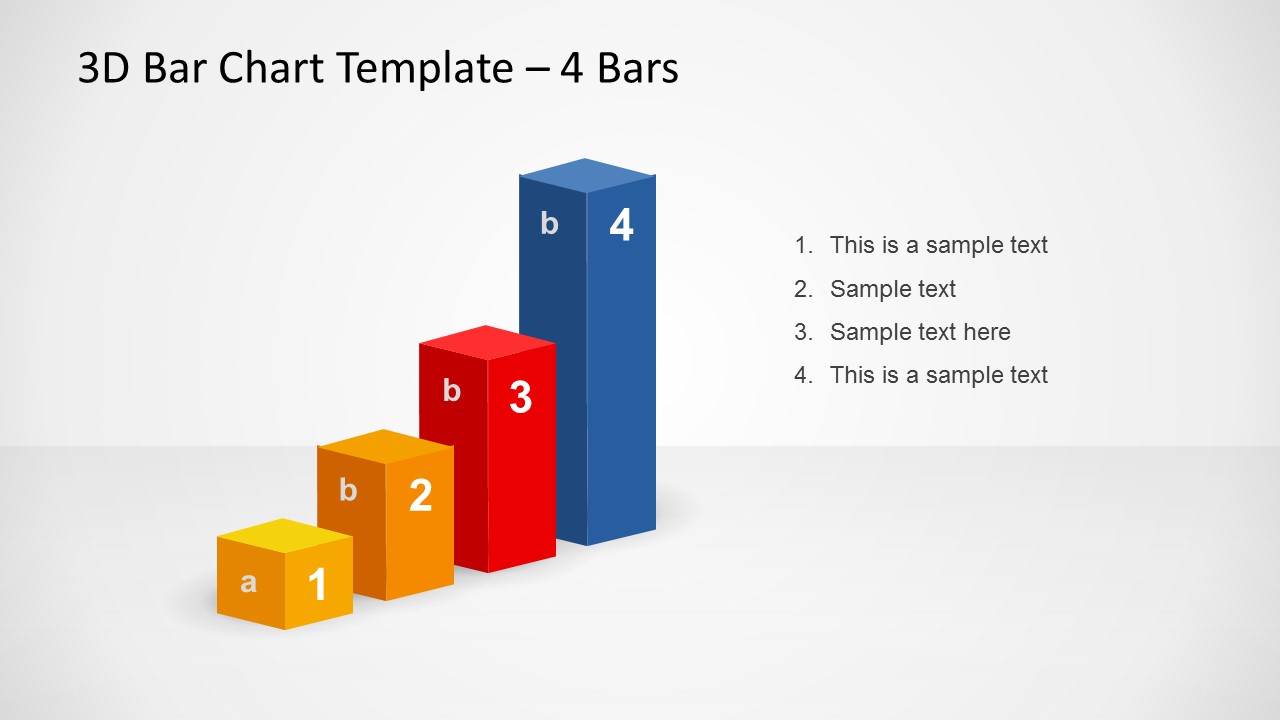
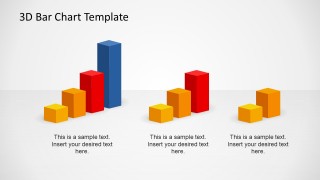
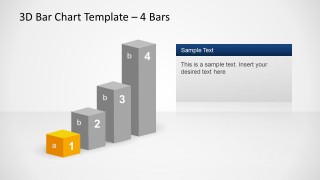
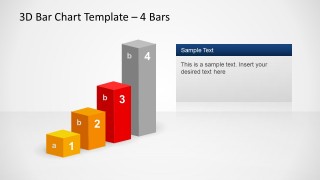
3D Bar Chart Template slide design template for PowerPoint is a creative chart containing four stages or bars and created with PowerPoint shapes so you can easily edit the bar chart color and properties.
This 3D template for PowerPoint with bar charts can be used to make awesome presentations in PowerPoint and present data while keeping the audience focused in your presentation. This Bar Graph Template for PowerPoint contains six slide designs with 3D chart slide design and colorful bar charts that you can use in marketing presentations, business presentations as well as financial PowerPoint or PPT presentations. Each bar chart contains a number and letters that you can easily edit.
What’s inside this template
Example presentation scenarios
- A marketing manager can use the colored ascending bar chart to report four campaign performance levels and place the main interpretation in the adjacent callout panel.
- A finance analyst can use the numbered four-bar layout to compare quarterly figures, budget categories, or revenue tiers while keeping supporting notes in the list area.
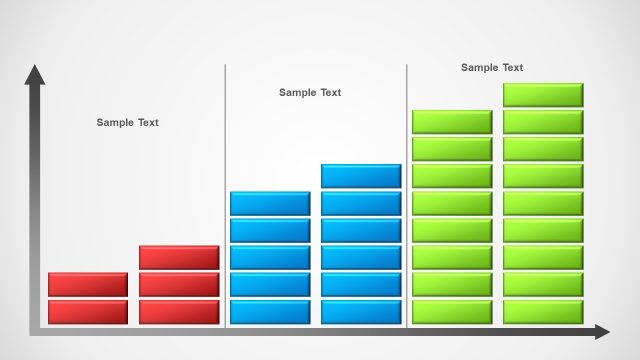
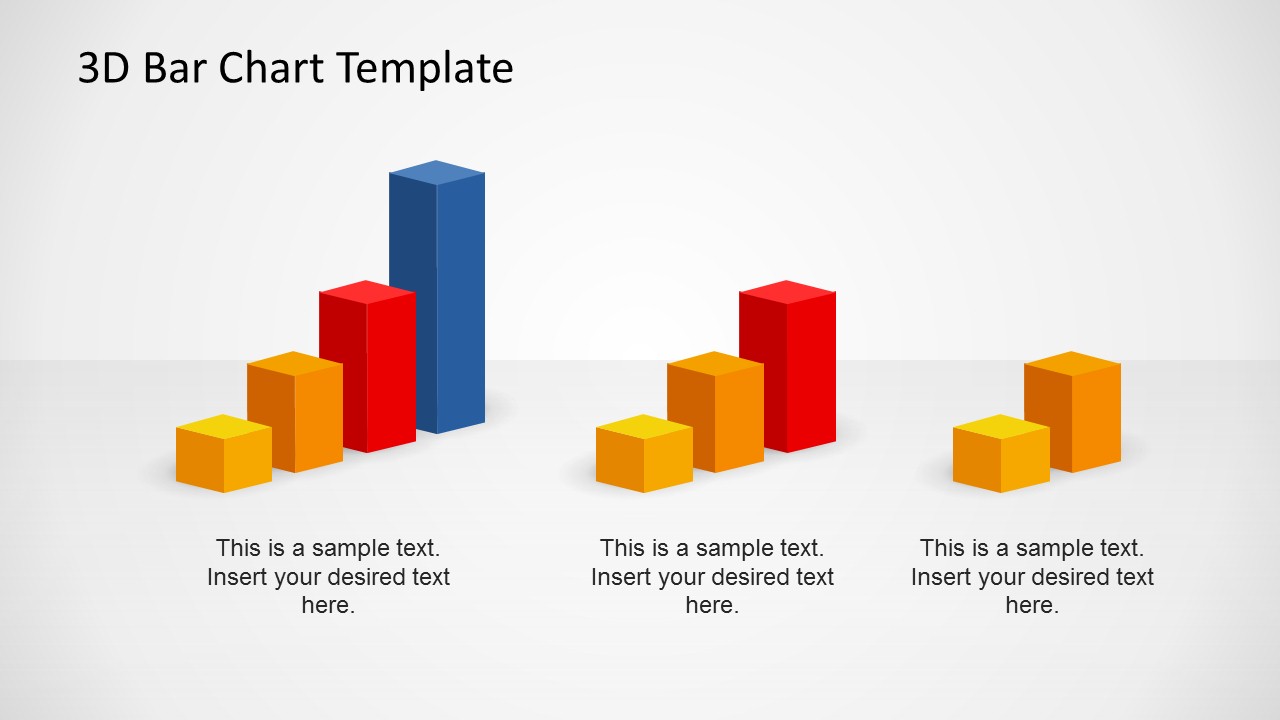
- A sales leader can use the three grouped mini-bar charts to compare regional pipeline stages and explain each group with the caption text below.
- A consultant can use the progressive gray-to-color variants to walk an executive audience through four maturity levels or implementation stages.
Features
- 100% editable presentation template
- Compatible with Microsoft PowerPoint
- 16:9 aspect ratio slides
- Scalable vector shapes, icons and illustrations
- AI-Ready for Microsoft Copilot and Claude
- Instant access and download
Frequently asked questions
Q: How should a presenter communicate data with this 3D four-bar chart without distracting from the message?
A: Assign one clear meaning to each bar before adding supporting text. Use the bar height and number labels for the primary comparison, then reserve the right-side callout or list for interpretation, not raw detail. The strongest delivery pairs one short takeaway with the visible rise across the four bars.
Q: What type of business message is this template best suited for?
A: This template fits messages where four values, stages, tiers, or priorities need to be compared quickly. It works well for marketing performance, sales progress, financial categories, and maturity models. Presenters who need an executive-friendly visual can use the bar chart as the main evidence and the callout panel for the decision point.
Q: Why does the 3D rising bar metaphor help the audience understand the story?
A: The rising bar sequence creates an immediate visual metaphor for growth, ranking, or advancement. Because each bar is numbered, the audience can follow the order without reading much text. The repeated gray-to-color variants also help presenters reveal focus, showing which stage is being discussed while the full four-part structure stays visible.




3D Bar Chart Template Design for PowerPoint with 4 Bars
6-slide PowerPoint presentation template with 3D four-bar charts, callout panels, and business data visuals
The 6-slide Microsoft PowerPoint template shows a 3D four-bar chart for comparing staged values or upward progress. Visible layouts include an ascending numbered bar chart with list notes, three mini bar chart groups, and bar chart variants paired with a right-side text callout panel. It is suited to business, marketing, and financial presentations.
- Category
- Data & Charts
- Rating


 Loading...
- Aspect ratio
- 16:9
- Item ID
- 6546-01
- Colors
 Microsoft PowerPoint
  Microsoft Copilot
  Claude for PowerPoint
 Other formats supported
Subscribe today and get immediate
access to download our PowerPoint templates.