Operational Report PowerPoint Template
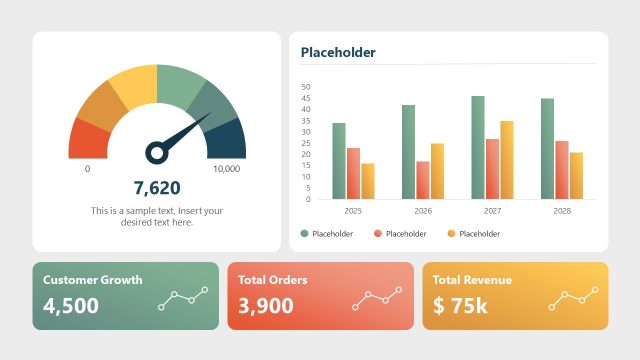
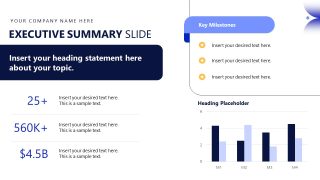
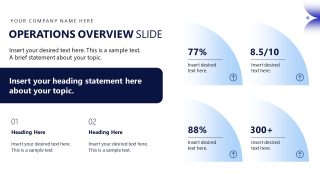
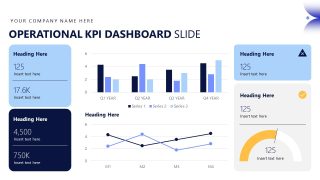
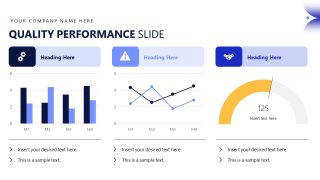
Present the KPIs and process efficiency report in the business presentations with our comprehensive Operational Report PowerPoint Template. An operational report presentation is a briefing for executive leaders on the current system’s performance and the need for improvement. The operational report PPT deck has 12 purpose-built slides, each for a specific reporting function. The cover slide is dark navy with white text and curved geometric shapes, making the design feel impactful. Then, we have slides for the agenda, executive summary, operations overview, KPI dashboard, and production output. The KPI dashboard slide provides multiple data visualizations to help analysts and business consultants inform decisions about the next execution steps. There are a double-line chart and a column chart to communicate trends, patterns, and other insights.
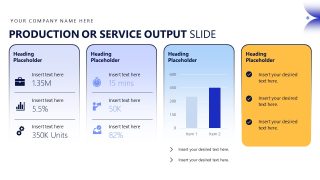
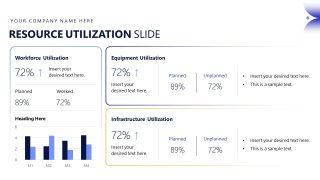
The product output slide uses a four-column layout to illustrate service output in numerical, percentage, and icon formats. Startup leaders or entrepreneurs use this operational report deck to highlight achievements or quality performance to investors. This let them build trust and credibility and ultimately secure funding for business-scaling plans. The multisegment layout of the resource utilization slide lets program managers showcase the stats related to:
- Workforce utilization
- Equipment utilization
- Infrastructure utilization
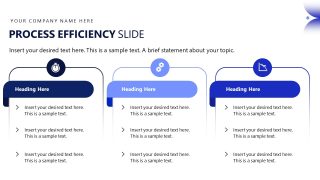
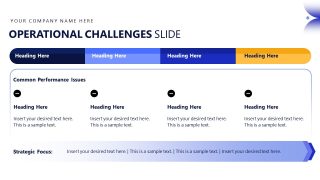
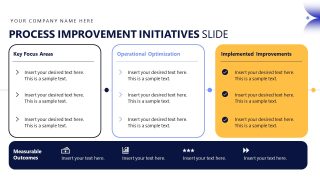
The correct analysis of these utilizations and process efficiency allows strategy leaders to make better decisions for the company’s growth and system improvement. Project managers share operational challenges with decision-makers using this Operational Report PowerPoint Template to drive new initiatives to optimize quality performance. We allow users to customize this animated PPT template based on the theme’s needs. Sales executives can repurpose the layout to create pitch decks or board presentation proposals. Download the operational report slide deck for your next reporting presentation and outline the efficiency metrics effectively.


You must be logged in to download this file.
DOWNLOAD- Category
- Business PowerPoint Templates
- Rating

 Loading...
- Size
- 16x9
- Item ID
- 85325-01
- Colors
Subscribe today and get immediate
access to download our PowerPoint templates.