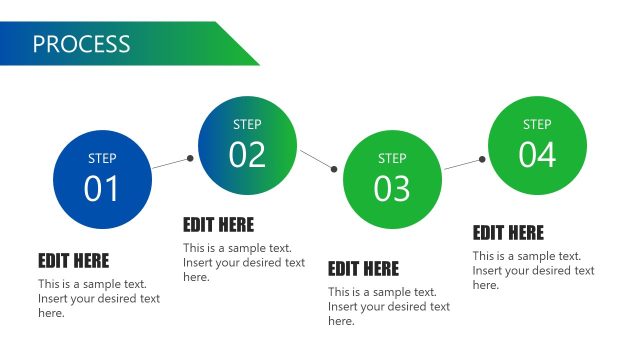
Slide 7 of 13 from Operational Report PowerPoint Template
Process Efficiency Slide – Operational Report Template
Process Efficiency Slide for Operational Reports
- Text Layout
- List Blocks
- Process Slide
- 16:9
- 100% Editable
The Process Efficiency Slide from the Operational Report PowerPoint Template offers a clear layout to present operational metrics and process improvements. Designed with editable shapes and vector icons, this slide supports business presentations focused on efficiency initiatives. Its structured format enhances communication of key performance data within corporate presentations or pitch deck templates.
What’s on This Slide
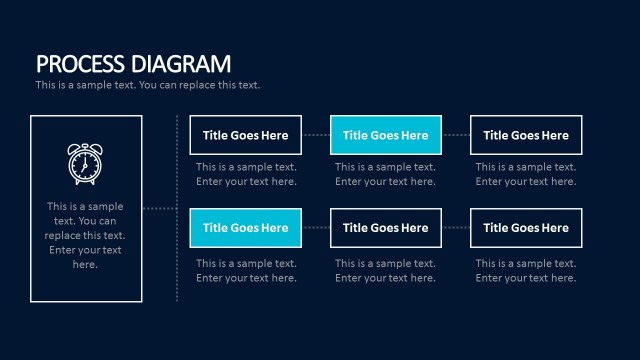
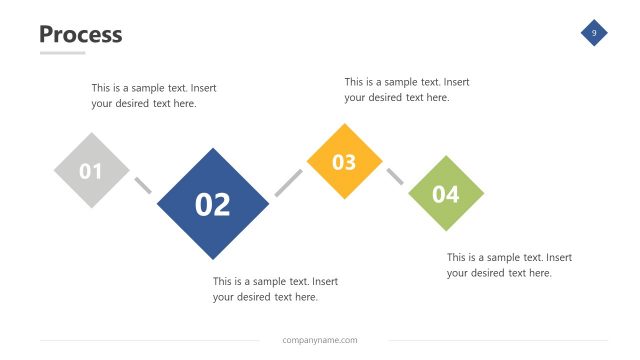
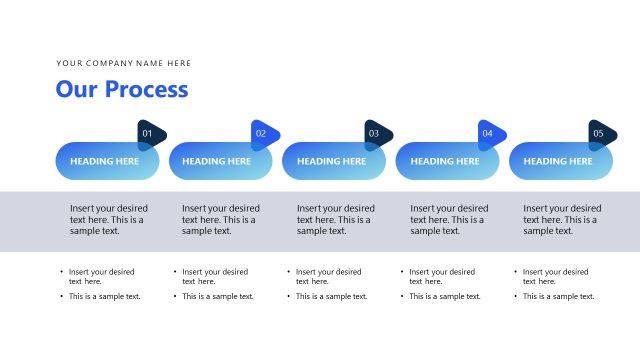
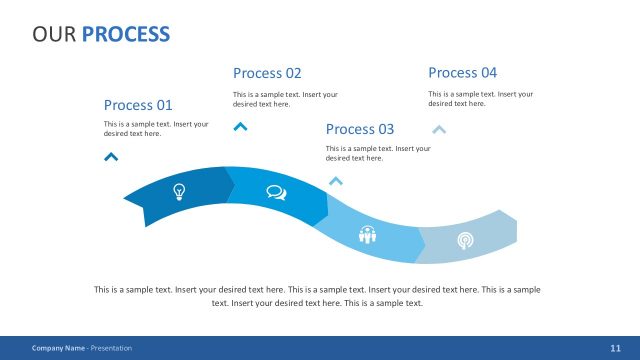
The layout features three distinct sections aligned horizontally across the slide. Each section contains a rounded rectangular container with a heading at the top, followed by a bullet point list. The leftmost section includes a stopwatch icon, the middle section features a gear icon, and the rightmost section displays a checklist icon. Text placeholders are positioned centrally within each container, with bullet points aligned to the left. The background is a gradient of blue tones, enhancing visual separation between sections. The overall composition is balanced and organized, emphasizing clarity.
How to Use It
This layout serves as a structured approach to present process efficiency metrics or initiatives. It fits within a performance review or operational briefing, allowing for clear comparisons across three key areas. Ideal for scenarios such as reporting on operational improvements, efficiency metrics, or strategic initiatives. It can be used to highlight progress in specific processes, making it suitable for both internal and external presentations focused on operational excellence.
Text Placeholders & Capacity
Keep your copy within these limits so it fits without resizing. Node body slots can accommodate roughly 25-30 words each.
| Placeholder | Count | Max characters (approx.) |
|---|---|---|
| Slide title | 1 | 30 |
| Item heading | 3 | 20 |
| Item body | 3 | 150 |
Slide Keywords
Download unlimited PowerPoint templates, charts and graphics for your presentations with our annual plan.
DOWNLOADReturn to Operational Report PowerPoint Template.