Slide 6 of 13 from Operational Report PowerPoint Template
Products & Services Demonstration PPT Slide
Production or Service Output Slide Overview
- Text Layout
- Other
- Performance Review Slide
- 16:9
- 100% Editable
The Production or Service Output Slide from the Operational Report PowerPoint Template offers a structured layout ideal for presenting performance metrics and KPIs. Designed with editable shapes and vector icons, this slide supports clear communication of operational efficiency data within business presentations or corporate slide decks.
What’s on This Slide
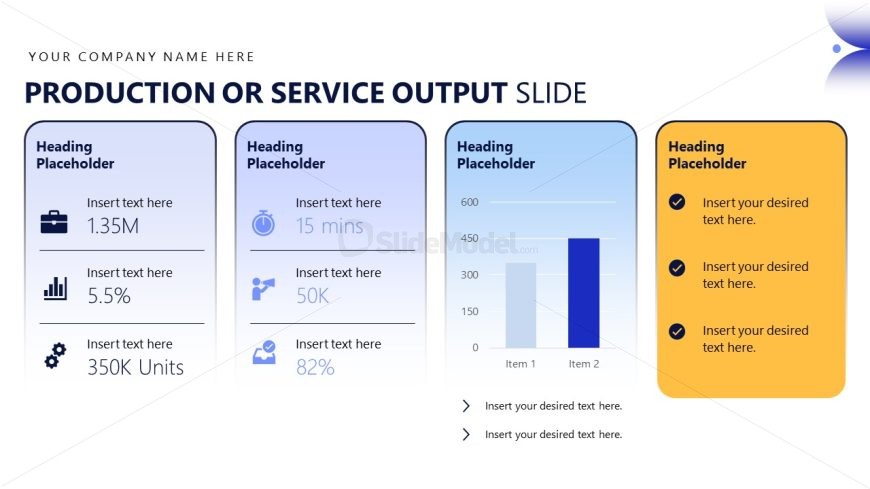
The layout features four distinct sections arranged horizontally. The leftmost three sections contain text placeholders for headings and data points, with icons representing various metrics. Each section has a light gradient background, transitioning from white to light blue. The fourth section on the right includes a bar chart with two bars representing different items, accompanied by text placeholders beneath. The visual hierarchy emphasizes the bar chart, while the sections are separated by subtle borders. Text placeholders are aligned to the left in each section, with a consistent font style throughout.
How to Use It
This layout serves as a performance overview, summarizing production or service output metrics. It fits well in a business presentation sequence after operational reviews or performance summaries. This structure is useful for reporting on key performance indicators, such as production volume, efficiency rates, and service delivery times. It can be applied in meetings focused on operational excellence or performance reviews, allowing stakeholders to quickly grasp essential metrics.
Text Placeholders & Capacity
Keep your copy within these limits so it fits without resizing. Body slots are tight, roughly 5-15 words each.
| Placeholder | Count | Max characters (approx.) |
|---|---|---|
| Slide title | 1 | 30 |
| Item heading | 3 | 20 |
| Item body | 3 | 15 |
| Chart title | 1 | 30 |
| Item body | 2 | 20 |
Slide Keywords
Download unlimited PowerPoint templates, charts and graphics for your presentations with our annual plan.
DOWNLOADReturn to Operational Report PowerPoint Template.